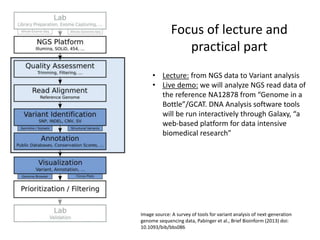
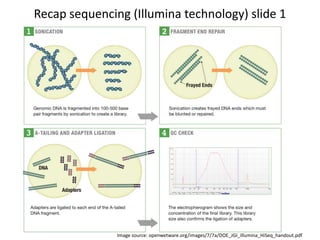
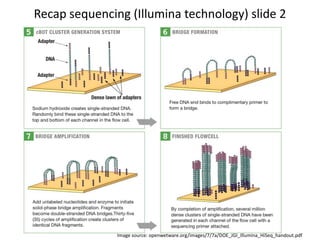
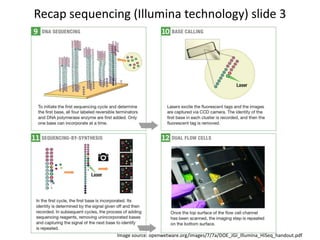
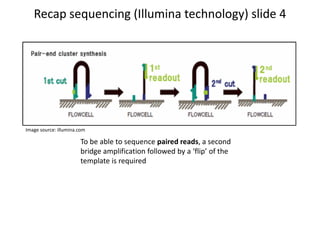
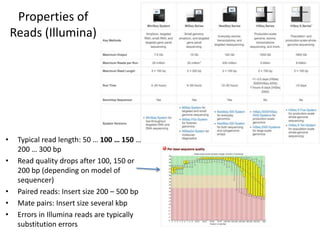
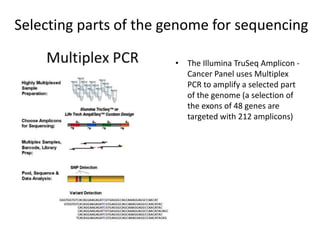
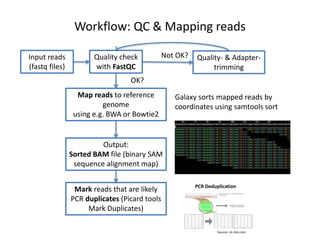
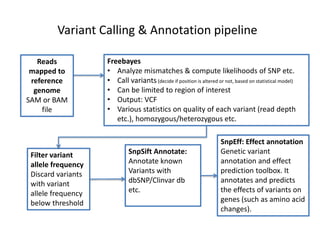
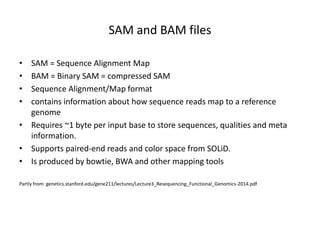
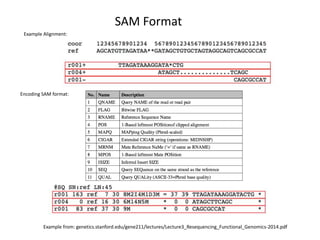
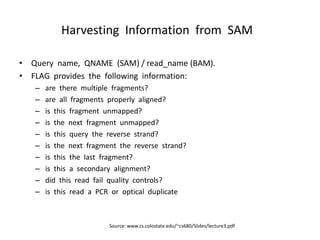
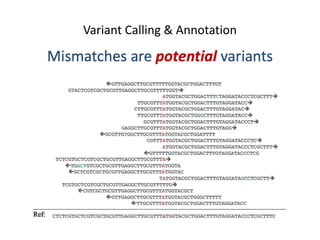
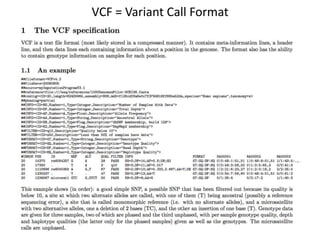
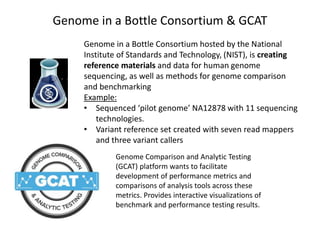
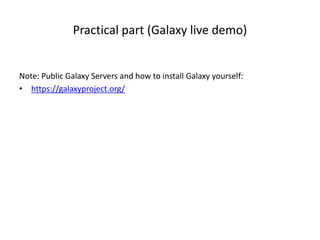
Introduction to Variant Analysis
of Exome- and Amplicon sequencing data
Lecture by:
Date:
Dr. Christian Rausch
26 April 2016
About CCA-Drylab@VUmc, TraIT, Galaxy Project
• CCA-Drylab at the VU University Medical Center Amsterdam is the
Bioinformatics initiative of the Cancer Center Amsterdam (CCA). One goal
is to give trainings in bioinformatics and make workflows available to
researchers. Galaxy was selected as a tool to achieve this.
• TraIT (Translational Research IT) is a Dutch national project which is part of
CTMM, the Center for Translational Molecular Medicine.
• TraIT is a scientific IT project with the goal to enable integration and
querying of information across the four major domains of translational
research: clinical, imaging, biobanking and experimental (any-omics) with
a particular focus on the needs of multi-center projects.
• Galaxy is one of the tools supported and extended by TraIT
• Galaxy is an international project lead by teams at Pen State and Johns
Hopkins University (15 FTEs working on the development). It is a graphical
bioinformatics analysis platform aimed at Computational Biologists.
Focus of lecture and
practical part
• Lecture: from NGS data to Variant analysis
• Live demo: we will analyze NGS read data of
the reference NA12878 from “Genome in a
Bottle”/GCAT. DNA Analysis software tools
will be run interactively through Galaxy, “a
web-based platform for data intensive
biomedical research”
Image source: A survey of tools for variant analysis of next-generation
genome sequencing data, Pabinger et al., Brief Bioinform (2013) doi:
10.1093/bib/bbs086
Recap on Illumina’s sequencing technology
Recap sequencing (Illumina technology) slide 1
Image source: openwetware.org/images/7/7a/DOE_JGI_Illumina_HiSeq_handout.pdf
Recap sequencing (Illumina technology) slide 2
Image source: openwetware.org/images/7/7a/DOE_JGI_Illumina_HiSeq_handout.pdf
Recap sequencing (Illumina technology) slide 3
Image source: openwetware.org/images/7/7a/DOE_JGI_Illumina_HiSeq_handout.pdf
Recap sequencing (Illumina technology) slide 4
To be able to sequence paired reads, a second
bridge amplification followed by a ‘flip’ of the
template is required
Image source: illumina.com
Properties of
Reads (Illumina)
• Typical read length: 50 … 100 … 150 …
200 … 300 bp
• Read quality drops after 100, 150 or
200 bp (depending on model of
sequencer)
• Paired reads: Insert size 200 – 500 bp
• Mate pairs: Insert size several kbp
• Errors in Illumina reads are typically
substitution errors
Properties of
Reads (Illumina)
• Paired reads: Insert size 200 – 500 bp
• Mate pairs: Insert size several kbp Source:
evomics.org/2014/01/alignment-
methods/
Image
source: Mate
Pair v2
Sample Prep
Guide For 2-5
kb Libraries
Comparison Sequencing Platforms
Platform Amplification
Method
Sequencing Method Detection Method Average read length
Illumina (HiSeq,
MiSeq etc)
bridge PCR sequencing by
synthesis
Light 100-200 bp
Life Tech Ion Torrent
/ Proton
emulsion PCR Ion semiconductor
sequencing
pH 200-400 bp
Roche 454 emulsion PCR Pyrosequencing,
cleavage of released
pyrophosphate
light 700 bp
Life Tech SOLiD emulsion PCR sequencing by
ligation of
hybridizing labeled
oligos
light 100 bp
Pacific Biosciences
PacBio / Sequel
System
No amplification,
single-molecule
sequencing
polymerase
incorporating
colored NTPs
light 10 kb, 50% >20 kb,
5% > 30 kb
Oxford Nanopore
MinION
No amplification,
single molecule
nanopore
sequencing
DNA molecule
traverses pore
current > 5.4 kb
Further reading, great lecture: Sequencing technology - Past, Present and Future, http://www.molgen.mpg.de/899148/OWS2013_NGS.pdf
MinION: Oxford Nanopore’s “3rd generation” Sequencer:
Image source: John MacNeill,
http://www2.technologyreview.com/article/427677/nanopore-
sequencing
• Based on biological nano-machines,
reading single DNA molecules
• DNA Sequencer ‘MinION’ size of USB
drive
• Extremely fast (first results ~1h)
• Much longer reads than currently
established sequencing technologies
 Puzzle with large parts is easier
than with small ones
• Used by more and more leading labs
Example of a relevant recent publication:
http://publications.nanoporetech.com/2015/10/05/nanopore-sequencing-detects-structural-variants-in-cancer/
Target enrichment
used for selecting
exomes
• Image source: Agilent
Selecting parts of the genome for sequencing
• The Illumina TruSeq Amplicon -
Cancer Panel uses Multiplex
PCR to amplify a selected part
of the genome (a selection of
the exons of 48 genes are
targeted with 212 amplicons)
Intro Bioinformatics: NGS based Variant Analysis
Workflow: QC & Mapping reads
Input reads
(fastq files)
Quality check
with FastQC
Quality- & Adapter-
trimming
Not OK?
OK?
Map reads to reference
genome
using e.g. BWA or Bowtie2
Output:
Sorted BAM file (binary SAM
sequence alignment map)
Galaxy sorts mapped reads by
coordinates using samtools sort
Mark reads that are likely
PCR duplicates (Picard tools
Mark Duplicates)
Source: clc-bio.com
PCR Deduplication
Variant Calling & Annotation pipeline
Reads
mapped to
reference
genome
SAM or BAM
file
Freebayes
• Analyze mismatches & compute likelihoods of SNP etc.
• Call variants(decide if position is altered or not, based on statistical model)
• Can be limited to region of interest
• Output: VCF
• Various statistics on quality of each variant (read depth
etc.), homozygous/heterozygous etc.
Filter variant
allele frequency
Discard variants
with variant
allele frequency
below threshold
SnpSift Annotate:
Annotate known
Variants with
dbSNP/Clinvar db
etc.
SnpEff: Effect annotation
Genetic variant
annotation and effect
prediction toolbox. It
annotates and predicts
the effects of variants on
genes (such as amino acid
changes).
Quality Measure: Phred Score
Phred quality score
Probability that the base
is called wrong
Accuracy of the base call
10 1 in 10 90%
20 1 in 100 99%
30 1 in 1,000 99.9%
40 1 in 10,000 99.99%
50 1 in 100,000 99.999%
Quality Measure: Phred Score
• Phred score = quality scores
• originally developed by the base calling program Phred used with Sanger
sequencing data
• Phred quality score Q is defined as a property which is logarithmically
related to the base-calling error probability P
• Error rate P = 10 – (Phred score Q / 10)
• Q = -10 log10 P
• Example: Phred score 30 = error rate 10-3 = 1 base in 1000 will be wrong
• Illumina’s ‘Q score’ = Phred score = Quality score in Sanger sequencing
• The base calling programs that convert raw data to sequence data (the
‘base callers’) need to be ‘trained’ to give realistic quality values
• format
standard format to store sequence data (DNA and protein seq.)
>FASTA header, often contains unique identifiers and descriptions of the sequence
@unique identifiers and optional descriptions of the sequence
the actual DNA sequence
+ separator optionally followed by description
The quality values of the sequence
(one character per nucleotide)
standard format to sequencing reads with quality information
(‘Q’ stands for Quality)
More info see wikipedia ‘FASTQ_format’
Quality control
with FastQC
• Need to check the
quality of reads
before further
analysis
• Program FastQC is
quasi standard
• Sequencing
platform
companies provide
also their own
tools for quality
control
Quality control: FastQC
• Encoding tells which set of
characters stands for which
Phred scores.
• There’s also Encoding Illumina
1.5 and others.
• Other programs might not
automatically recognize the
encoding
• In Galaxy there is a possibility to
set the encoding of a FastQ file
via the ‘pen’ symbol.
Read Quality Control with FastQC
Examples of per base sequence quality
of all reads
 Historical example of very first Solexa
reads 2006 (Solexa acquired by Illumina 2007)
Not so good, might still be usable,
depending on application
50 bp
Examples of
other
quality
measures in
FastQC
• Upper 4 graphs
from the data set
of the practical
course:
• Many reads are
repeated
• Apparently not
uniformly
distributed over
whole genome
• Overrepresented
sequences:
Sequenced
fragment was too
short and
sequencing
reaction ran into
the Adapter/PCR
primer
“Mapping reads to the reference” is
finding where their sequence occurs in the genome
Source: Wikimedia, file:Mapping Reads.png
100 bp identified 100 bp identified200 – 500 bp unknown sequence
“Mapping reads to the reference”:
naïve text search algorithms are too slow
• Naïve approach: compare each read with every position in the genome
– Takes too long, will not find sequences with mismatches
• Search programs typically create an index of the reference sequence (or
text) and store the reference sequence (text) in an advanced data
structure for fast searching.
• An index is basically like a phone book (with
people’s addresses)  Quickly find address
(location) of a person
Example of algorithm using ‘indexed
seed tables’ to quickly find locations
of exact parts of a read
“Mapping reads to the reference”: frequently used
programs
• BLAST, the most famous bioinformatics program since 1990, is used to find
similar sequences in DNA and protein data bases
– 0.1-1 sec to find a result
– Mapping 60 million reads would take ~ 2 months on one CPU1  too slow
for NGS
• Popular tools for read mapping:
– Bowtie, Bowtie2, BWA, SOAP2, MAQ, RMAP, GSNAP, Novoalign, and
mrsFAST/mrFAST: Hatem et al. BMC Bioinformatics 2013, 14:184
http://www.biomedcentral.com/1471-2105/14/184
– CLCbio read mapper (commercial)
– No tool is the best tool in all example conditions
– differences in speed
– Differently optimized for mismatches/gap models/Insertions &
Deletions/taking into account read base quality/local realignment of matches
etc.
Read Mappers: BWA and Bowtie2
Are based on the Burrows-Wheeler Transformation (BWT)
• BWT: special sorting of all letters in the text (sequence)
• Similar suffixes (word ends) will be close to each other
• Easier to compress
• Good for approximate string matching (sequence alignment)
• Index (FM index) for finding the locations of matched strings (sequences)
in the genome
Read Mapping: General problems
• Read can match equally well at more than one location (e.g. repeats,
pseudo-genes)
• Even fit less well to it’s actual position, e.g. if it carries a break point,
insertions and/or deletions
SAM and BAM files
• SAM = Sequence Alignment Map
• BAM = Binary SAM = compressed SAM
• Sequence Alignment/Map format
• contains information about how sequence reads map to a reference
genome
• Requires ~1 byte per input base to store sequences, qualities and meta
information.
• Supports paired-end reads and color space from SOLiD.
• Is produced by bowtie, BWA and other mapping tools
Partly from: genetics.stanford.edu/gene211/lectures/Lecture3_Resequencing_Functional_Genomics-2014.pdf
SAM Format
Example from: genetics.stanford.edu/gene211/lectures/Lecture3_Resequencing_Functional_Genomics-2014.pdf
Example Alignment:
Encoding SAM format:
Harvesting Information from SAM
• Query name, QNAME (SAM) / read_name (BAM).
• FLAG provides the following information:
– are there multiple fragments?
– are all fragments properly aligned?
– is this fragment unmapped?
– is the next fragment unmapped?
– is this query the reverse strand?
– is the next fragment the reverse strand?
– is this the last fragment?
– is this a secondary alignment?
– did this read fail quality controls?
– is this read a PCR or optical duplicate
Source: www.cs.colostate.edu/~cs680/Slides/lecture3.pdf
Variant Calling & Annotation
Possible reasons for a mismatch
• True SNP or Mutation
• Error generated in library preparation
• Base calling error
– May be reduced by better base calling methods, but cannot be eliminated
• Misalignment (mapping error):
– Local re-alignment to improve mapping
• Error in reference genome sequence
Partly from www.biostat.jhsph.edu/~khansen/LecSNP2.pdf
Variant Calling: Principles
• Naïve approach (used in early NGS studies):
– Filter base calls according to quality
– Filter by frequency
– Typically, a quality Filter of PHRED Q 20 was used (i.e.,
probability of error 1% ).
– Then, the following frequency thresholds were used according to
the frequency of the non-ref base, f(b):
– The frequency heuristic works well if the sequencing depth is
high, so that the probability of a heterozygous nucleotide falling
outside of the 20% - 80% region is low.
– Problems with frequency heuristic:
• For low sequencing depth, leads to undercalling of heterozygous
genotypes
• Use of quality threshold leads to loss of information on
individual read/base qualities
• Does not provide a measure of confidence in the call
In parts from: compbio.charite.de/contao/index.php/genomics.html
Variant Calling: Principles
• Today’s Variant Callers rely on probability calculations
• Use of Bayes’ Theorem:
– E.g. MAQ: One of the first widely used read mappers and
variant callers
– See introduction at:
https://en.wikipedia.org/wiki/SNV_calling_from_NGS_data
• Takes into account a quality score for whole read
alignment & quality of base at the individual position
• Calls the most likely genotype given observed substitutions
• Reliability score can be calculated
Variant Calling & Annotation: Popular Tools
• SAMtools (Mpileup & Bcftools)
• GATK
• Freebayes
• Varscan2
• Mutec
• MAQ (historic)
VCF = Variant Call Format
• Variant Call Format / BCF = binary version
Variant Annotation with: dbSNP and snpEff
• dbSNP = the Single Nucleotide Polymorphism Database @ NCBI
• Different collections of SNPs are available: ‘all humans’, human
subpopulations, different clinical significance
(www.ncbi.nlm.nih.gov/variation/docs/human_variation_vcf).
• snpEff is a program that can annotate a collection of SNVs according to
information available in dbSNP and information extracted from the location
of the SNV (Exon, Intron, silent/non-sense mutation etc.)
Variant annotation with: ANNOVAR
a versatile tool to annotate genetic variants
(SNPs and CNVs)
• Input:
– variants as VCF file
– various databases with statistical and predictive annotations: dbSNP, 1000 genomes, exome variant
server (Univ. of Washington), …
• Output:
– In coding region? Which gene? How frequently observed in 1000 genomes project? (and more
statistics).
• According to coordinates from RefSeq genes, UCSC genes, ENSEMBL genes, GENCODE genes or
others, etc.
– In non-coding region? Conserved region?
• According to conservation in 44 species, transcription factor binding sites, GWAS hits, etc.
– Predicted Effect?
• SIFT predicts whether an amino acid substitution affects protein function. SIFT prediction is
based on the degree of conservation of amino acid residues in sequence alignments derived
from closely related sequences, collected through PSI-BLAST. SIFT can be applied to naturally
occurring nonsynonymous polymorphisms or laboratory-induced missense mutations
• PolyPhen-2 (Polymorphism Phenotyping v2) is a tool which predicts possible impact of an
amino acid substitution on the structure and function of a human protein using straightforward
physical and comparative considerations.
• PhyloP: Detection of nonneutral substitution rates on mammalian phylogenies.
Annotation with DGIdb: mining the druggable genome
Drug Gene Interaction Database:
Matching disease genes with potential drugs.
• Searches genes against a compendium of drug-gene interactions and identify
potentially 'druggable' genes
• DGIdb 2.0 Overview:
• New Sources of Drug-Gene Interactions
– CIViC, an open access, open source, community-driven web resource for Clinical Interpretation
of Variants in Cancer.
– DoCM, the Database of Curated Mutations, a highly curated database of known, disease-
causing mutations.
• Automatic updating of sources
– CIViC - drug-gene interactions
– DoCM - drug-gene interactions
– DrugBank - drug-gene interactions
– Gene Ontology - druggable gene categories
– Entrez Gene - genes
– PubChem - drugs
• Search drug-gene interactions by drug identifiers
– Go to the search interactions page and click on the Drugs button to try it out
Genome in a Bottle Consortium & GCAT
Genome in a Bottle Consortium hosted by the National
Institute of Standards and Technology, (NIST), is creating
reference materials and data for human genome
sequencing, as well as methods for genome comparison
and benchmarking
Example:
• Sequenced ‘pilot genome’ NA12878 with 11 sequencing
technologies.
• Variant reference set created with seven read mappers
and three variant callers
Genome Comparison and Analytic Testing
(GCAT) platform wants to facilitate
development of performance metrics and
comparisons of analysis tools across these
metrics. Provides interactive visualizations of
benchmark and performance testing results.
Practical part (Galaxy live demo)
Note: Public Galaxy Servers and how to install Galaxy yourself:
• https://galaxyproject.org/

Galaxy dna-seq-variant calling-presentationandpractical_gent_april-2016

  • 1.
    Introduction to VariantAnalysis of Exome- and Amplicon sequencing data Lecture by: Date: Dr. Christian Rausch 26 April 2016
  • 2.
    About CCA-Drylab@VUmc, TraIT,Galaxy Project • CCA-Drylab at the VU University Medical Center Amsterdam is the Bioinformatics initiative of the Cancer Center Amsterdam (CCA). One goal is to give trainings in bioinformatics and make workflows available to researchers. Galaxy was selected as a tool to achieve this. • TraIT (Translational Research IT) is a Dutch national project which is part of CTMM, the Center for Translational Molecular Medicine. • TraIT is a scientific IT project with the goal to enable integration and querying of information across the four major domains of translational research: clinical, imaging, biobanking and experimental (any-omics) with a particular focus on the needs of multi-center projects. • Galaxy is one of the tools supported and extended by TraIT • Galaxy is an international project lead by teams at Pen State and Johns Hopkins University (15 FTEs working on the development). It is a graphical bioinformatics analysis platform aimed at Computational Biologists.
  • 3.
    Focus of lectureand practical part • Lecture: from NGS data to Variant analysis • Live demo: we will analyze NGS read data of the reference NA12878 from “Genome in a Bottle”/GCAT. DNA Analysis software tools will be run interactively through Galaxy, “a web-based platform for data intensive biomedical research” Image source: A survey of tools for variant analysis of next-generation genome sequencing data, Pabinger et al., Brief Bioinform (2013) doi: 10.1093/bib/bbs086
  • 4.
    Recap on Illumina’ssequencing technology
  • 5.
    Recap sequencing (Illuminatechnology) slide 1 Image source: openwetware.org/images/7/7a/DOE_JGI_Illumina_HiSeq_handout.pdf
  • 6.
    Recap sequencing (Illuminatechnology) slide 2 Image source: openwetware.org/images/7/7a/DOE_JGI_Illumina_HiSeq_handout.pdf
  • 7.
    Recap sequencing (Illuminatechnology) slide 3 Image source: openwetware.org/images/7/7a/DOE_JGI_Illumina_HiSeq_handout.pdf
  • 8.
    Recap sequencing (Illuminatechnology) slide 4 To be able to sequence paired reads, a second bridge amplification followed by a ‘flip’ of the template is required Image source: illumina.com
  • 9.
    Properties of Reads (Illumina) •Typical read length: 50 … 100 … 150 … 200 … 300 bp • Read quality drops after 100, 150 or 200 bp (depending on model of sequencer) • Paired reads: Insert size 200 – 500 bp • Mate pairs: Insert size several kbp • Errors in Illumina reads are typically substitution errors
  • 10.
    Properties of Reads (Illumina) •Paired reads: Insert size 200 – 500 bp • Mate pairs: Insert size several kbp Source: evomics.org/2014/01/alignment- methods/ Image source: Mate Pair v2 Sample Prep Guide For 2-5 kb Libraries
  • 11.
    Comparison Sequencing Platforms PlatformAmplification Method Sequencing Method Detection Method Average read length Illumina (HiSeq, MiSeq etc) bridge PCR sequencing by synthesis Light 100-200 bp Life Tech Ion Torrent / Proton emulsion PCR Ion semiconductor sequencing pH 200-400 bp Roche 454 emulsion PCR Pyrosequencing, cleavage of released pyrophosphate light 700 bp Life Tech SOLiD emulsion PCR sequencing by ligation of hybridizing labeled oligos light 100 bp Pacific Biosciences PacBio / Sequel System No amplification, single-molecule sequencing polymerase incorporating colored NTPs light 10 kb, 50% >20 kb, 5% > 30 kb Oxford Nanopore MinION No amplification, single molecule nanopore sequencing DNA molecule traverses pore current > 5.4 kb Further reading, great lecture: Sequencing technology - Past, Present and Future, http://www.molgen.mpg.de/899148/OWS2013_NGS.pdf
  • 12.
    MinION: Oxford Nanopore’s“3rd generation” Sequencer: Image source: John MacNeill, http://www2.technologyreview.com/article/427677/nanopore- sequencing • Based on biological nano-machines, reading single DNA molecules • DNA Sequencer ‘MinION’ size of USB drive • Extremely fast (first results ~1h) • Much longer reads than currently established sequencing technologies  Puzzle with large parts is easier than with small ones • Used by more and more leading labs Example of a relevant recent publication: http://publications.nanoporetech.com/2015/10/05/nanopore-sequencing-detects-structural-variants-in-cancer/
  • 13.
    Target enrichment used forselecting exomes • Image source: Agilent
  • 14.
    Selecting parts ofthe genome for sequencing • The Illumina TruSeq Amplicon - Cancer Panel uses Multiplex PCR to amplify a selected part of the genome (a selection of the exons of 48 genes are targeted with 212 amplicons)
  • 15.
    Intro Bioinformatics: NGSbased Variant Analysis
  • 16.
    Workflow: QC &Mapping reads Input reads (fastq files) Quality check with FastQC Quality- & Adapter- trimming Not OK? OK? Map reads to reference genome using e.g. BWA or Bowtie2 Output: Sorted BAM file (binary SAM sequence alignment map) Galaxy sorts mapped reads by coordinates using samtools sort Mark reads that are likely PCR duplicates (Picard tools Mark Duplicates) Source: clc-bio.com PCR Deduplication
  • 17.
    Variant Calling &Annotation pipeline Reads mapped to reference genome SAM or BAM file Freebayes • Analyze mismatches & compute likelihoods of SNP etc. • Call variants(decide if position is altered or not, based on statistical model) • Can be limited to region of interest • Output: VCF • Various statistics on quality of each variant (read depth etc.), homozygous/heterozygous etc. Filter variant allele frequency Discard variants with variant allele frequency below threshold SnpSift Annotate: Annotate known Variants with dbSNP/Clinvar db etc. SnpEff: Effect annotation Genetic variant annotation and effect prediction toolbox. It annotates and predicts the effects of variants on genes (such as amino acid changes).
  • 18.
    Quality Measure: PhredScore Phred quality score Probability that the base is called wrong Accuracy of the base call 10 1 in 10 90% 20 1 in 100 99% 30 1 in 1,000 99.9% 40 1 in 10,000 99.99% 50 1 in 100,000 99.999%
  • 19.
    Quality Measure: PhredScore • Phred score = quality scores • originally developed by the base calling program Phred used with Sanger sequencing data • Phred quality score Q is defined as a property which is logarithmically related to the base-calling error probability P • Error rate P = 10 – (Phred score Q / 10) • Q = -10 log10 P • Example: Phred score 30 = error rate 10-3 = 1 base in 1000 will be wrong • Illumina’s ‘Q score’ = Phred score = Quality score in Sanger sequencing • The base calling programs that convert raw data to sequence data (the ‘base callers’) need to be ‘trained’ to give realistic quality values
  • 20.
    • format standard formatto store sequence data (DNA and protein seq.) >FASTA header, often contains unique identifiers and descriptions of the sequence @unique identifiers and optional descriptions of the sequence the actual DNA sequence + separator optionally followed by description The quality values of the sequence (one character per nucleotide) standard format to sequencing reads with quality information (‘Q’ stands for Quality) More info see wikipedia ‘FASTQ_format’
  • 21.
    Quality control with FastQC •Need to check the quality of reads before further analysis • Program FastQC is quasi standard • Sequencing platform companies provide also their own tools for quality control
  • 22.
    Quality control: FastQC •Encoding tells which set of characters stands for which Phred scores. • There’s also Encoding Illumina 1.5 and others. • Other programs might not automatically recognize the encoding • In Galaxy there is a possibility to set the encoding of a FastQ file via the ‘pen’ symbol.
  • 23.
    Read Quality Controlwith FastQC Examples of per base sequence quality of all reads  Historical example of very first Solexa reads 2006 (Solexa acquired by Illumina 2007) Not so good, might still be usable, depending on application 50 bp
  • 24.
    Examples of other quality measures in FastQC •Upper 4 graphs from the data set of the practical course: • Many reads are repeated • Apparently not uniformly distributed over whole genome • Overrepresented sequences: Sequenced fragment was too short and sequencing reaction ran into the Adapter/PCR primer
  • 25.
    “Mapping reads tothe reference” is finding where their sequence occurs in the genome Source: Wikimedia, file:Mapping Reads.png 100 bp identified 100 bp identified200 – 500 bp unknown sequence
  • 26.
    “Mapping reads tothe reference”: naïve text search algorithms are too slow • Naïve approach: compare each read with every position in the genome – Takes too long, will not find sequences with mismatches • Search programs typically create an index of the reference sequence (or text) and store the reference sequence (text) in an advanced data structure for fast searching. • An index is basically like a phone book (with people’s addresses)  Quickly find address (location) of a person Example of algorithm using ‘indexed seed tables’ to quickly find locations of exact parts of a read
  • 27.
    “Mapping reads tothe reference”: frequently used programs • BLAST, the most famous bioinformatics program since 1990, is used to find similar sequences in DNA and protein data bases – 0.1-1 sec to find a result – Mapping 60 million reads would take ~ 2 months on one CPU1  too slow for NGS • Popular tools for read mapping: – Bowtie, Bowtie2, BWA, SOAP2, MAQ, RMAP, GSNAP, Novoalign, and mrsFAST/mrFAST: Hatem et al. BMC Bioinformatics 2013, 14:184 http://www.biomedcentral.com/1471-2105/14/184 – CLCbio read mapper (commercial) – No tool is the best tool in all example conditions – differences in speed – Differently optimized for mismatches/gap models/Insertions & Deletions/taking into account read base quality/local realignment of matches etc.
  • 28.
    Read Mappers: BWAand Bowtie2 Are based on the Burrows-Wheeler Transformation (BWT) • BWT: special sorting of all letters in the text (sequence) • Similar suffixes (word ends) will be close to each other • Easier to compress • Good for approximate string matching (sequence alignment) • Index (FM index) for finding the locations of matched strings (sequences) in the genome
  • 29.
    Read Mapping: Generalproblems • Read can match equally well at more than one location (e.g. repeats, pseudo-genes) • Even fit less well to it’s actual position, e.g. if it carries a break point, insertions and/or deletions
  • 30.
    SAM and BAMfiles • SAM = Sequence Alignment Map • BAM = Binary SAM = compressed SAM • Sequence Alignment/Map format • contains information about how sequence reads map to a reference genome • Requires ~1 byte per input base to store sequences, qualities and meta information. • Supports paired-end reads and color space from SOLiD. • Is produced by bowtie, BWA and other mapping tools Partly from: genetics.stanford.edu/gene211/lectures/Lecture3_Resequencing_Functional_Genomics-2014.pdf
  • 31.
    SAM Format Example from:genetics.stanford.edu/gene211/lectures/Lecture3_Resequencing_Functional_Genomics-2014.pdf Example Alignment: Encoding SAM format:
  • 32.
    Harvesting Information fromSAM • Query name, QNAME (SAM) / read_name (BAM). • FLAG provides the following information: – are there multiple fragments? – are all fragments properly aligned? – is this fragment unmapped? – is the next fragment unmapped? – is this query the reverse strand? – is the next fragment the reverse strand? – is this the last fragment? – is this a secondary alignment? – did this read fail quality controls? – is this read a PCR or optical duplicate Source: www.cs.colostate.edu/~cs680/Slides/lecture3.pdf
  • 33.
  • 34.
    Possible reasons fora mismatch • True SNP or Mutation • Error generated in library preparation • Base calling error – May be reduced by better base calling methods, but cannot be eliminated • Misalignment (mapping error): – Local re-alignment to improve mapping • Error in reference genome sequence Partly from www.biostat.jhsph.edu/~khansen/LecSNP2.pdf
  • 35.
    Variant Calling: Principles •Naïve approach (used in early NGS studies): – Filter base calls according to quality – Filter by frequency – Typically, a quality Filter of PHRED Q 20 was used (i.e., probability of error 1% ). – Then, the following frequency thresholds were used according to the frequency of the non-ref base, f(b): – The frequency heuristic works well if the sequencing depth is high, so that the probability of a heterozygous nucleotide falling outside of the 20% - 80% region is low. – Problems with frequency heuristic: • For low sequencing depth, leads to undercalling of heterozygous genotypes • Use of quality threshold leads to loss of information on individual read/base qualities • Does not provide a measure of confidence in the call In parts from: compbio.charite.de/contao/index.php/genomics.html
  • 36.
    Variant Calling: Principles •Today’s Variant Callers rely on probability calculations • Use of Bayes’ Theorem: – E.g. MAQ: One of the first widely used read mappers and variant callers – See introduction at: https://en.wikipedia.org/wiki/SNV_calling_from_NGS_data • Takes into account a quality score for whole read alignment & quality of base at the individual position • Calls the most likely genotype given observed substitutions • Reliability score can be calculated
  • 37.
    Variant Calling &Annotation: Popular Tools • SAMtools (Mpileup & Bcftools) • GATK • Freebayes • Varscan2 • Mutec • MAQ (historic)
  • 38.
    VCF = VariantCall Format • Variant Call Format / BCF = binary version
  • 39.
    Variant Annotation with:dbSNP and snpEff • dbSNP = the Single Nucleotide Polymorphism Database @ NCBI • Different collections of SNPs are available: ‘all humans’, human subpopulations, different clinical significance (www.ncbi.nlm.nih.gov/variation/docs/human_variation_vcf). • snpEff is a program that can annotate a collection of SNVs according to information available in dbSNP and information extracted from the location of the SNV (Exon, Intron, silent/non-sense mutation etc.)
  • 40.
    Variant annotation with:ANNOVAR a versatile tool to annotate genetic variants (SNPs and CNVs) • Input: – variants as VCF file – various databases with statistical and predictive annotations: dbSNP, 1000 genomes, exome variant server (Univ. of Washington), … • Output: – In coding region? Which gene? How frequently observed in 1000 genomes project? (and more statistics). • According to coordinates from RefSeq genes, UCSC genes, ENSEMBL genes, GENCODE genes or others, etc. – In non-coding region? Conserved region? • According to conservation in 44 species, transcription factor binding sites, GWAS hits, etc. – Predicted Effect? • SIFT predicts whether an amino acid substitution affects protein function. SIFT prediction is based on the degree of conservation of amino acid residues in sequence alignments derived from closely related sequences, collected through PSI-BLAST. SIFT can be applied to naturally occurring nonsynonymous polymorphisms or laboratory-induced missense mutations • PolyPhen-2 (Polymorphism Phenotyping v2) is a tool which predicts possible impact of an amino acid substitution on the structure and function of a human protein using straightforward physical and comparative considerations. • PhyloP: Detection of nonneutral substitution rates on mammalian phylogenies.
  • 41.
    Annotation with DGIdb:mining the druggable genome Drug Gene Interaction Database: Matching disease genes with potential drugs. • Searches genes against a compendium of drug-gene interactions and identify potentially 'druggable' genes • DGIdb 2.0 Overview: • New Sources of Drug-Gene Interactions – CIViC, an open access, open source, community-driven web resource for Clinical Interpretation of Variants in Cancer. – DoCM, the Database of Curated Mutations, a highly curated database of known, disease- causing mutations. • Automatic updating of sources – CIViC - drug-gene interactions – DoCM - drug-gene interactions – DrugBank - drug-gene interactions – Gene Ontology - druggable gene categories – Entrez Gene - genes – PubChem - drugs • Search drug-gene interactions by drug identifiers – Go to the search interactions page and click on the Drugs button to try it out
  • 42.
    Genome in aBottle Consortium & GCAT Genome in a Bottle Consortium hosted by the National Institute of Standards and Technology, (NIST), is creating reference materials and data for human genome sequencing, as well as methods for genome comparison and benchmarking Example: • Sequenced ‘pilot genome’ NA12878 with 11 sequencing technologies. • Variant reference set created with seven read mappers and three variant callers Genome Comparison and Analytic Testing (GCAT) platform wants to facilitate development of performance metrics and comparisons of analysis tools across these metrics. Provides interactive visualizations of benchmark and performance testing results.
  • 44.
    Practical part (Galaxylive demo) Note: Public Galaxy Servers and how to install Galaxy yourself: • https://galaxyproject.org/