


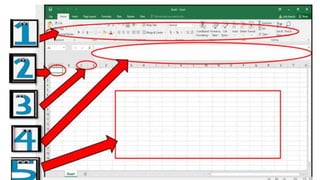

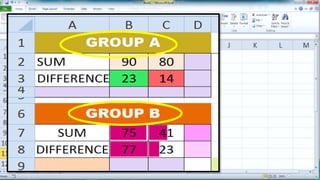


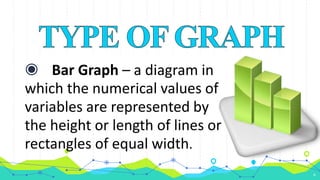


This document discusses creating a bar graph in Microsoft Excel. It identifies the key parts of an Excel window and explains why it is important to follow correct procedures when creating a bar graph in Excel. The summary provides step-by-step instructions for creating a table with student data, calculating grade point averages, and generating a suitable graph to visualize the data.