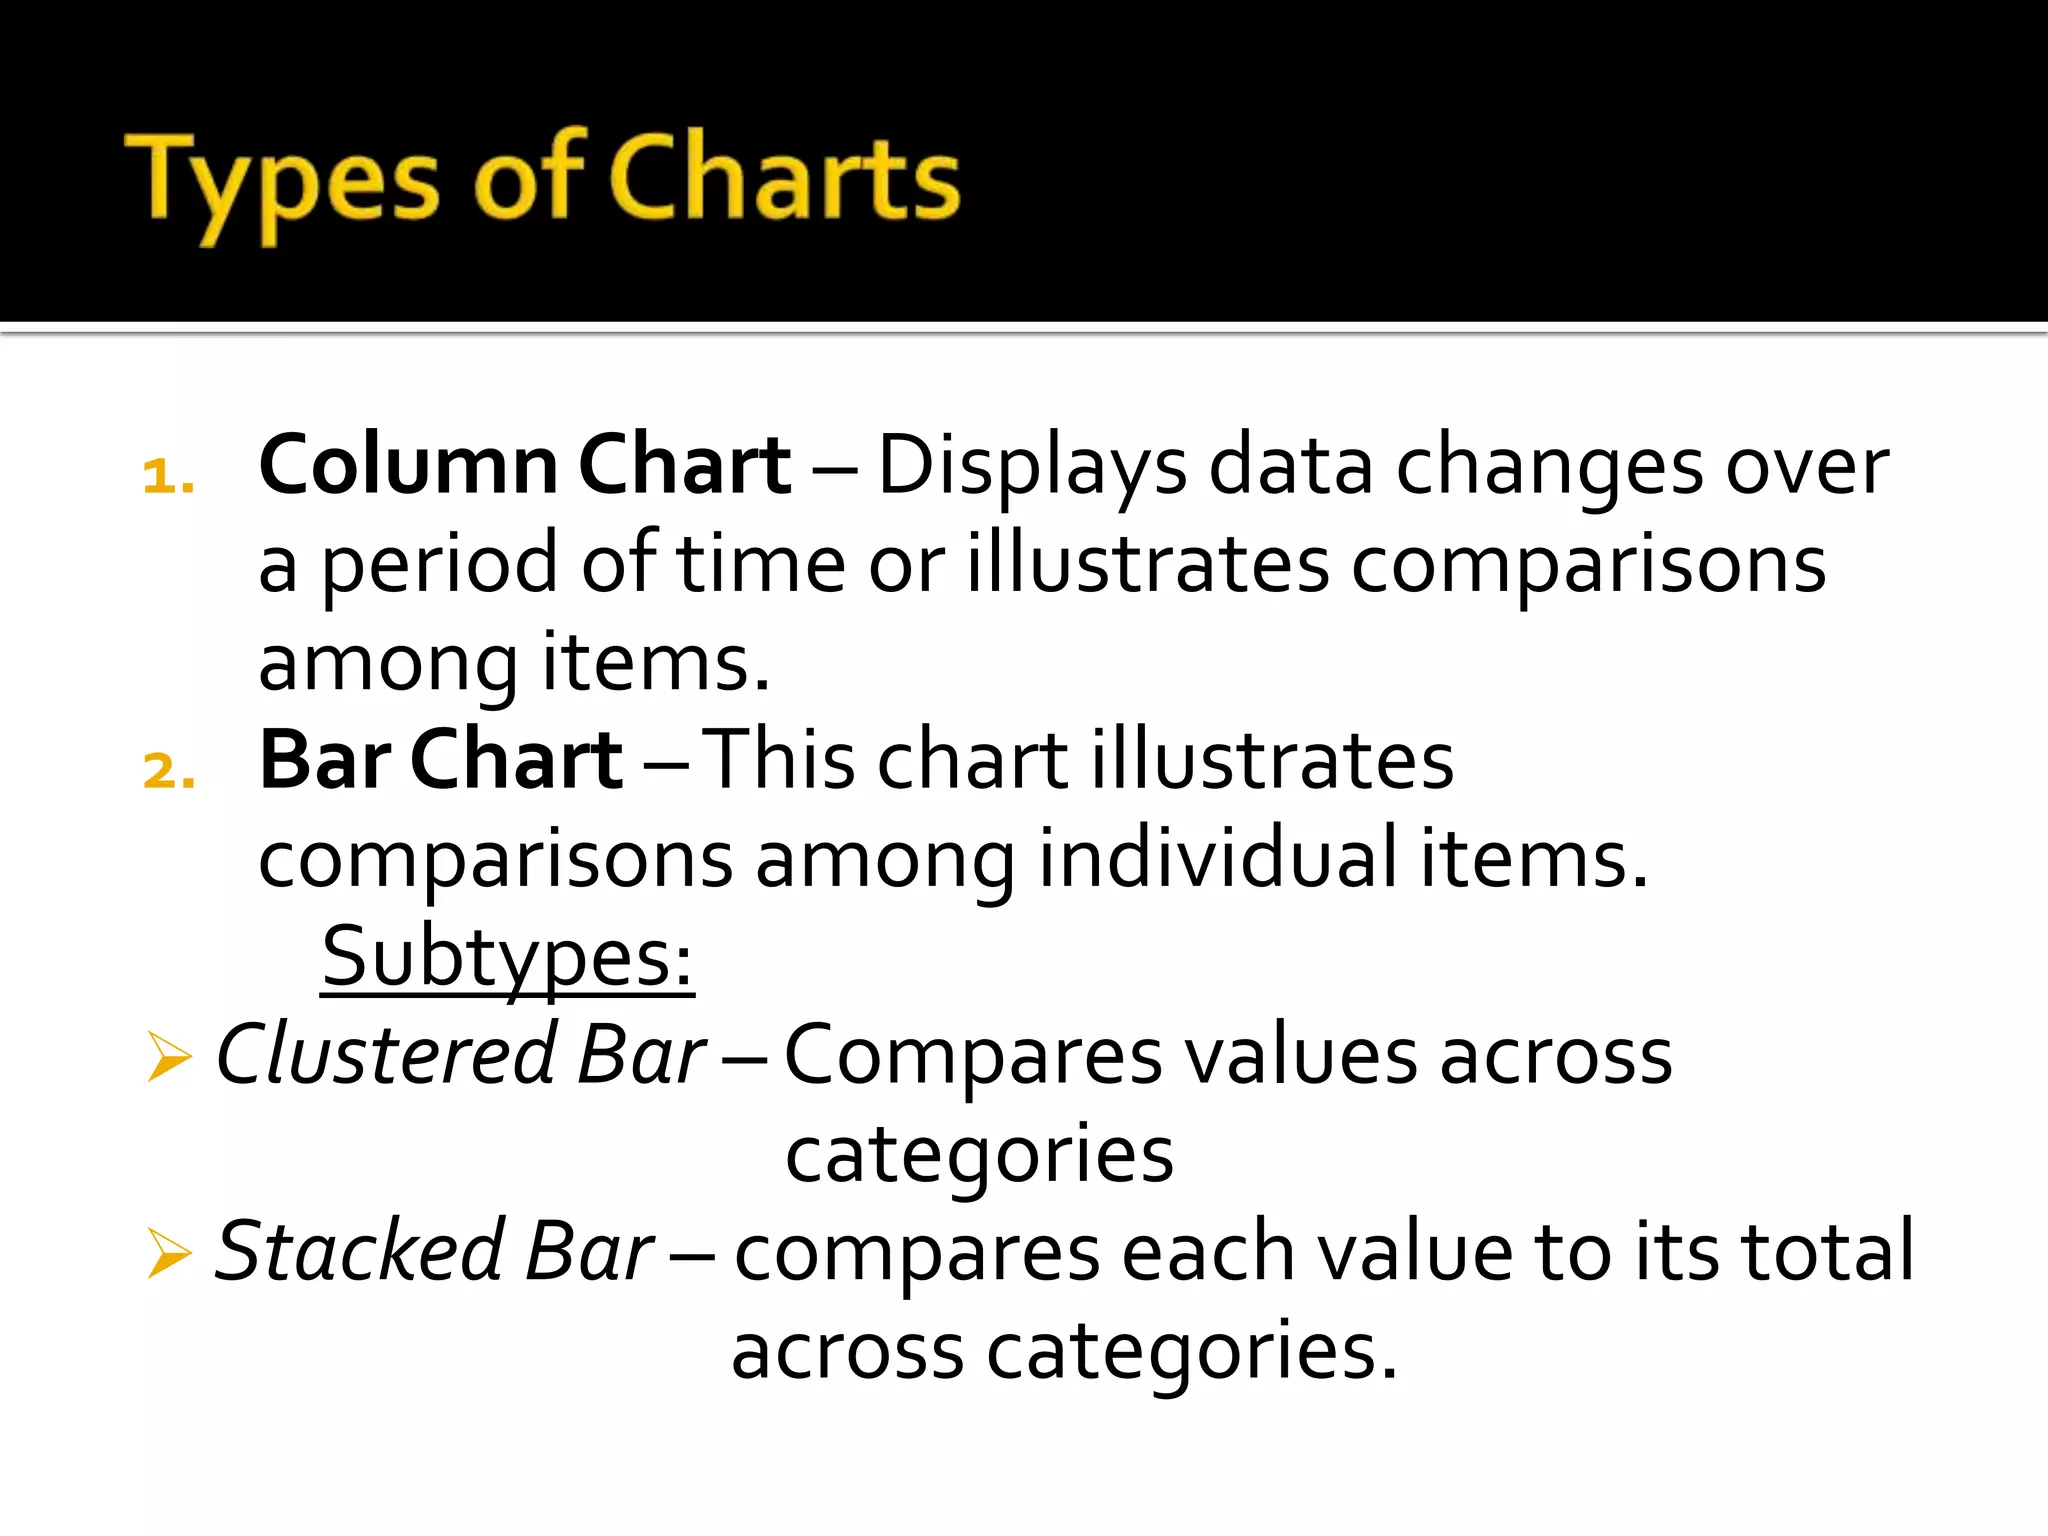
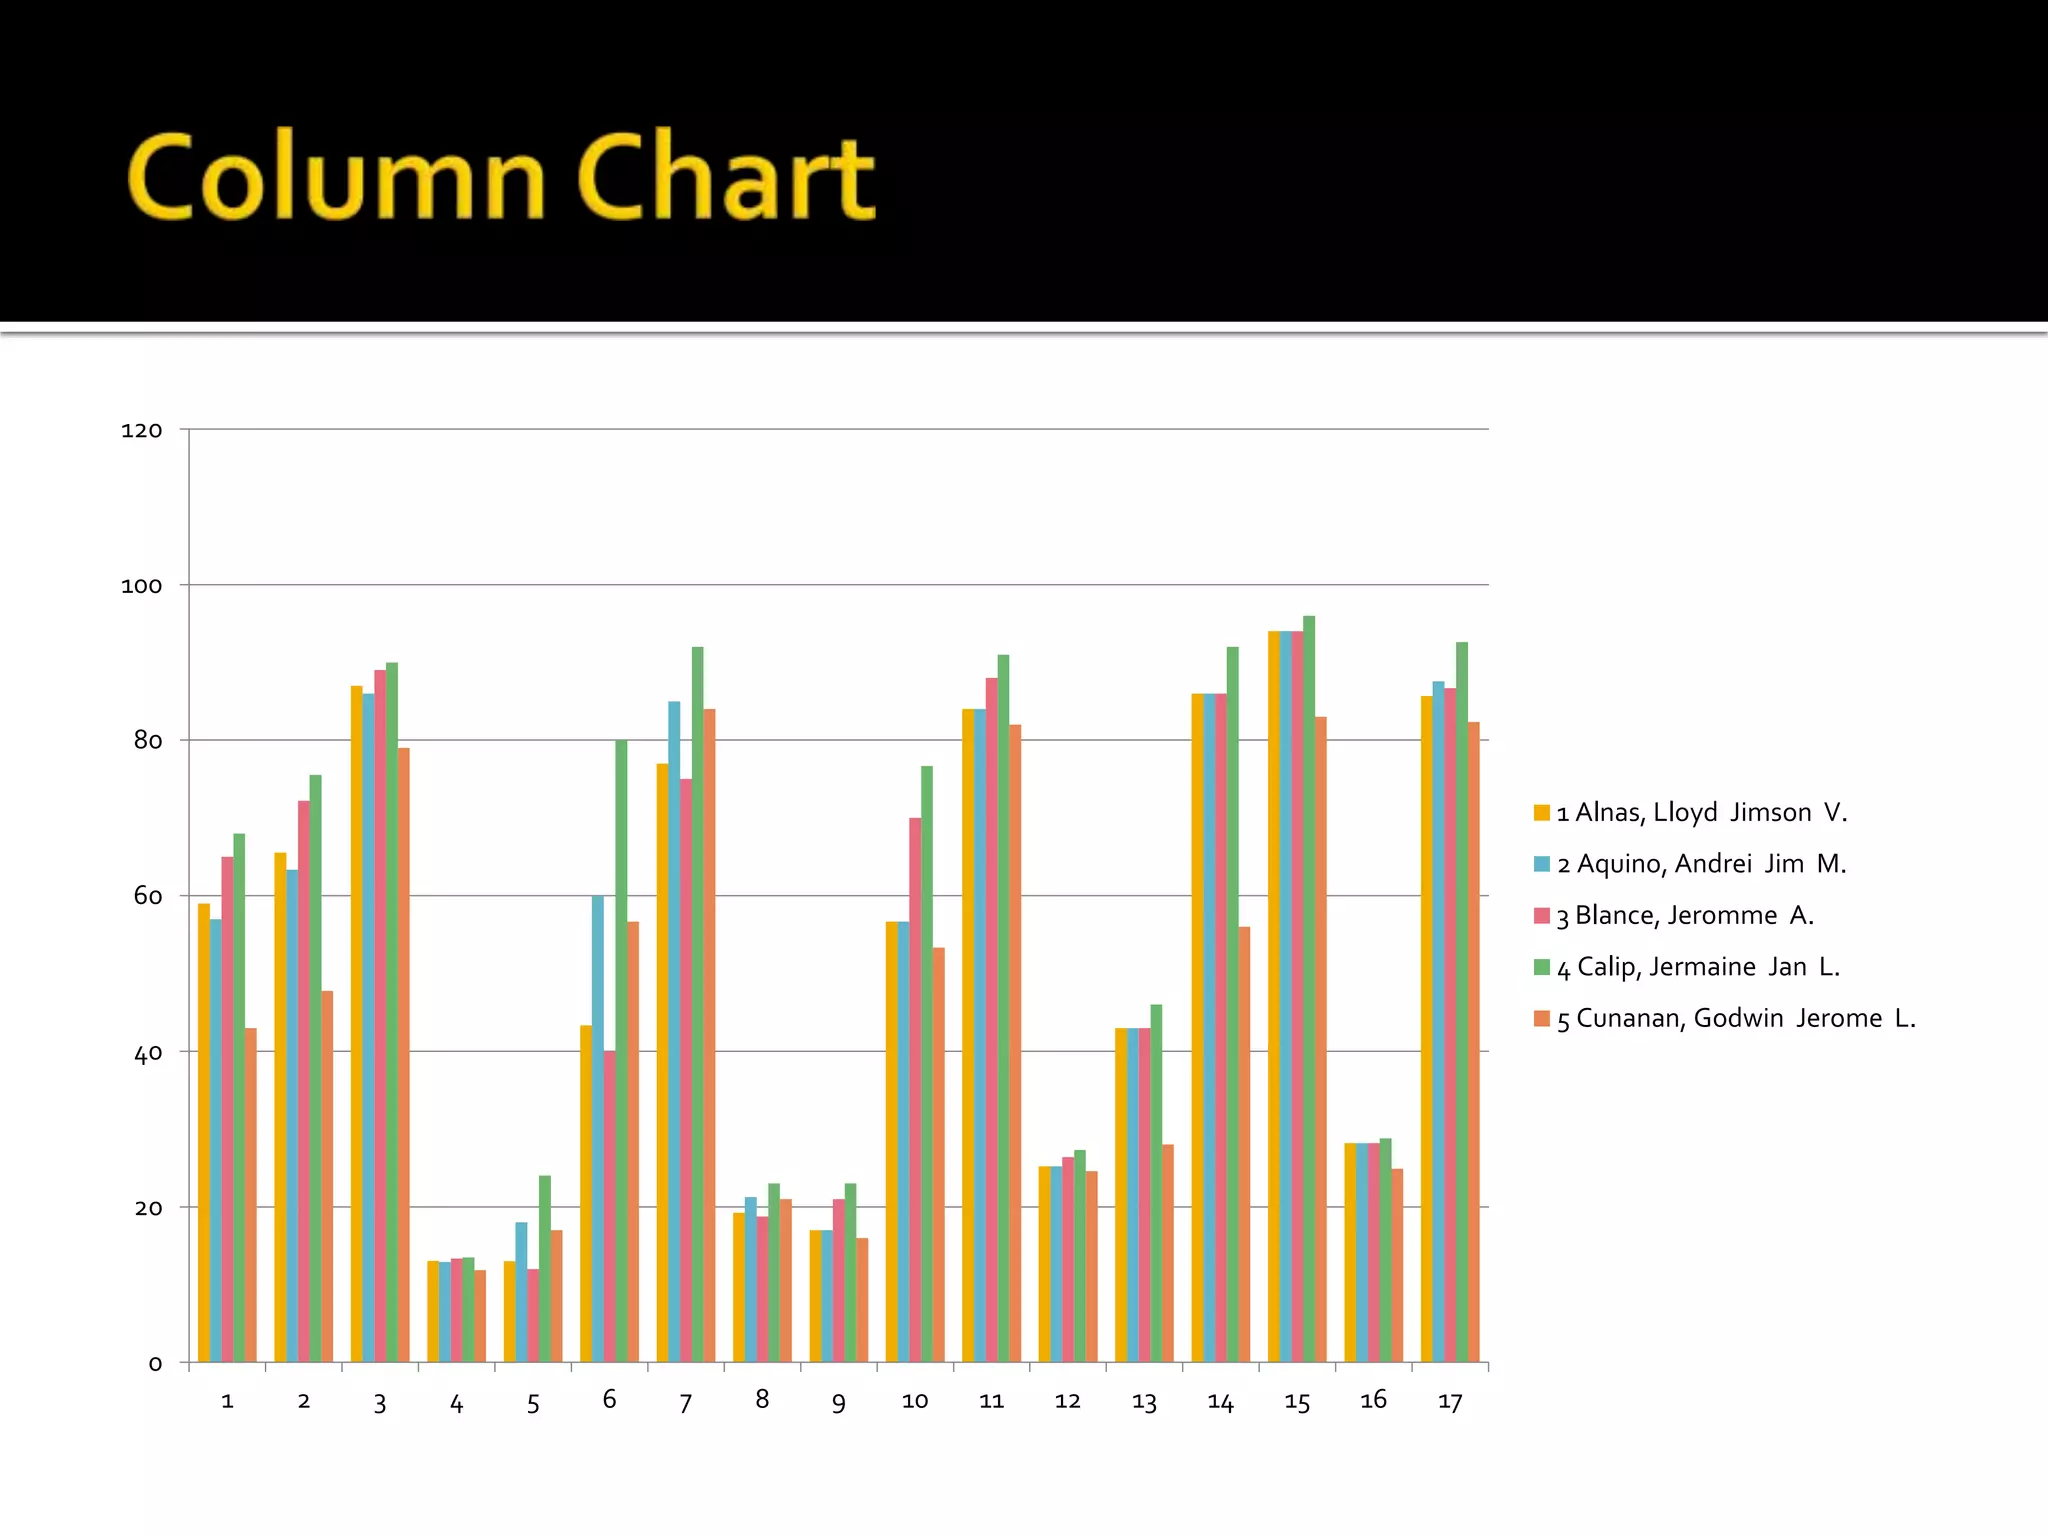
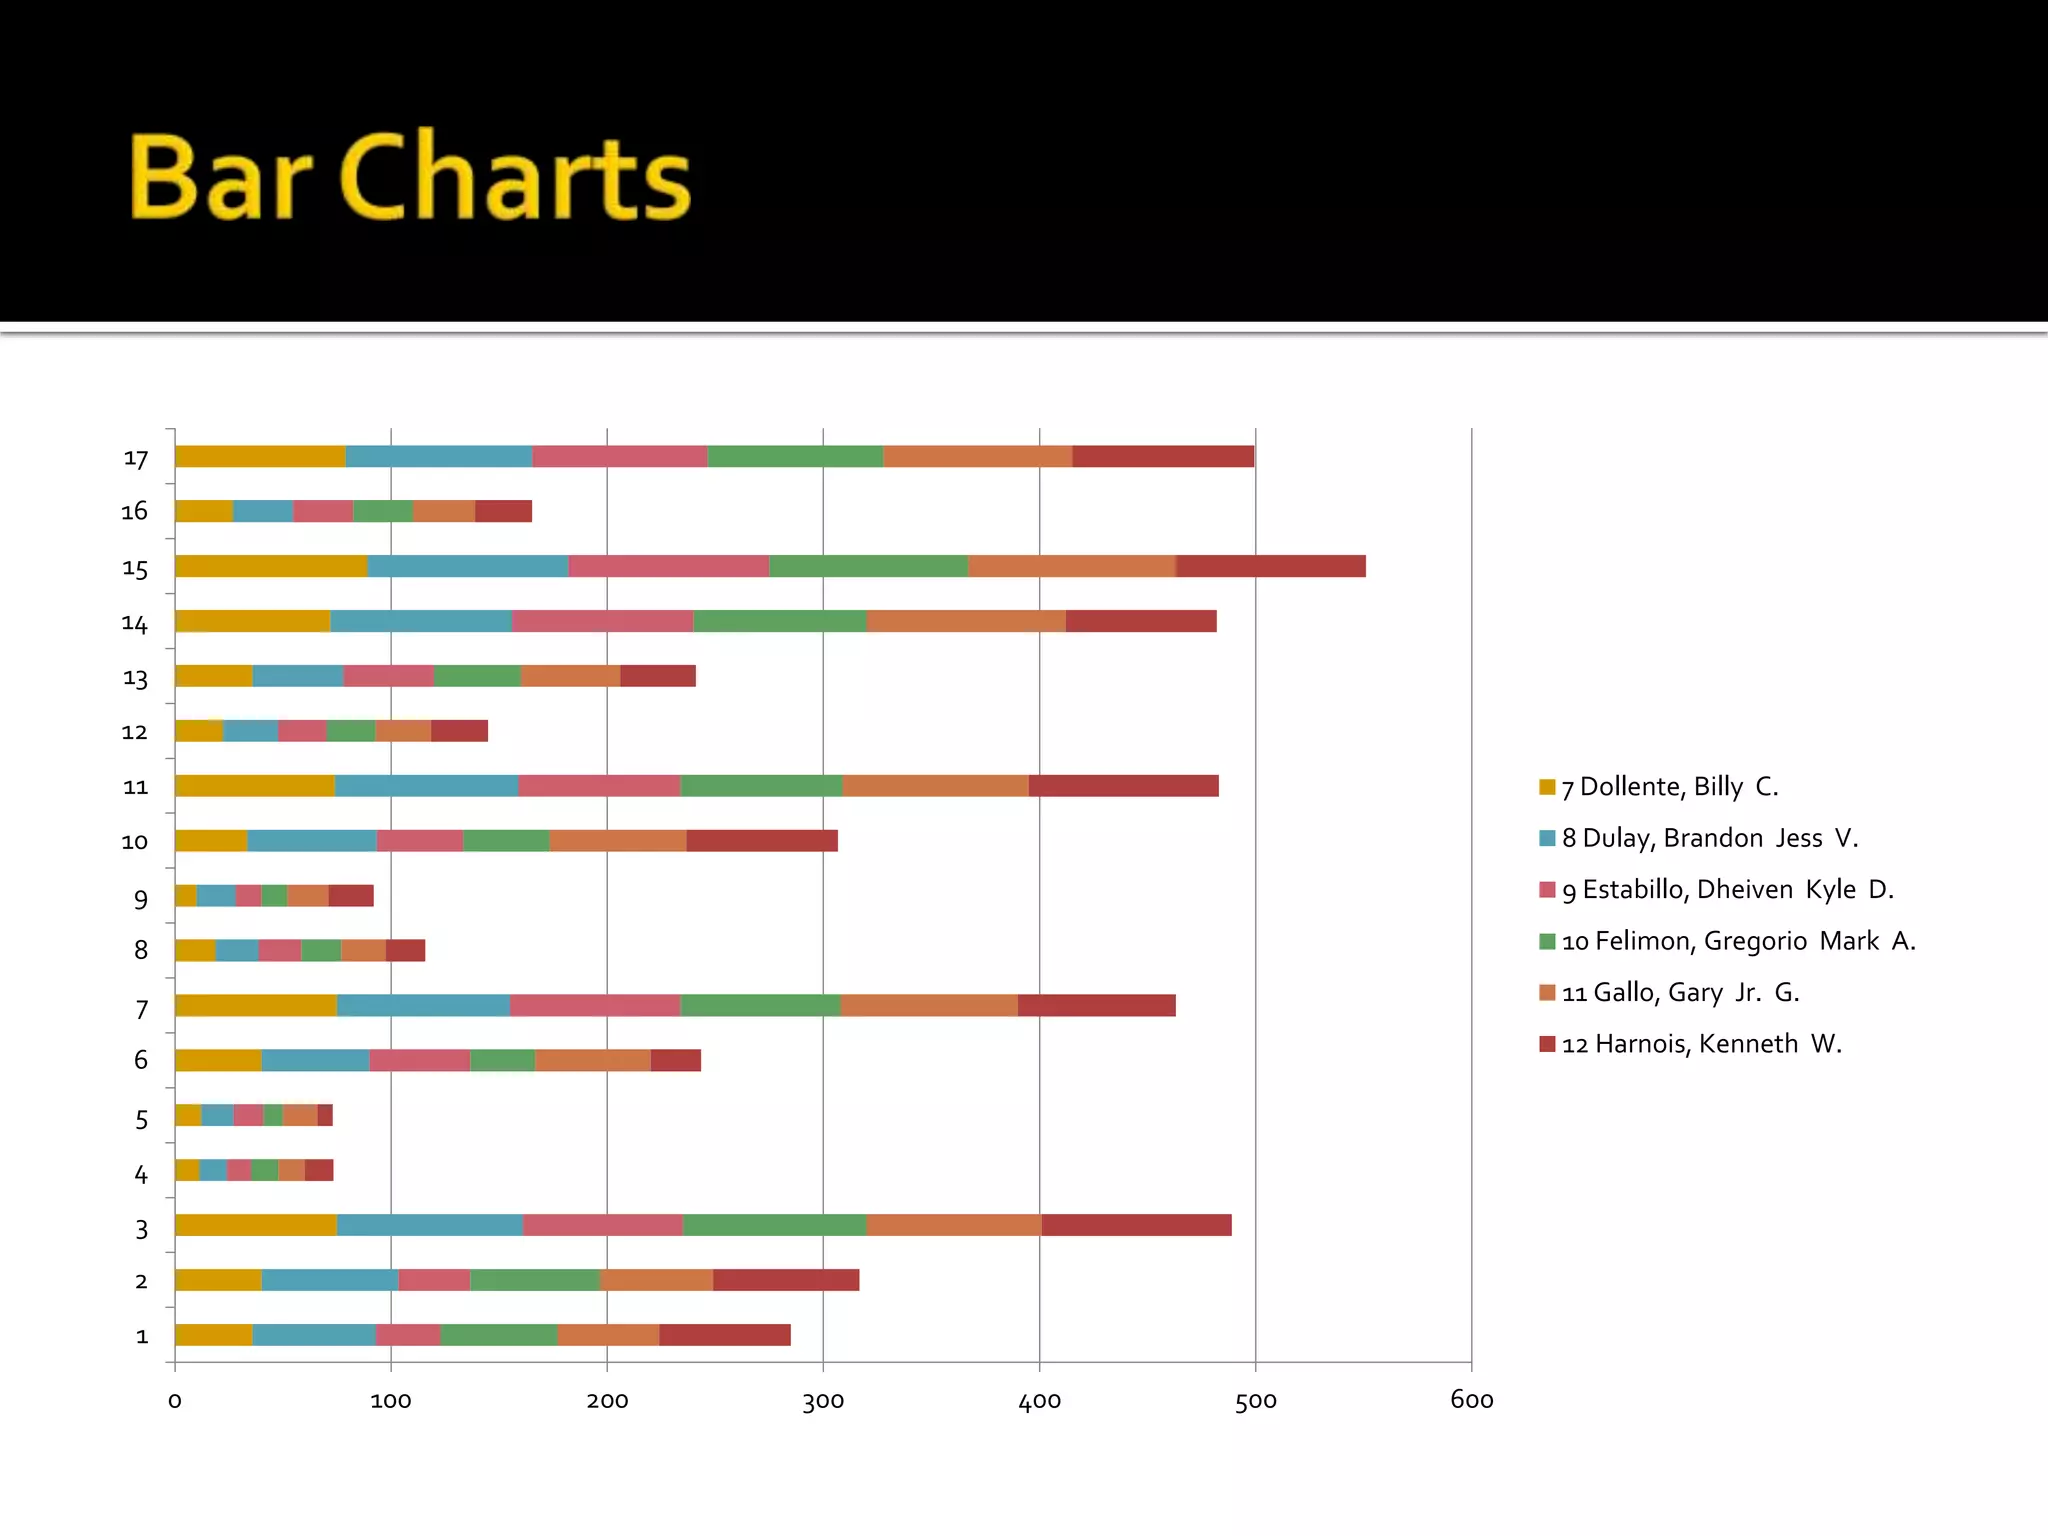
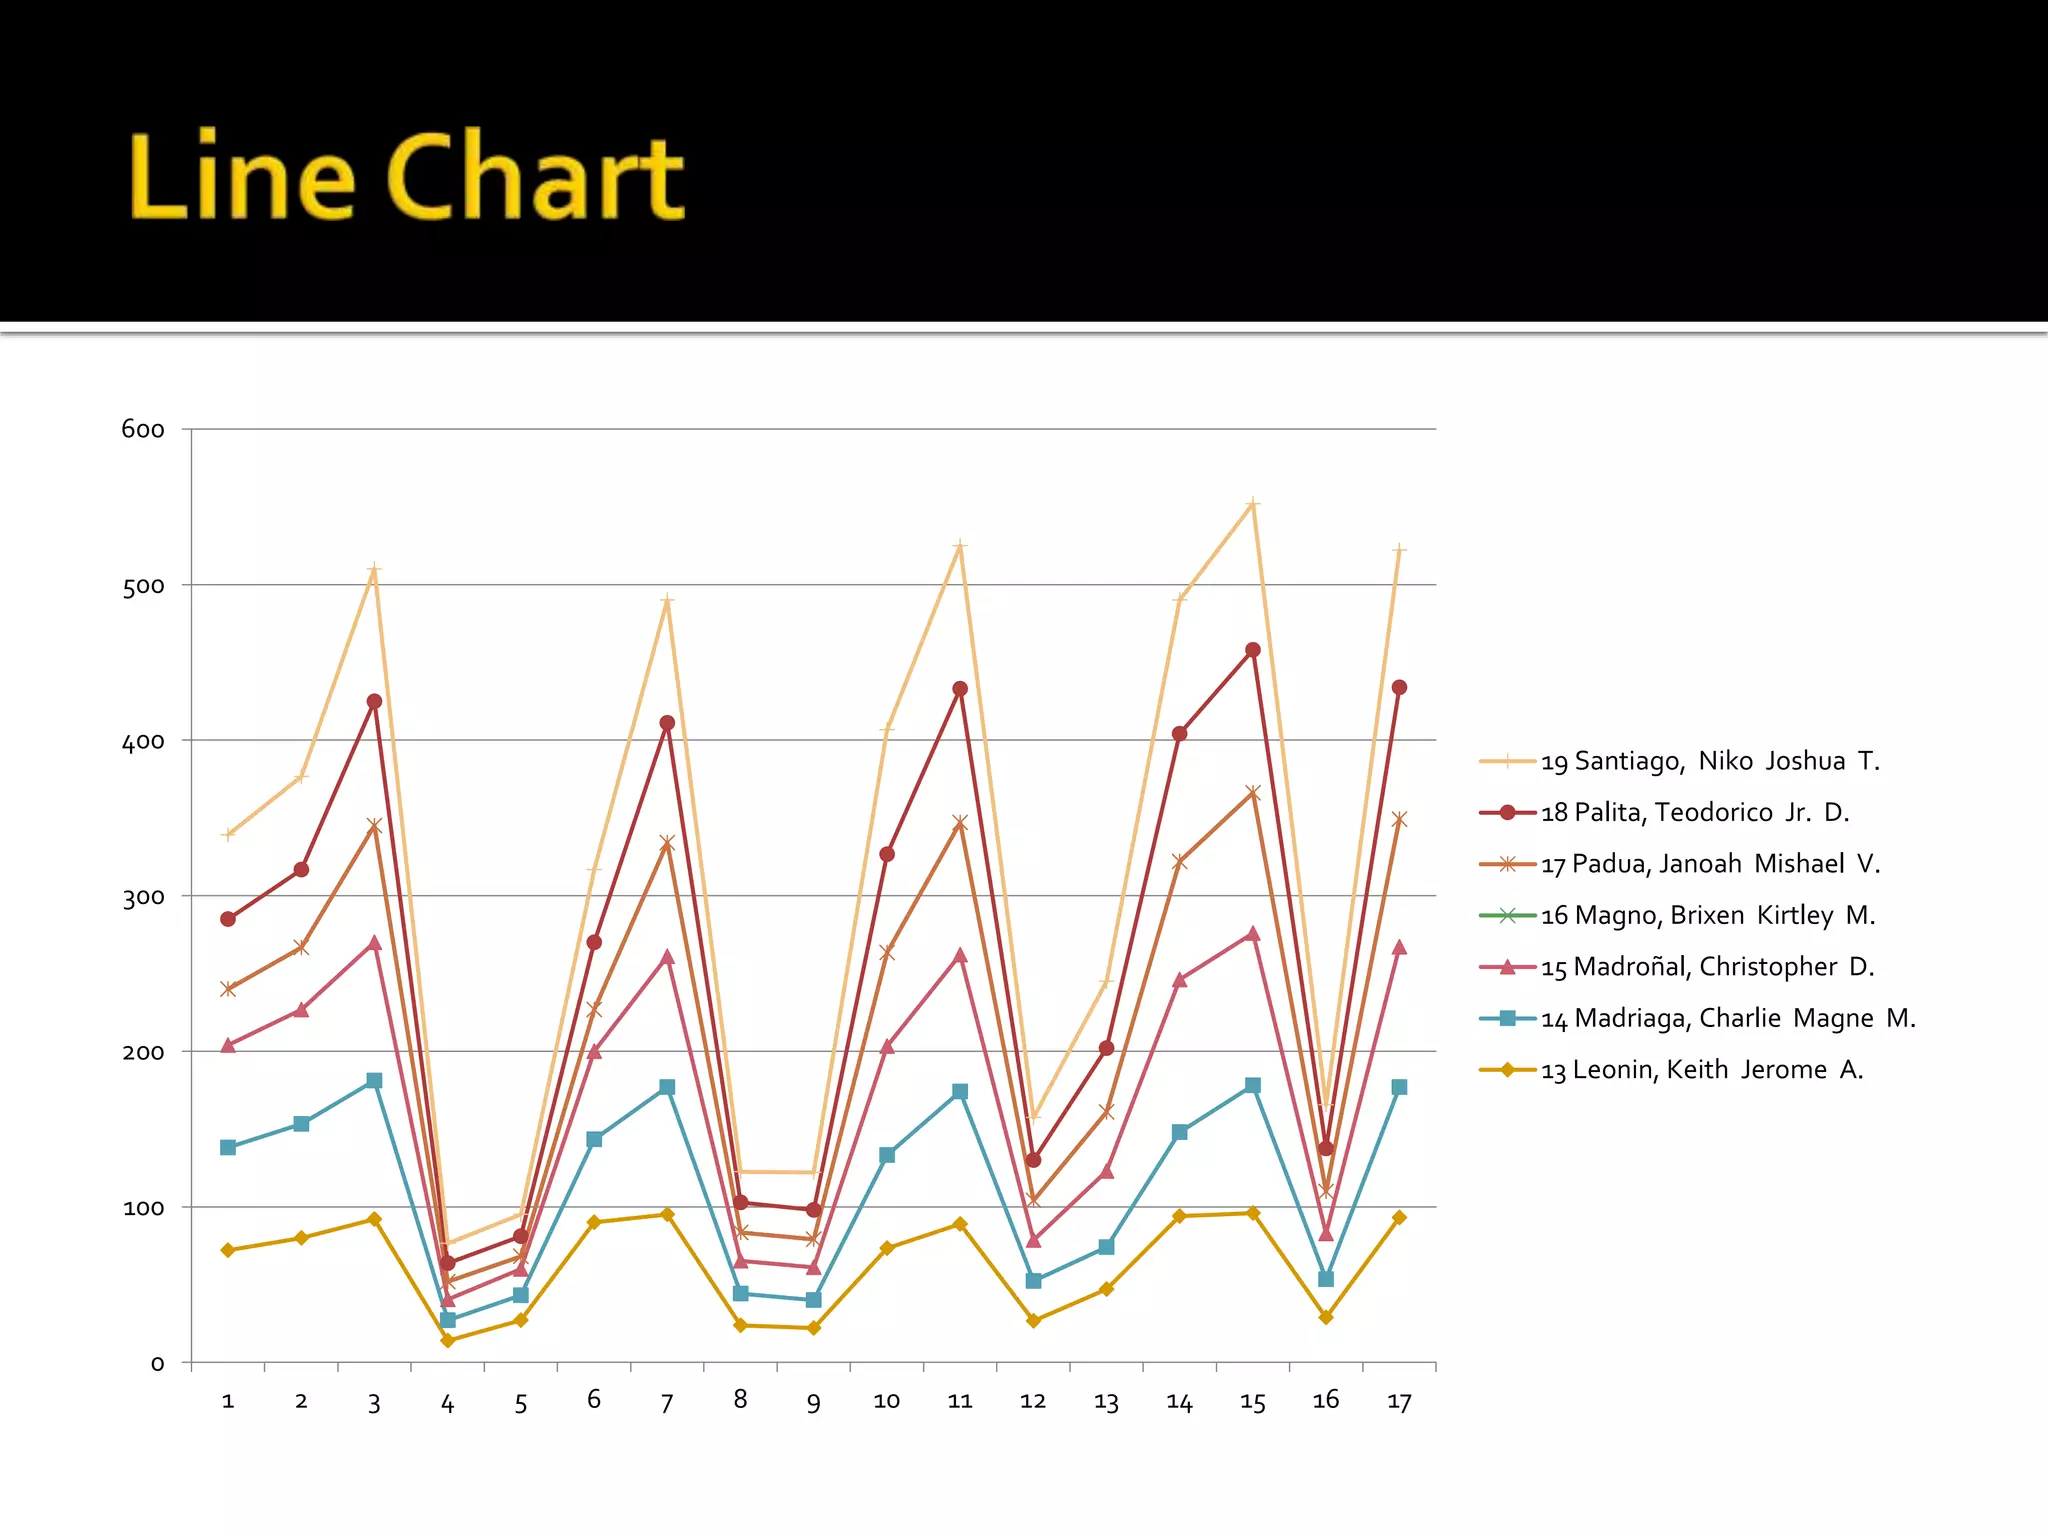
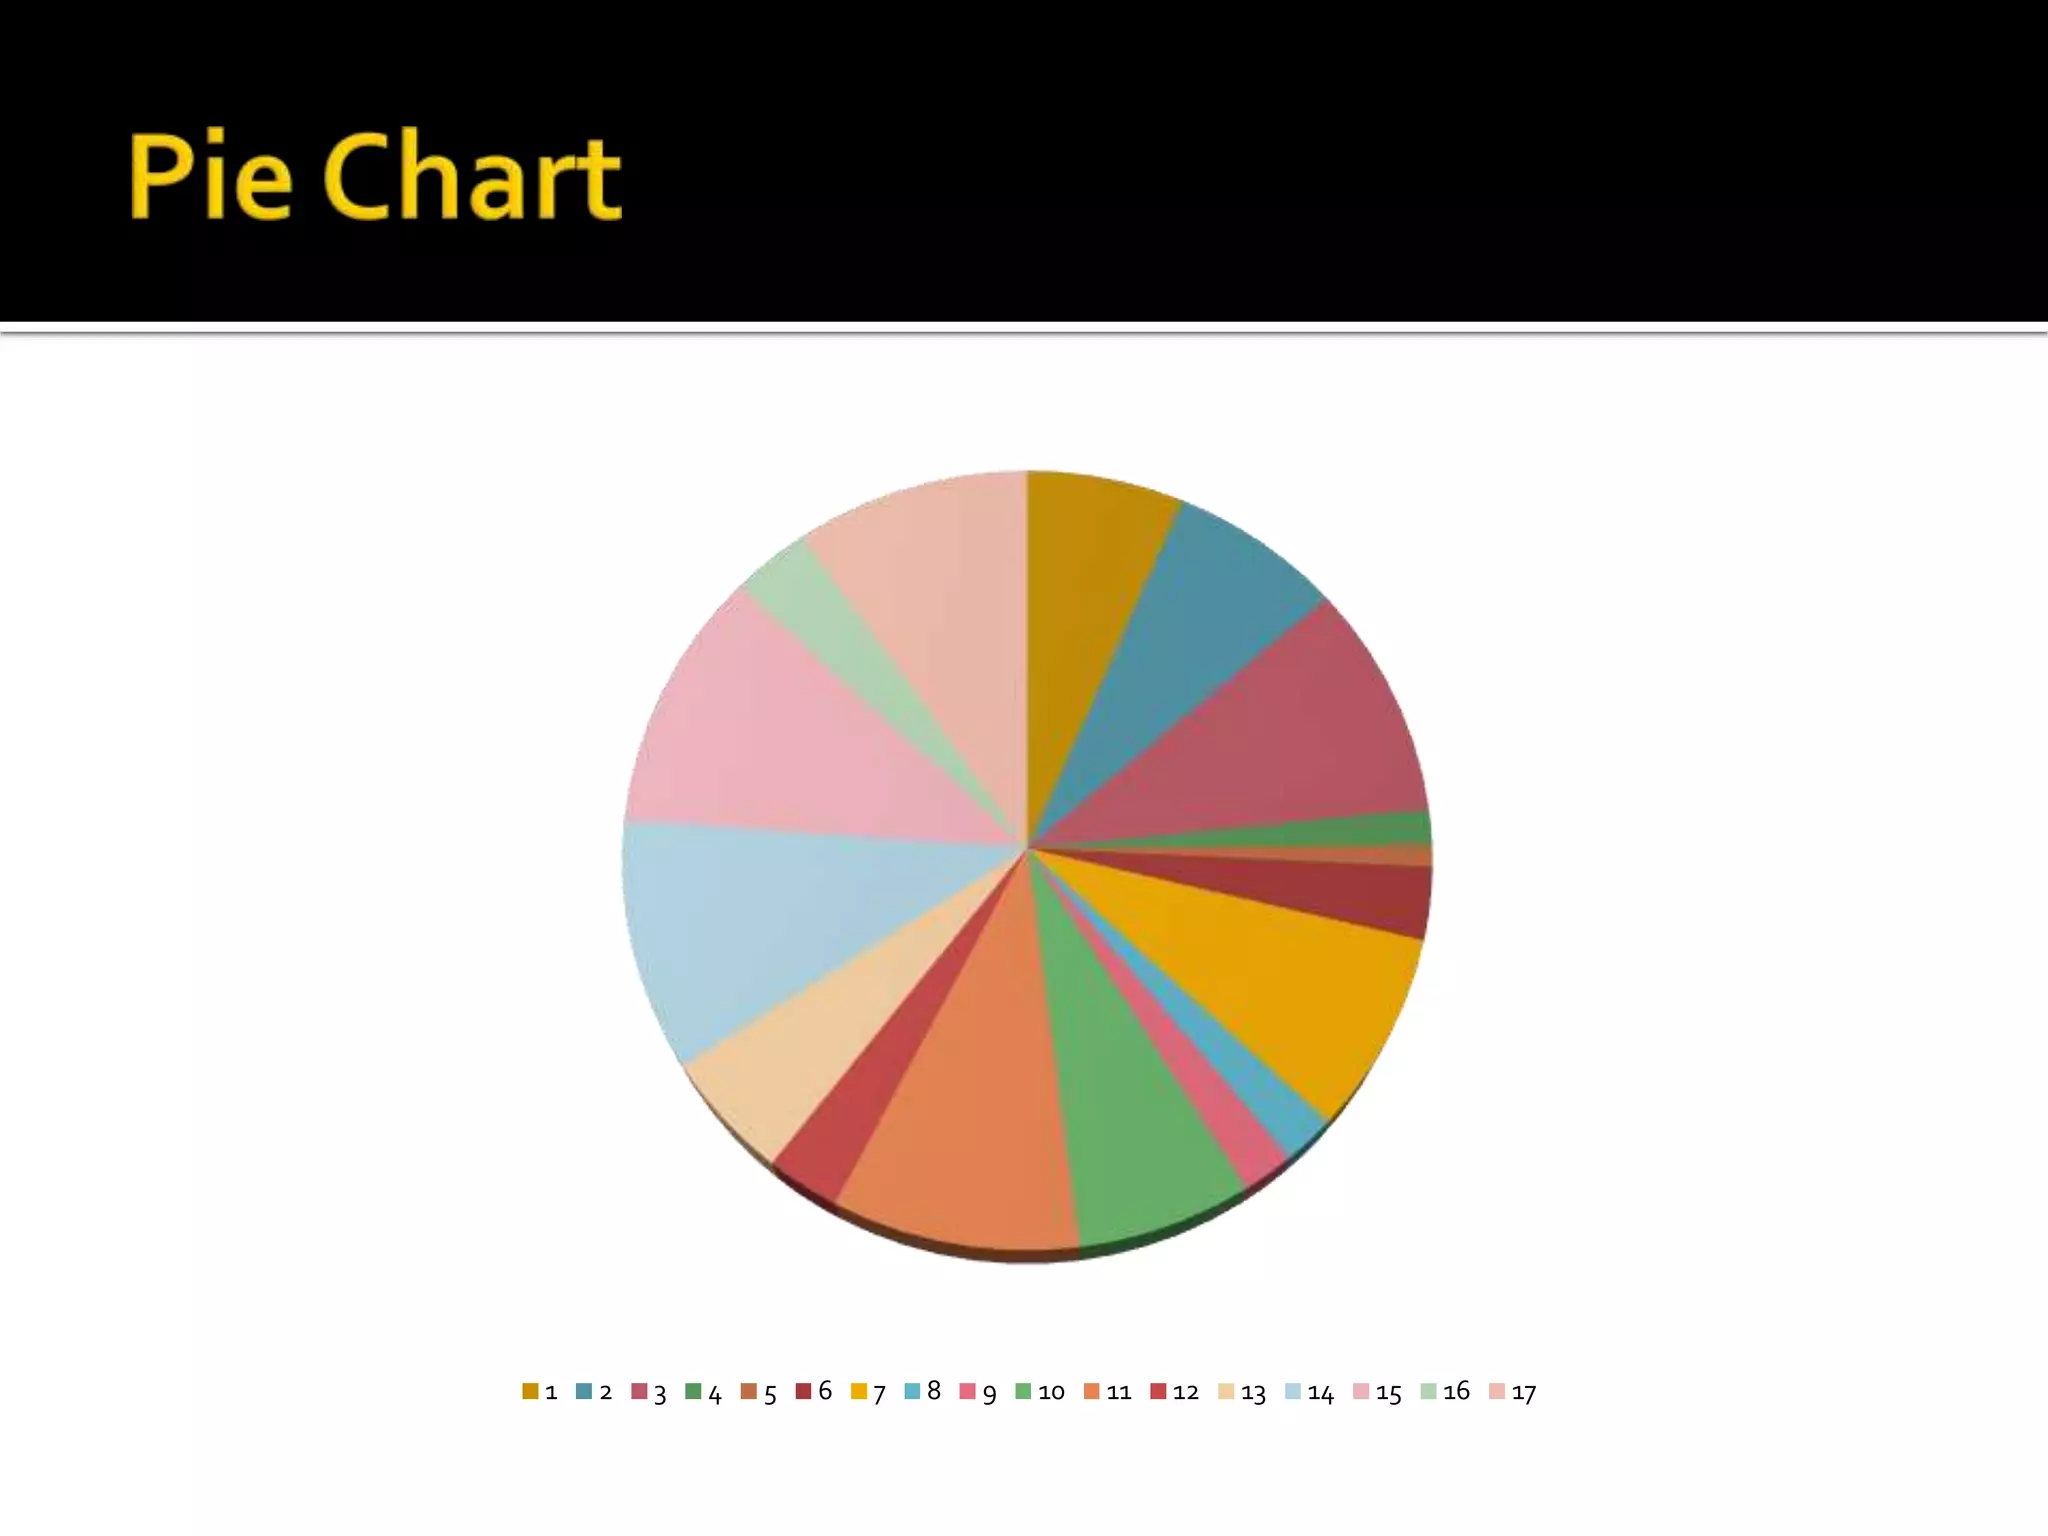
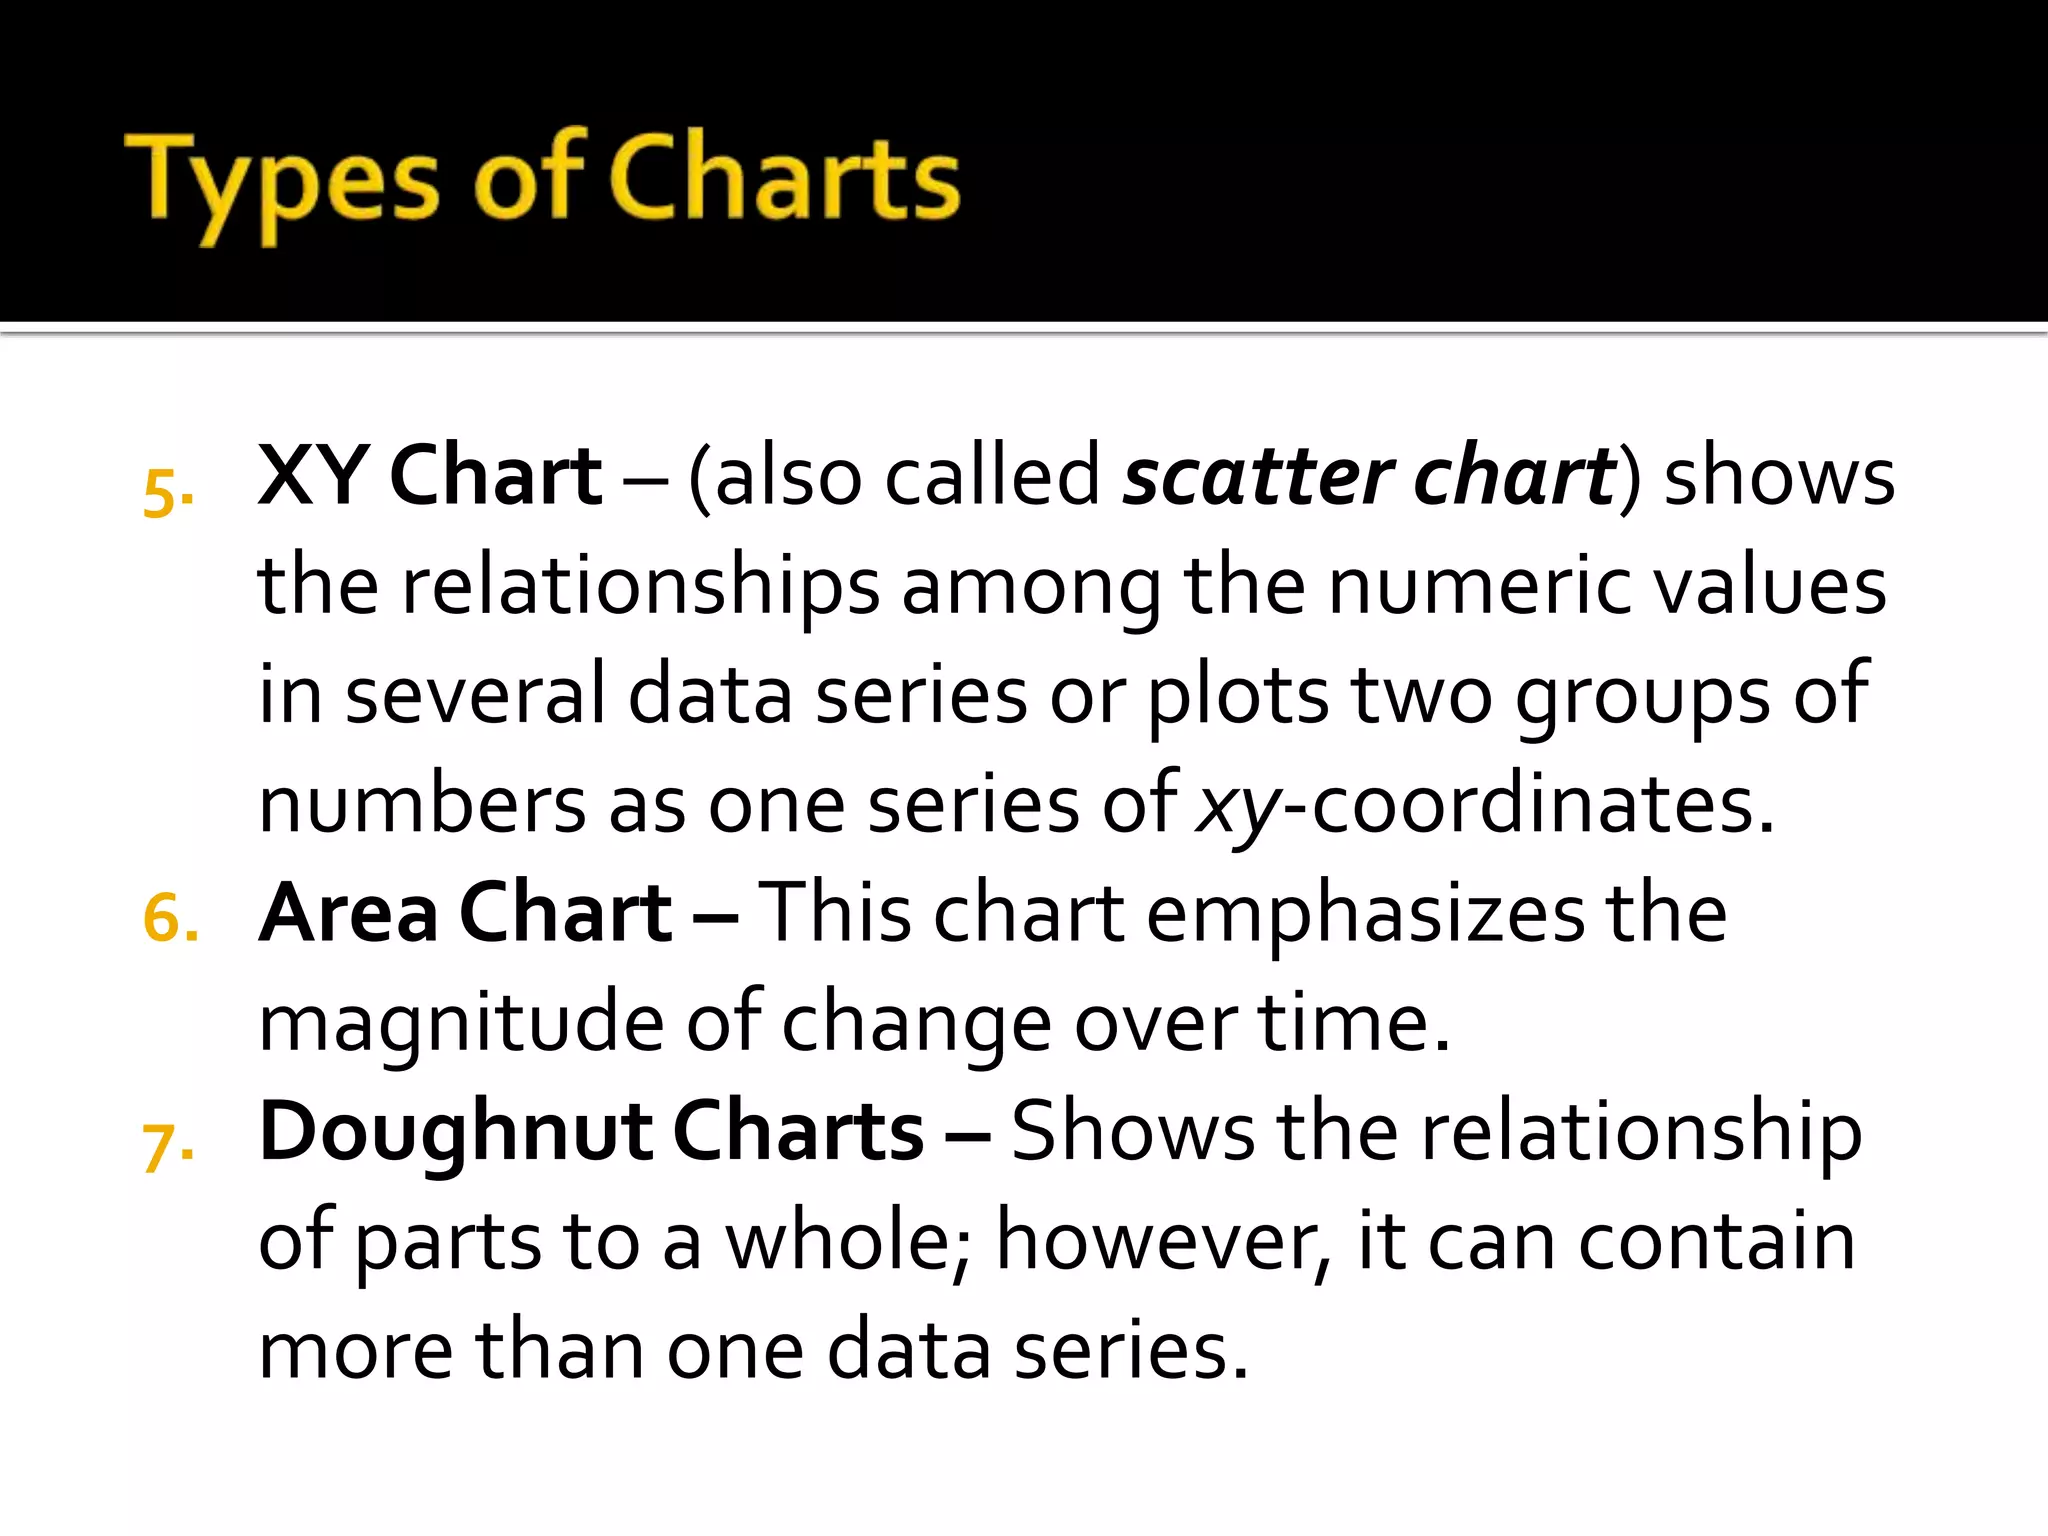
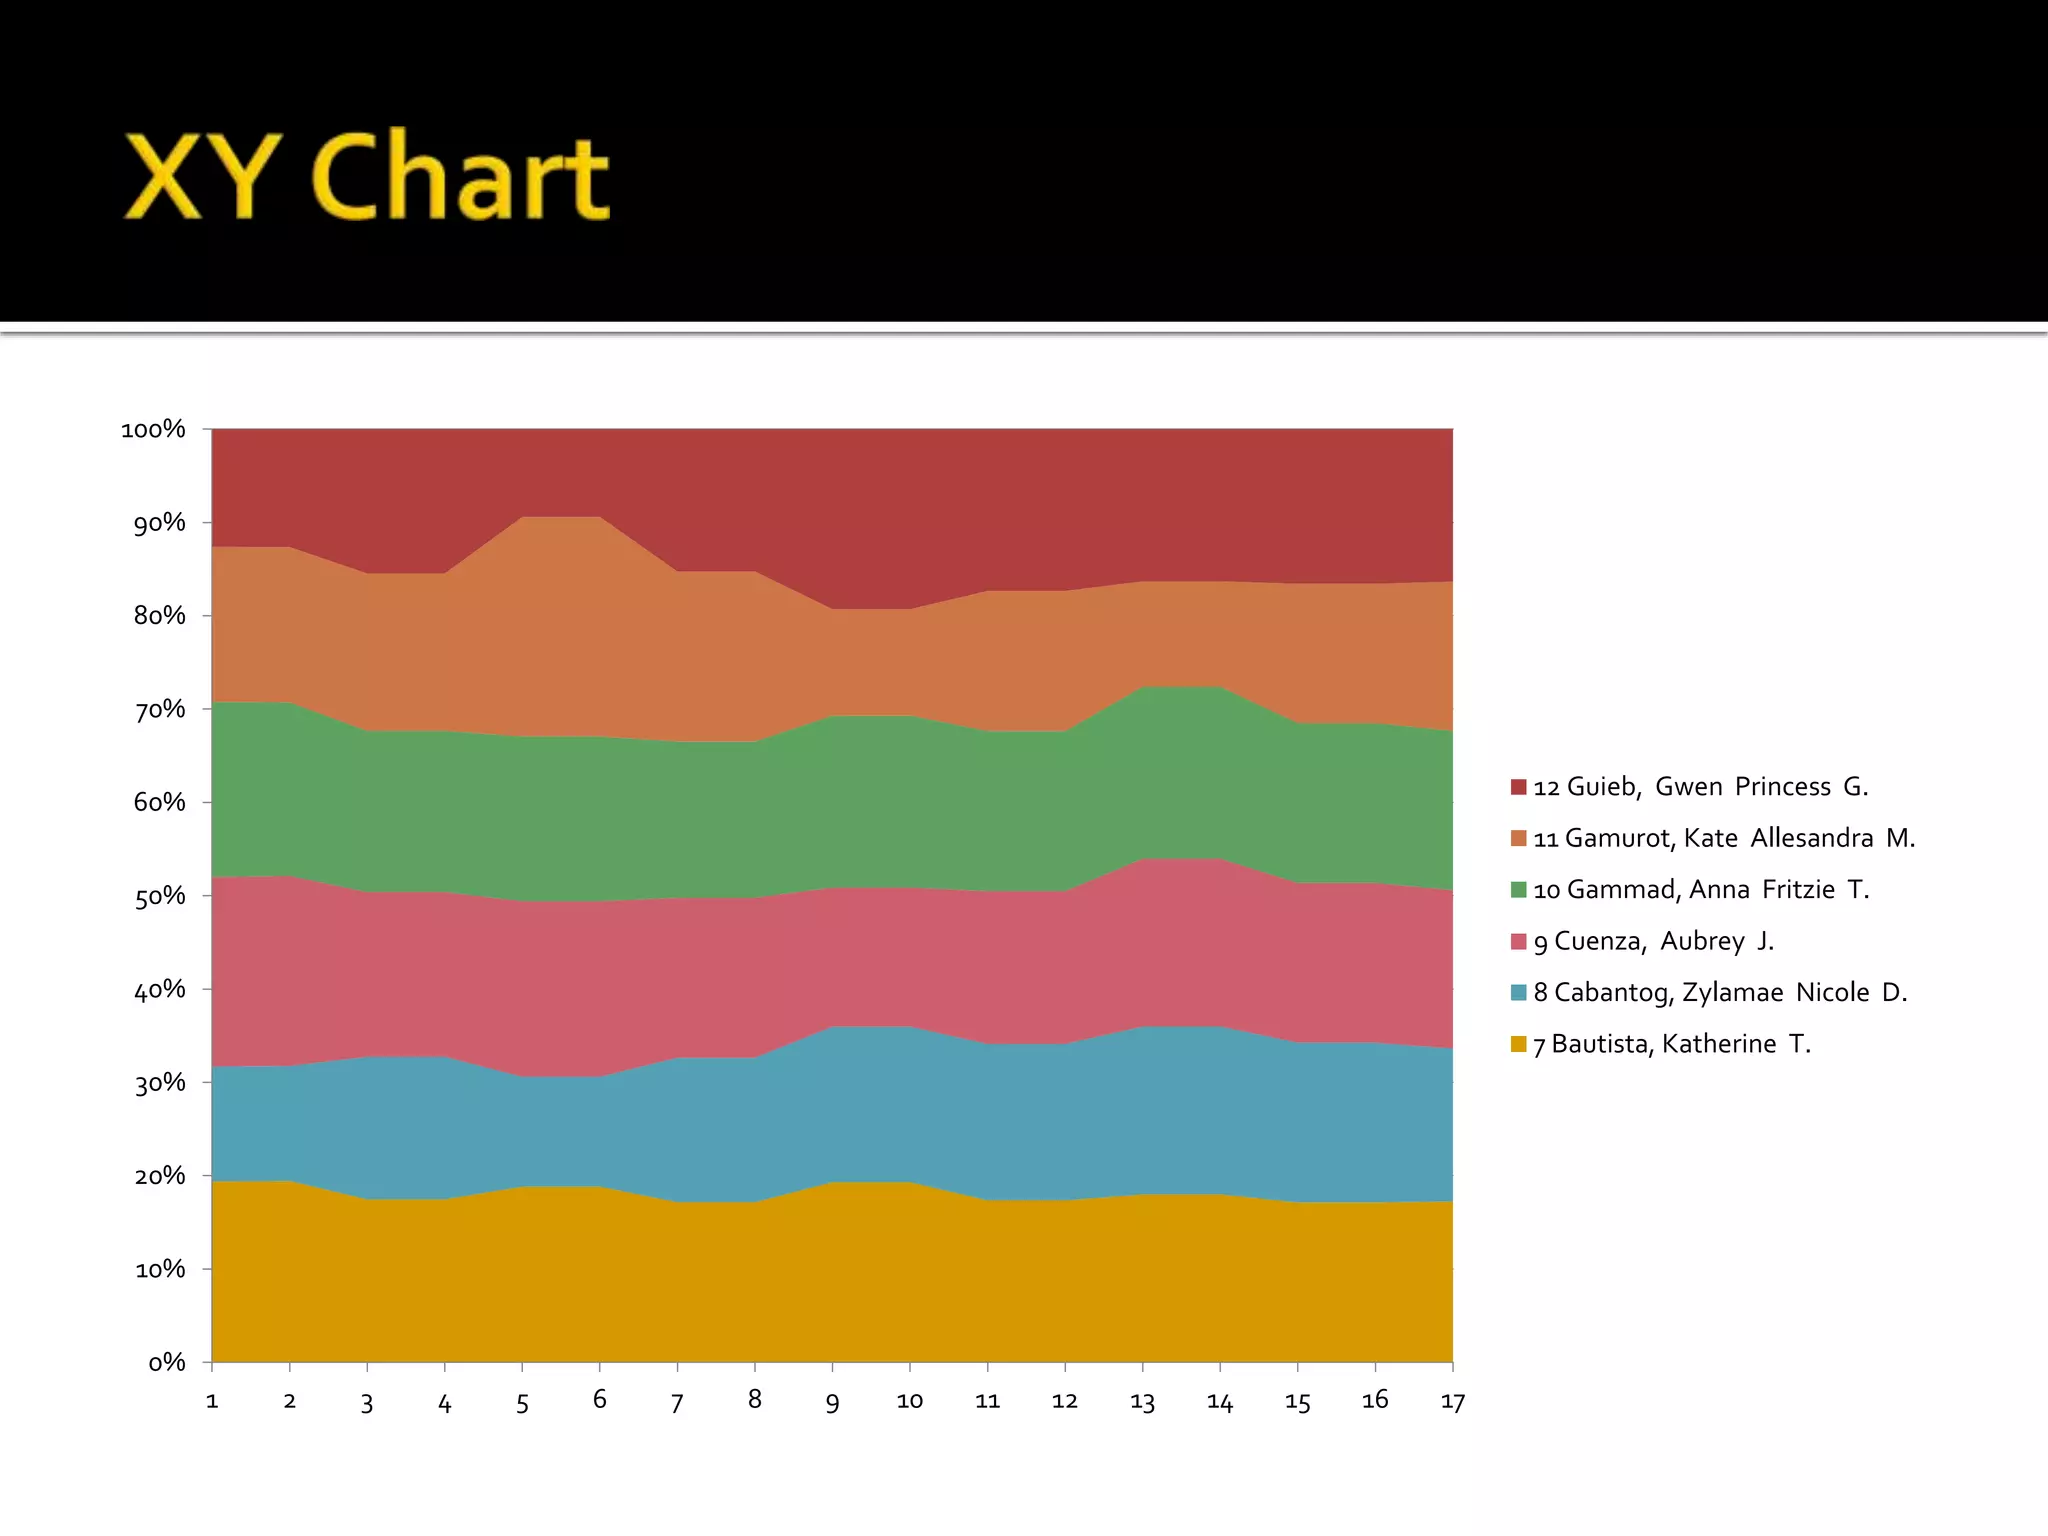
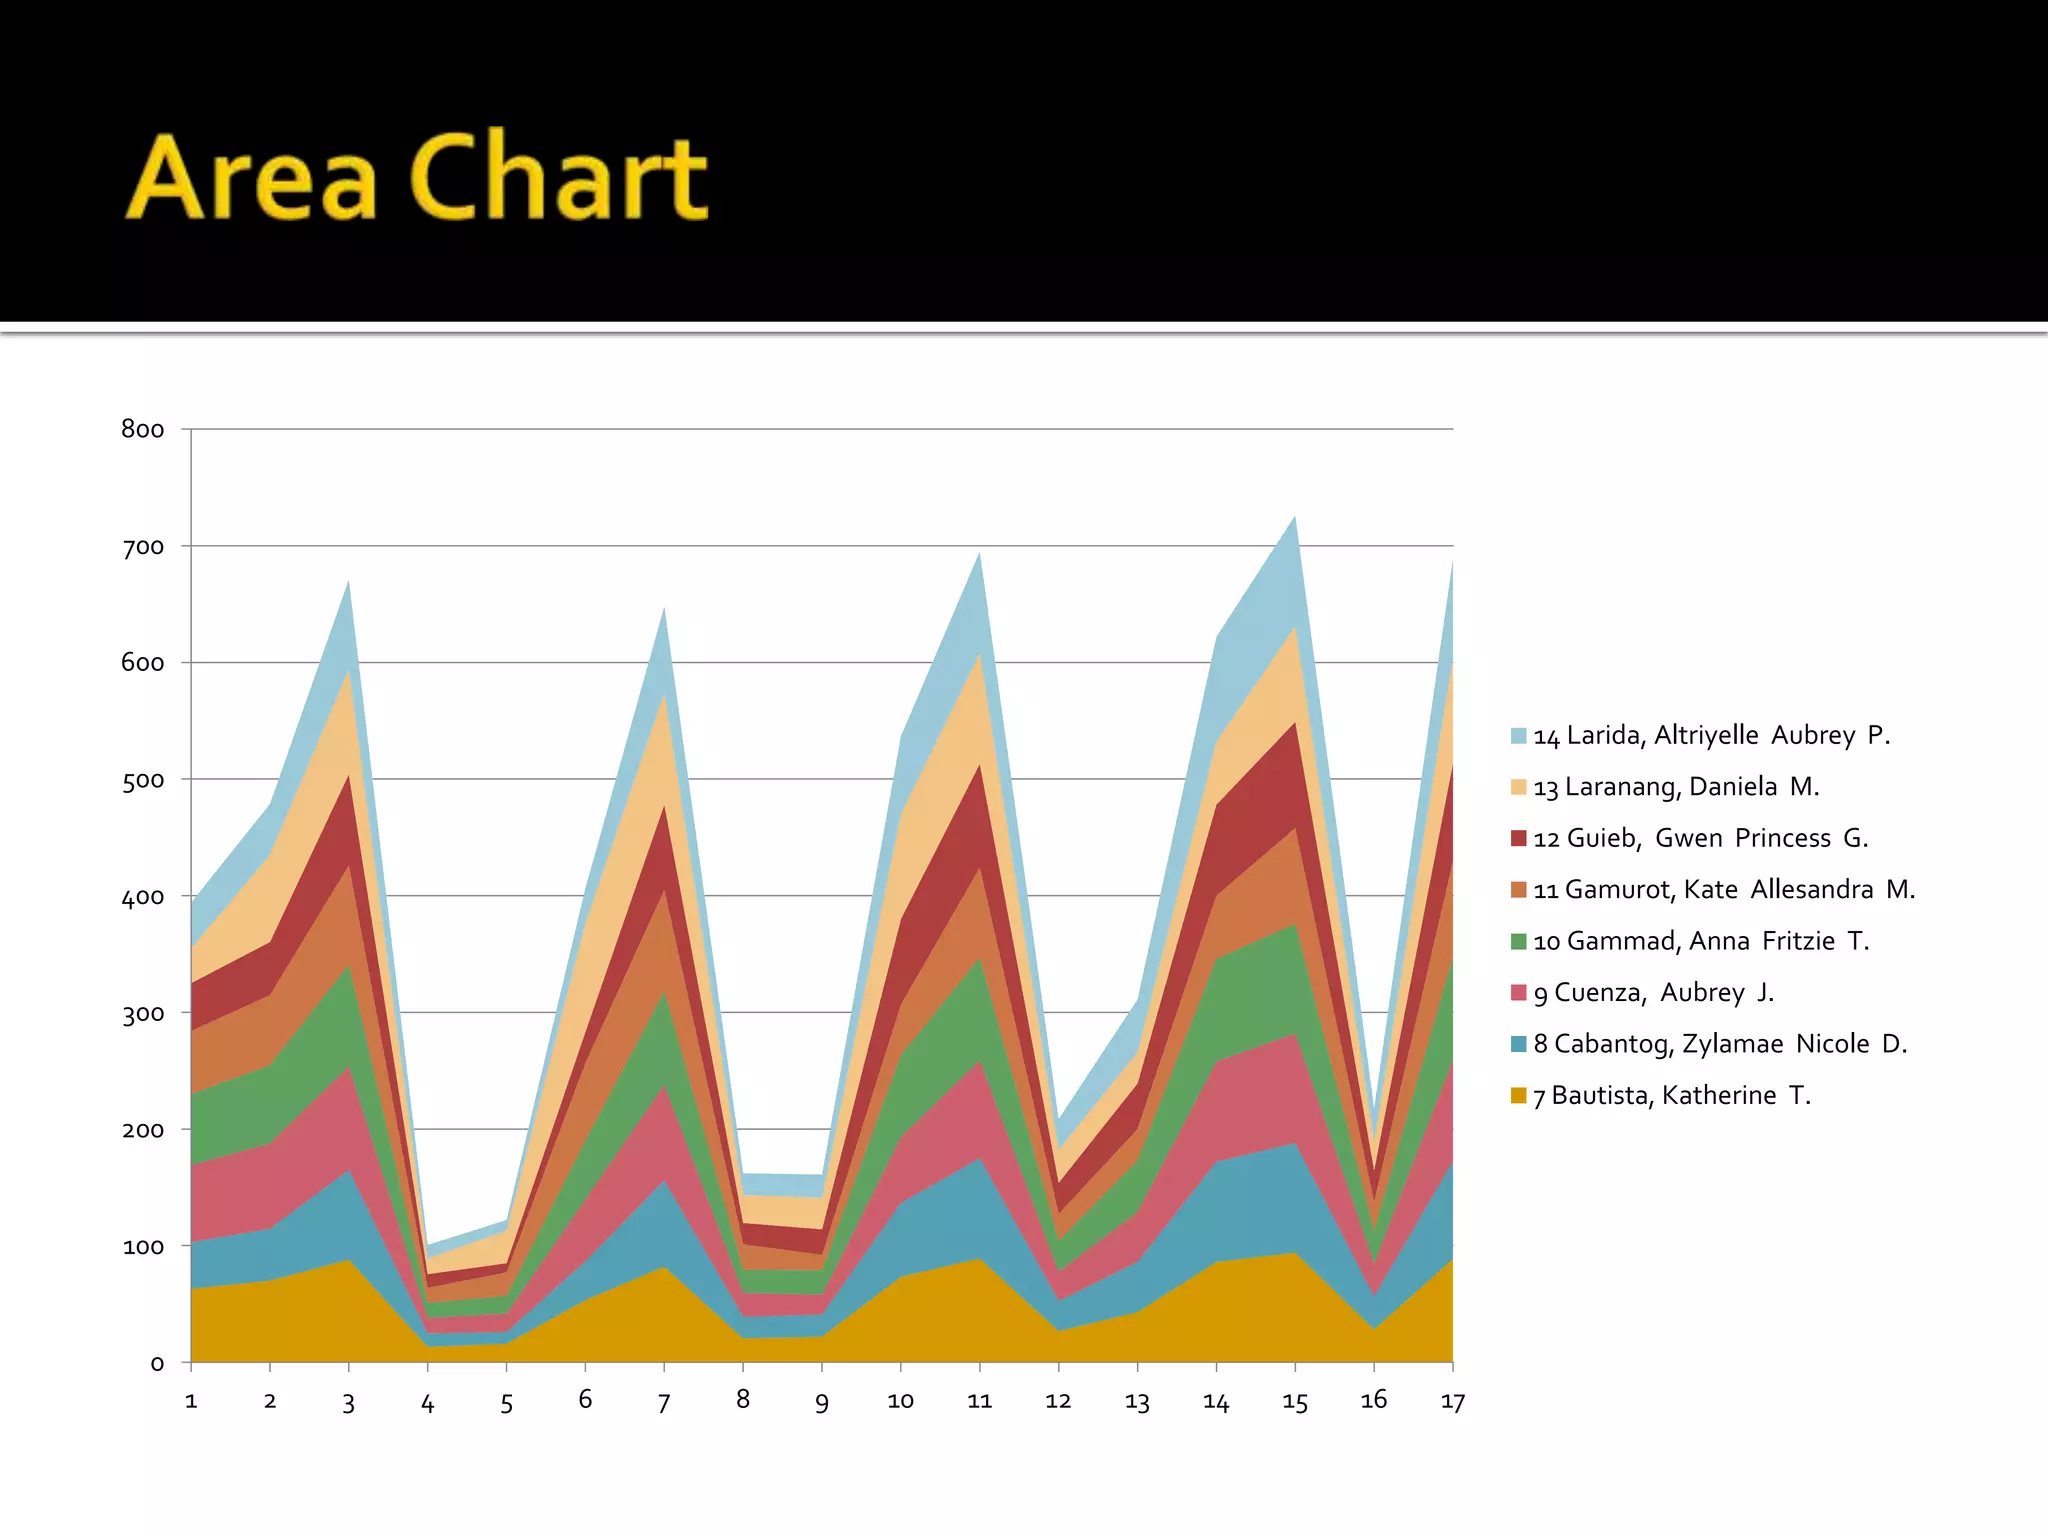
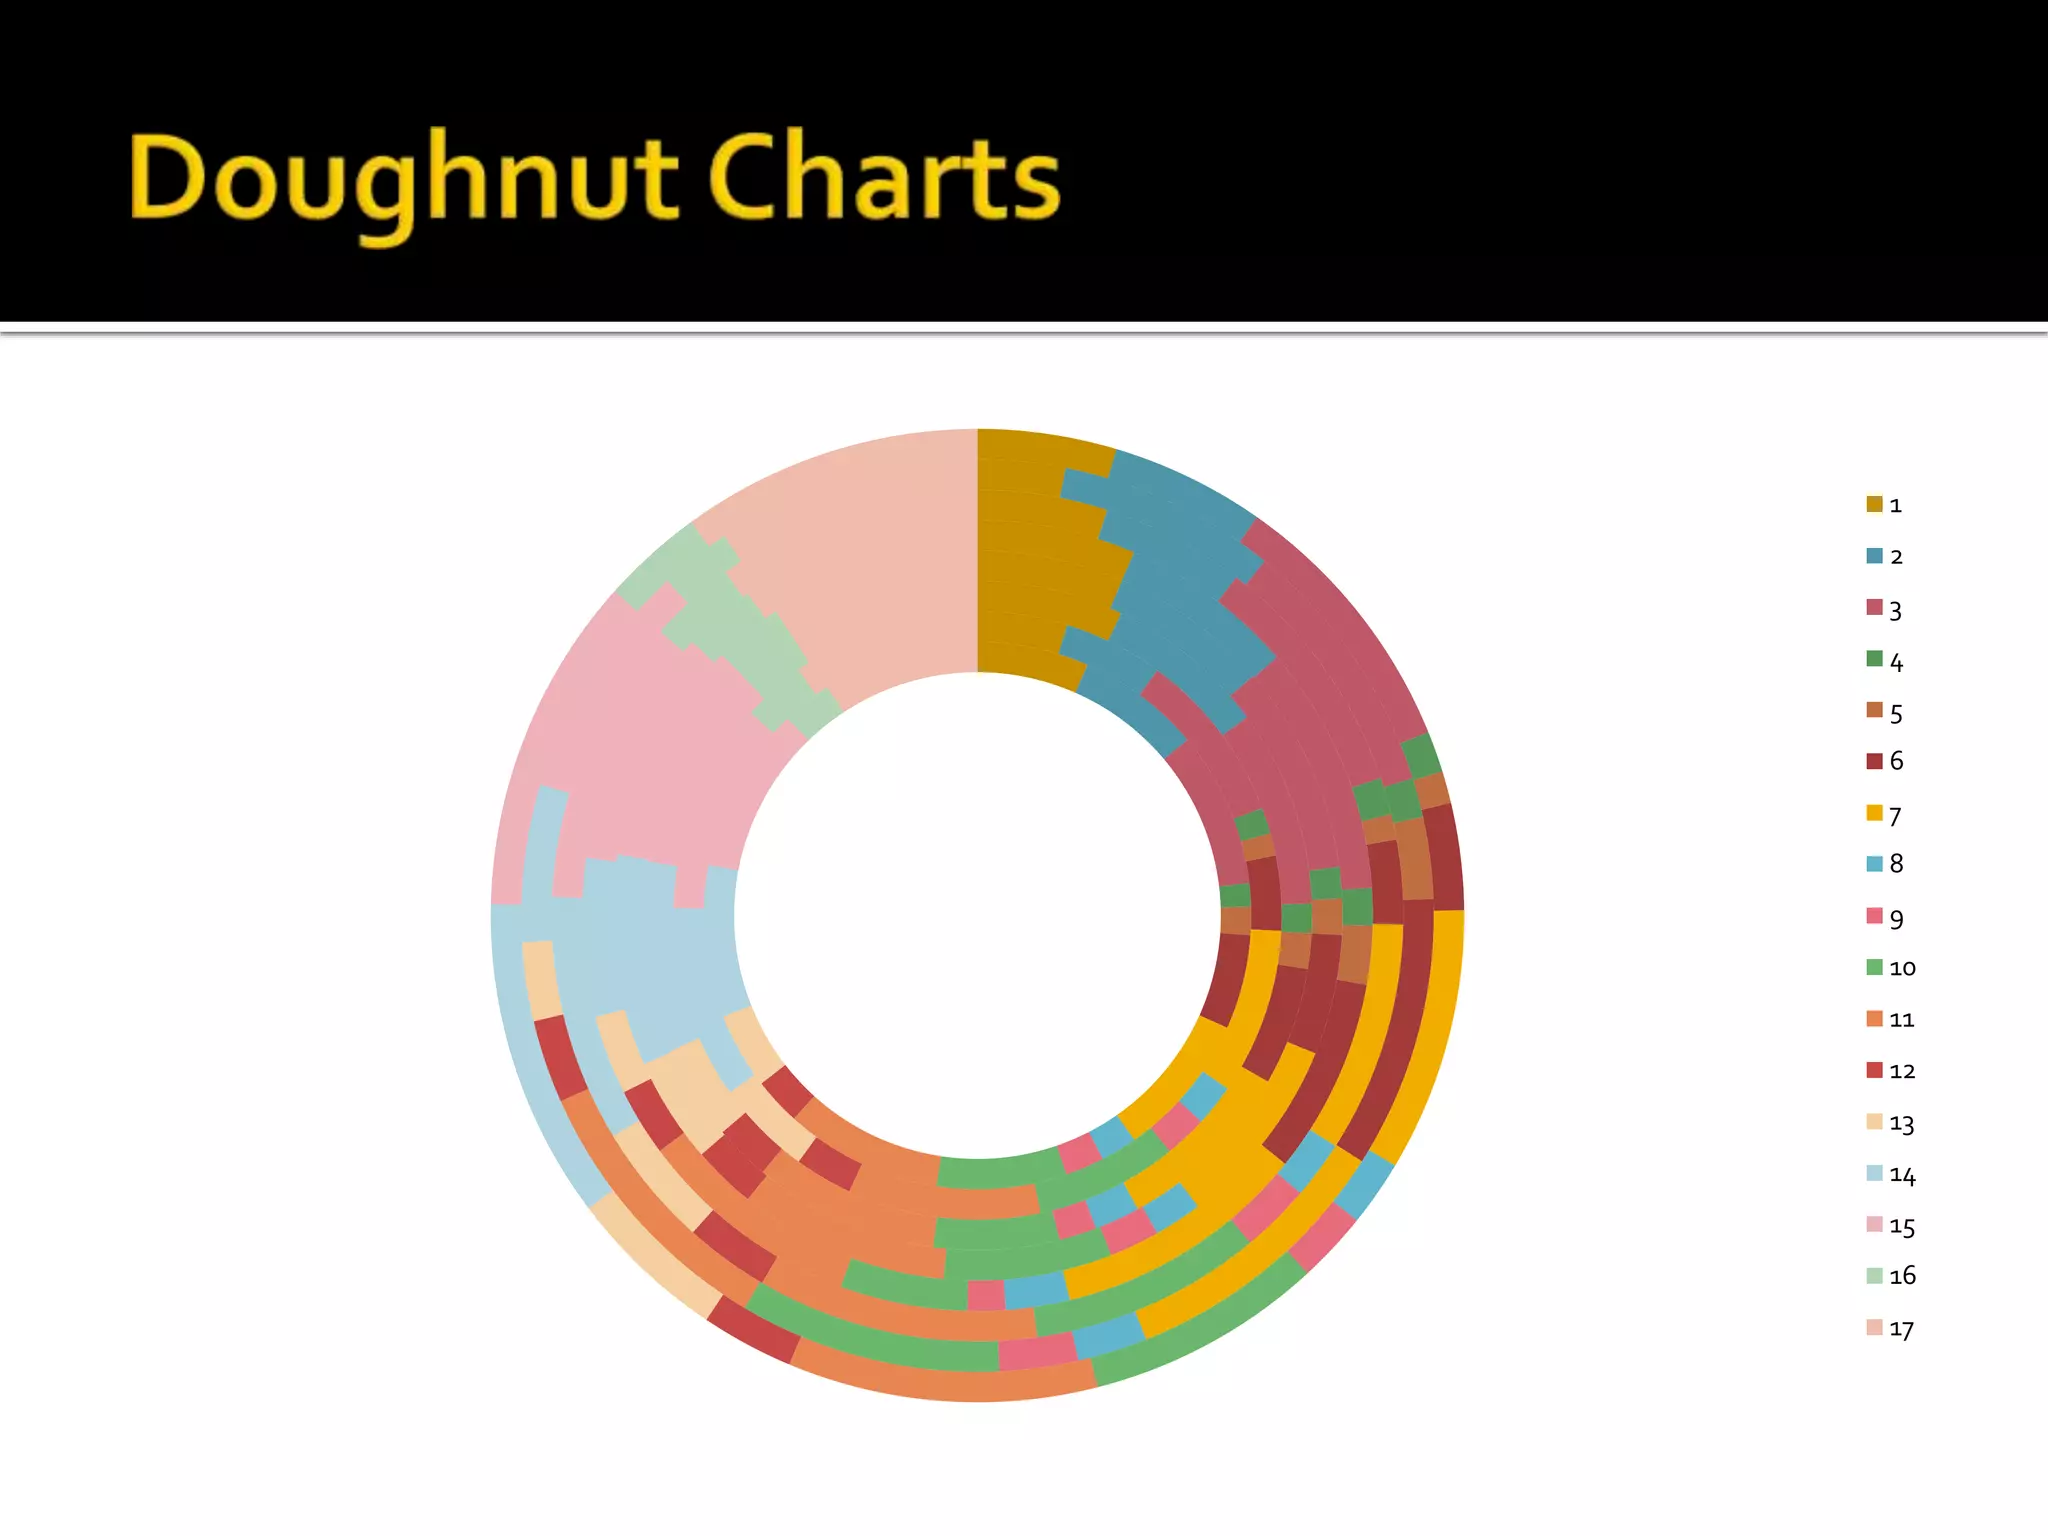
The document describes different types of charts that can be used to visualize data, including column charts, bar charts, line charts, pie charts, XY charts, area charts, doughnut charts, surface charts, bubble charts, stock charts, and cylinder, cone or pyramid charts. It provides examples of subtypes for some chart types and explains what each chart shows or compares.


![Coded Agents – with UiPath SDK + LangGraph [Virtual Hands-on Workshop]](https://cdn.slidesharecdn.com/ss_thumbnails/codedagentsdeck-251215155422-5497c599-thumbnail.jpg?width=640&height=640&fit=bounds)


