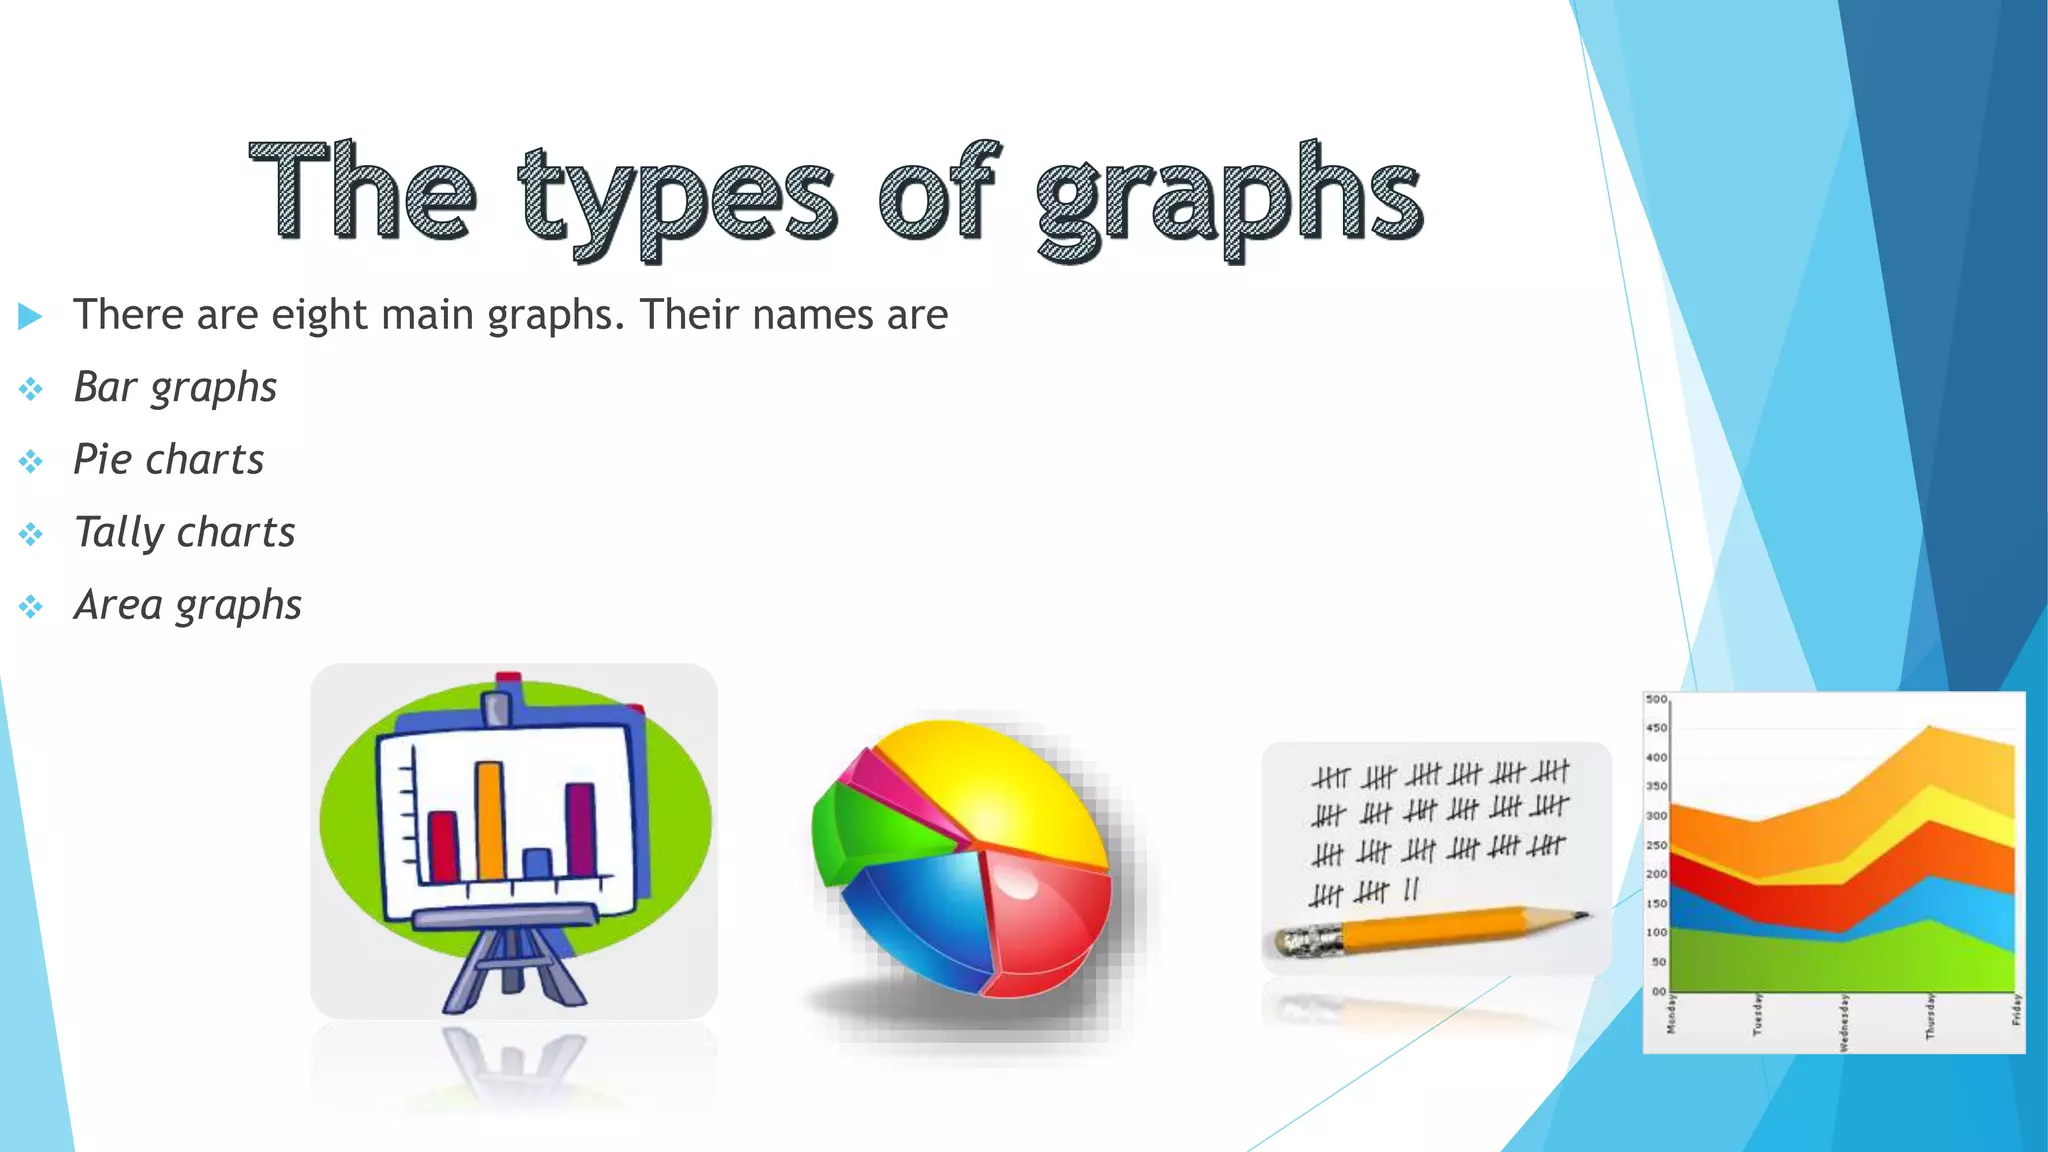
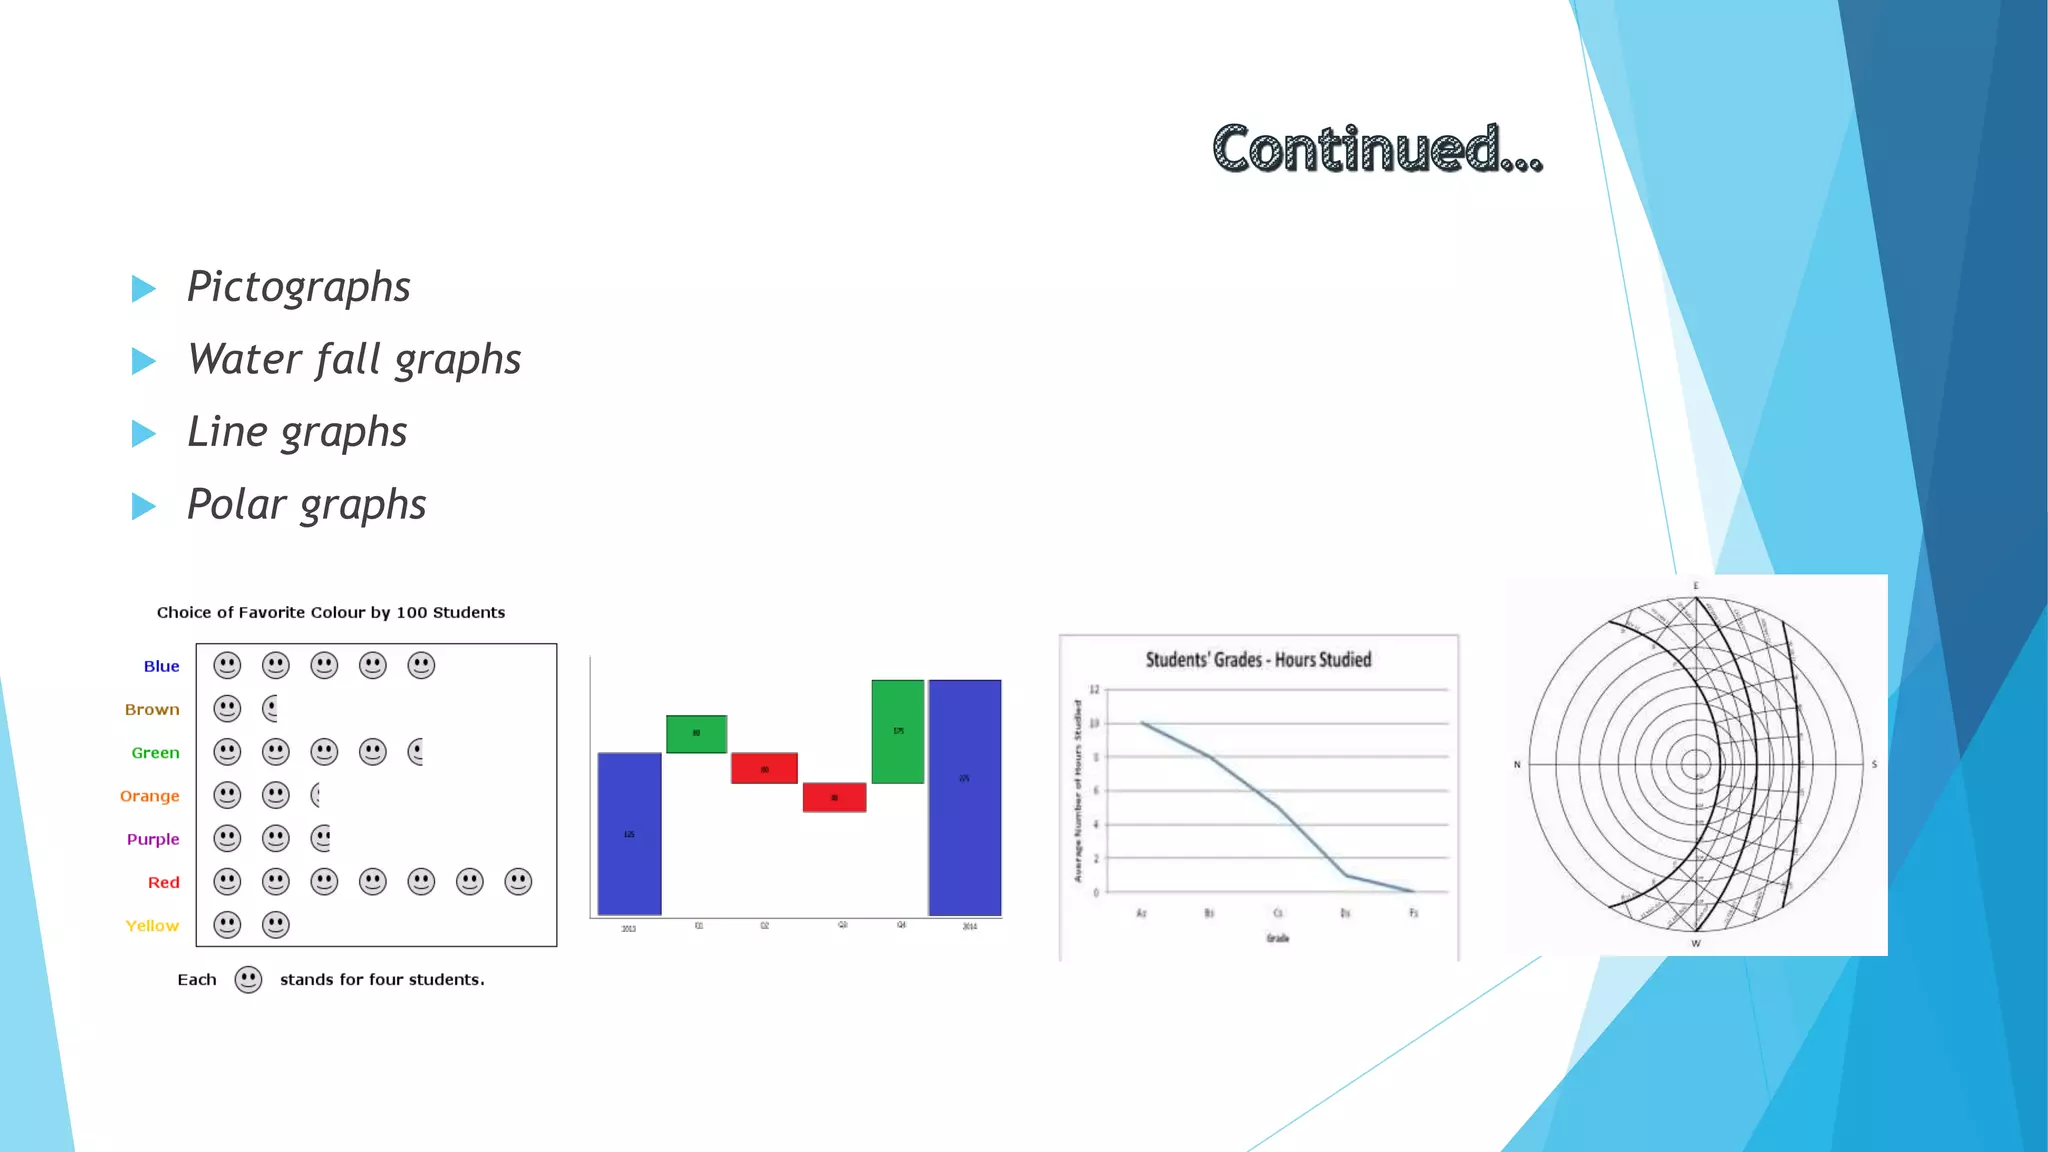
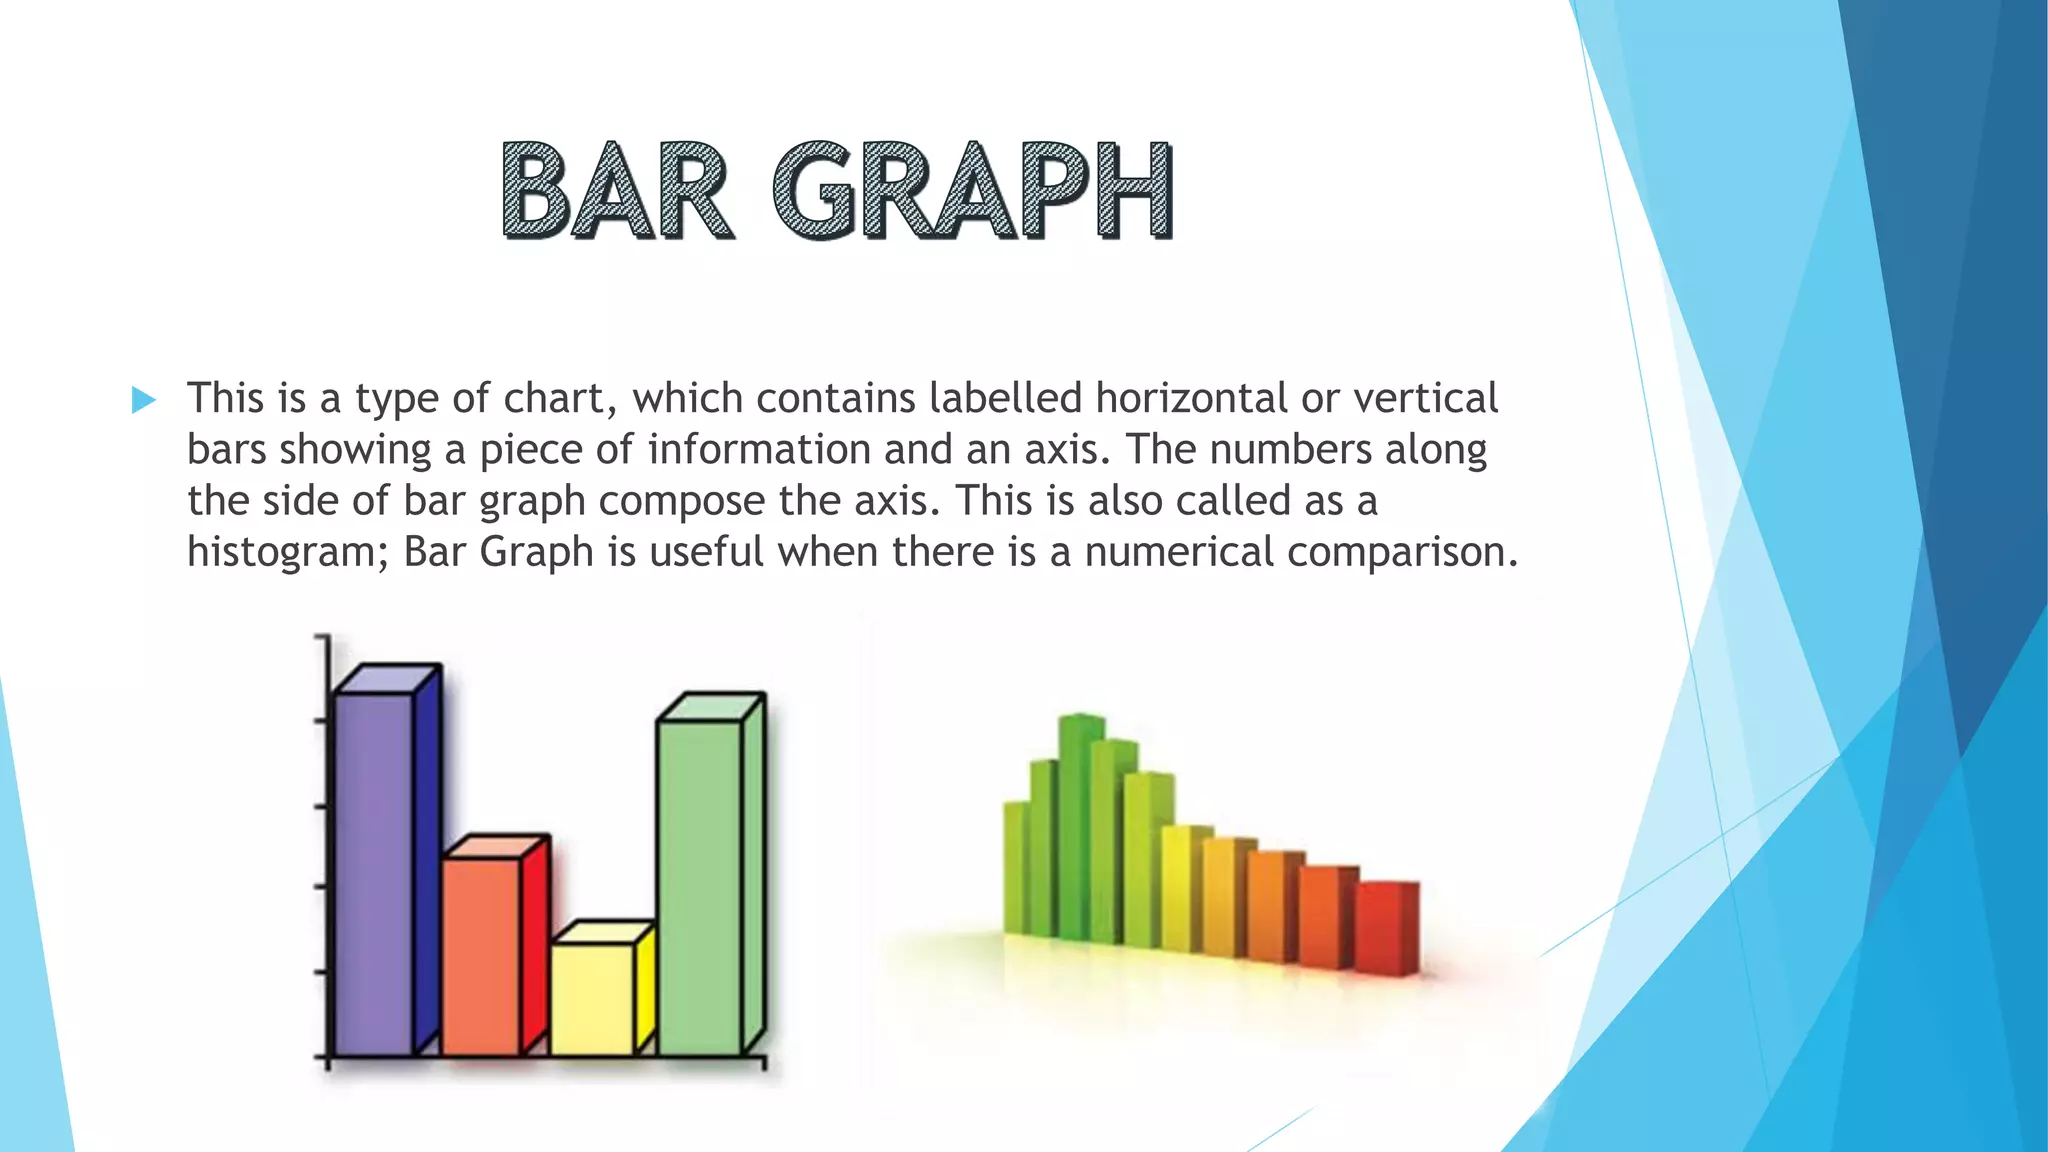
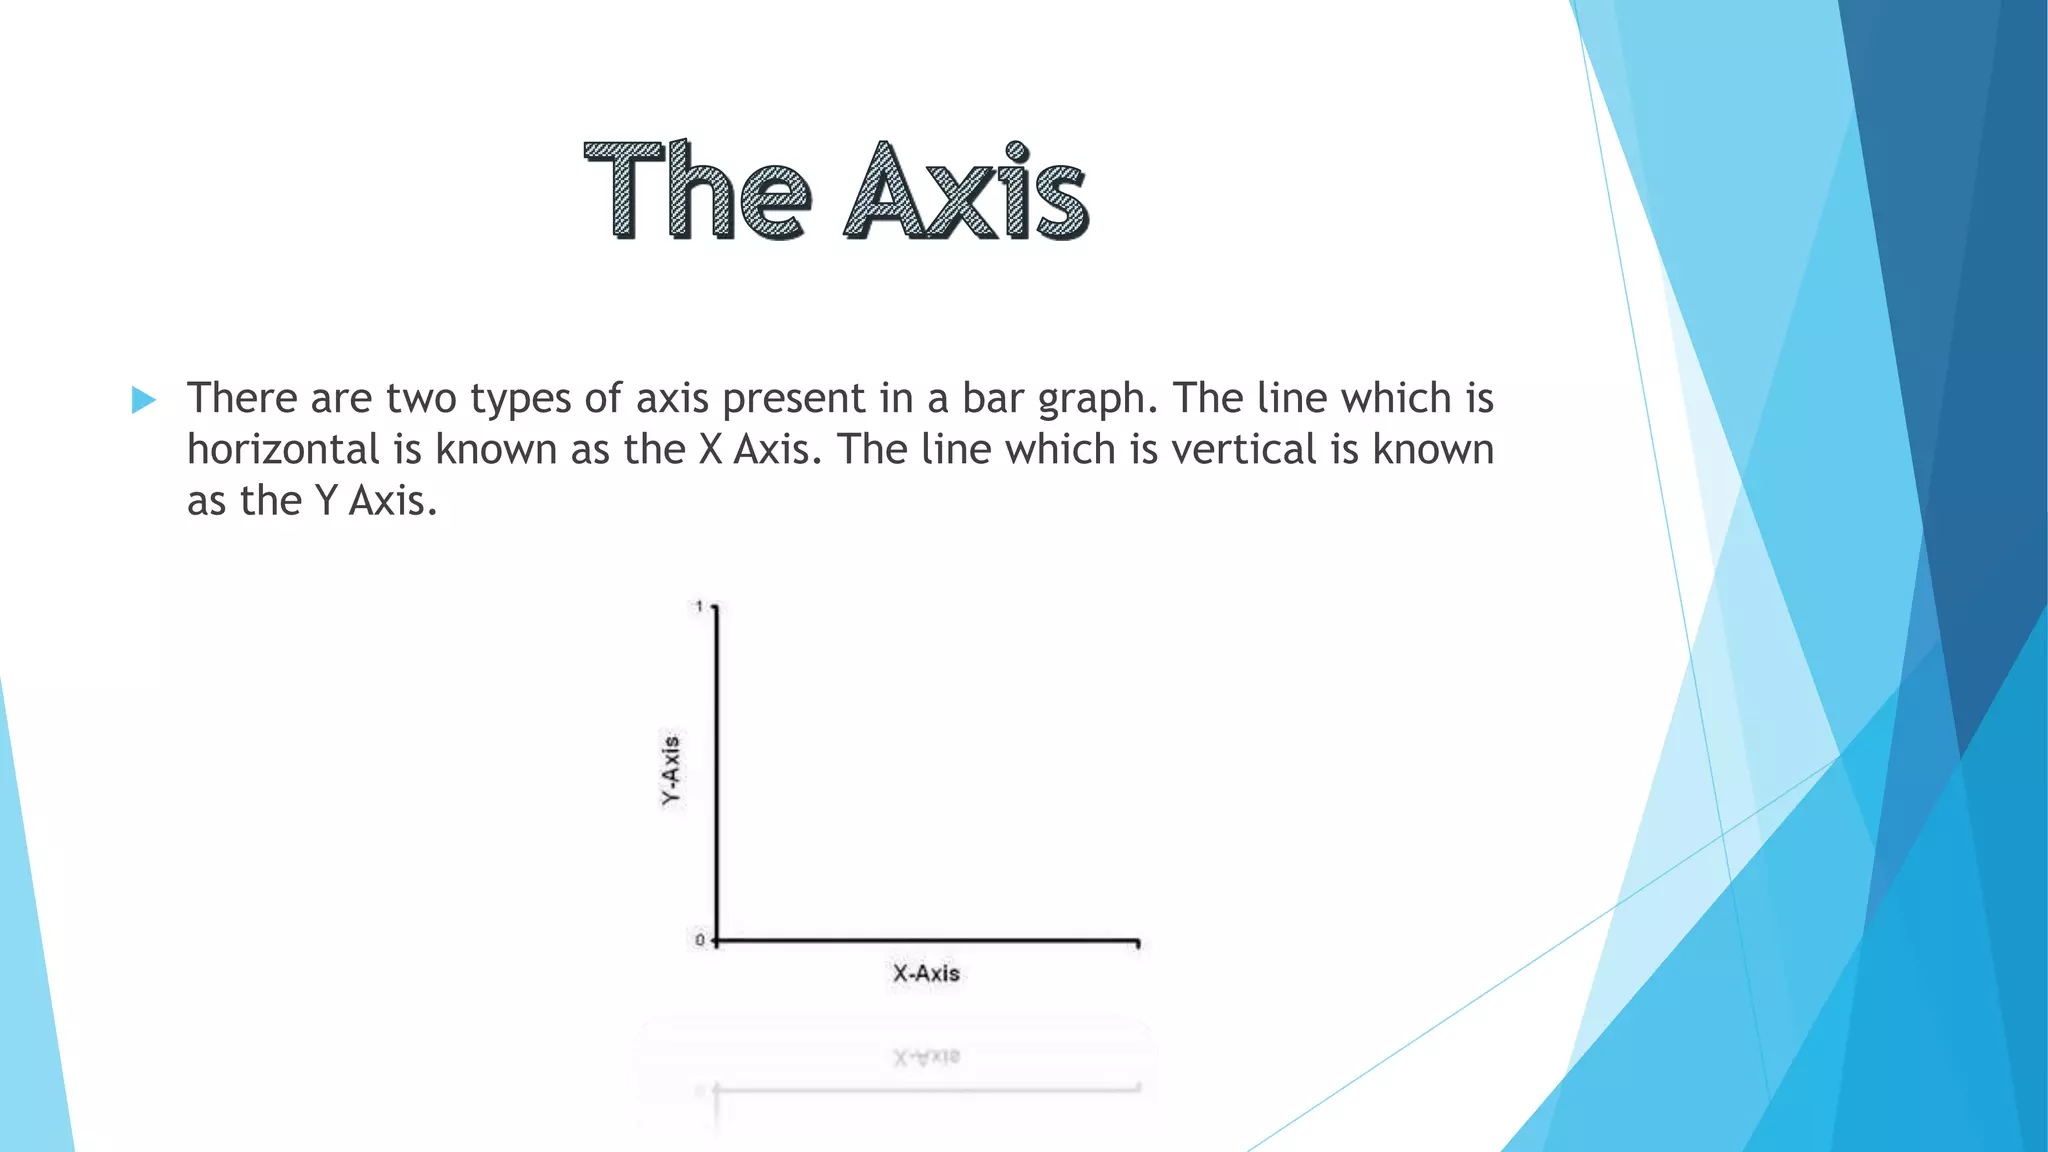
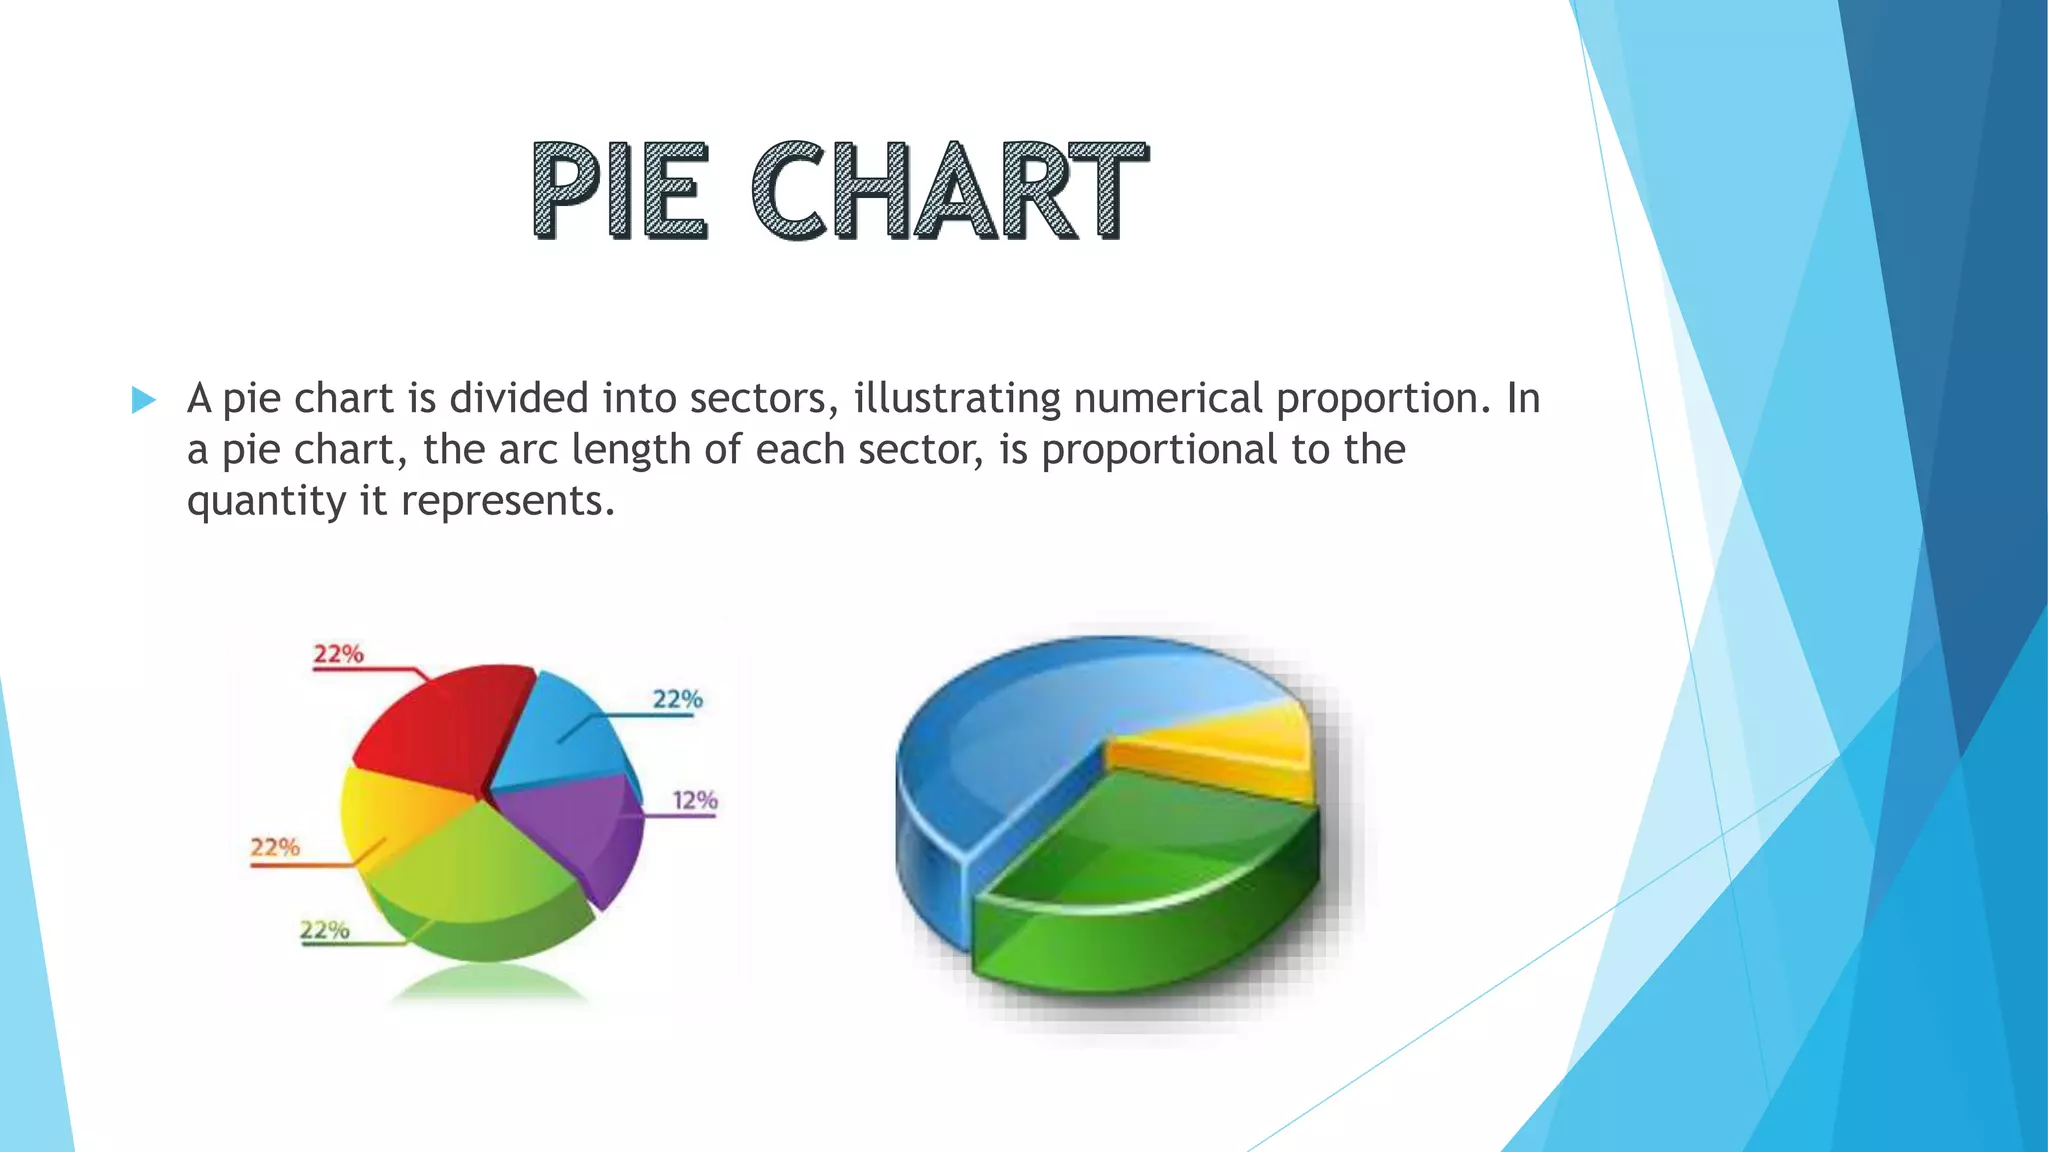
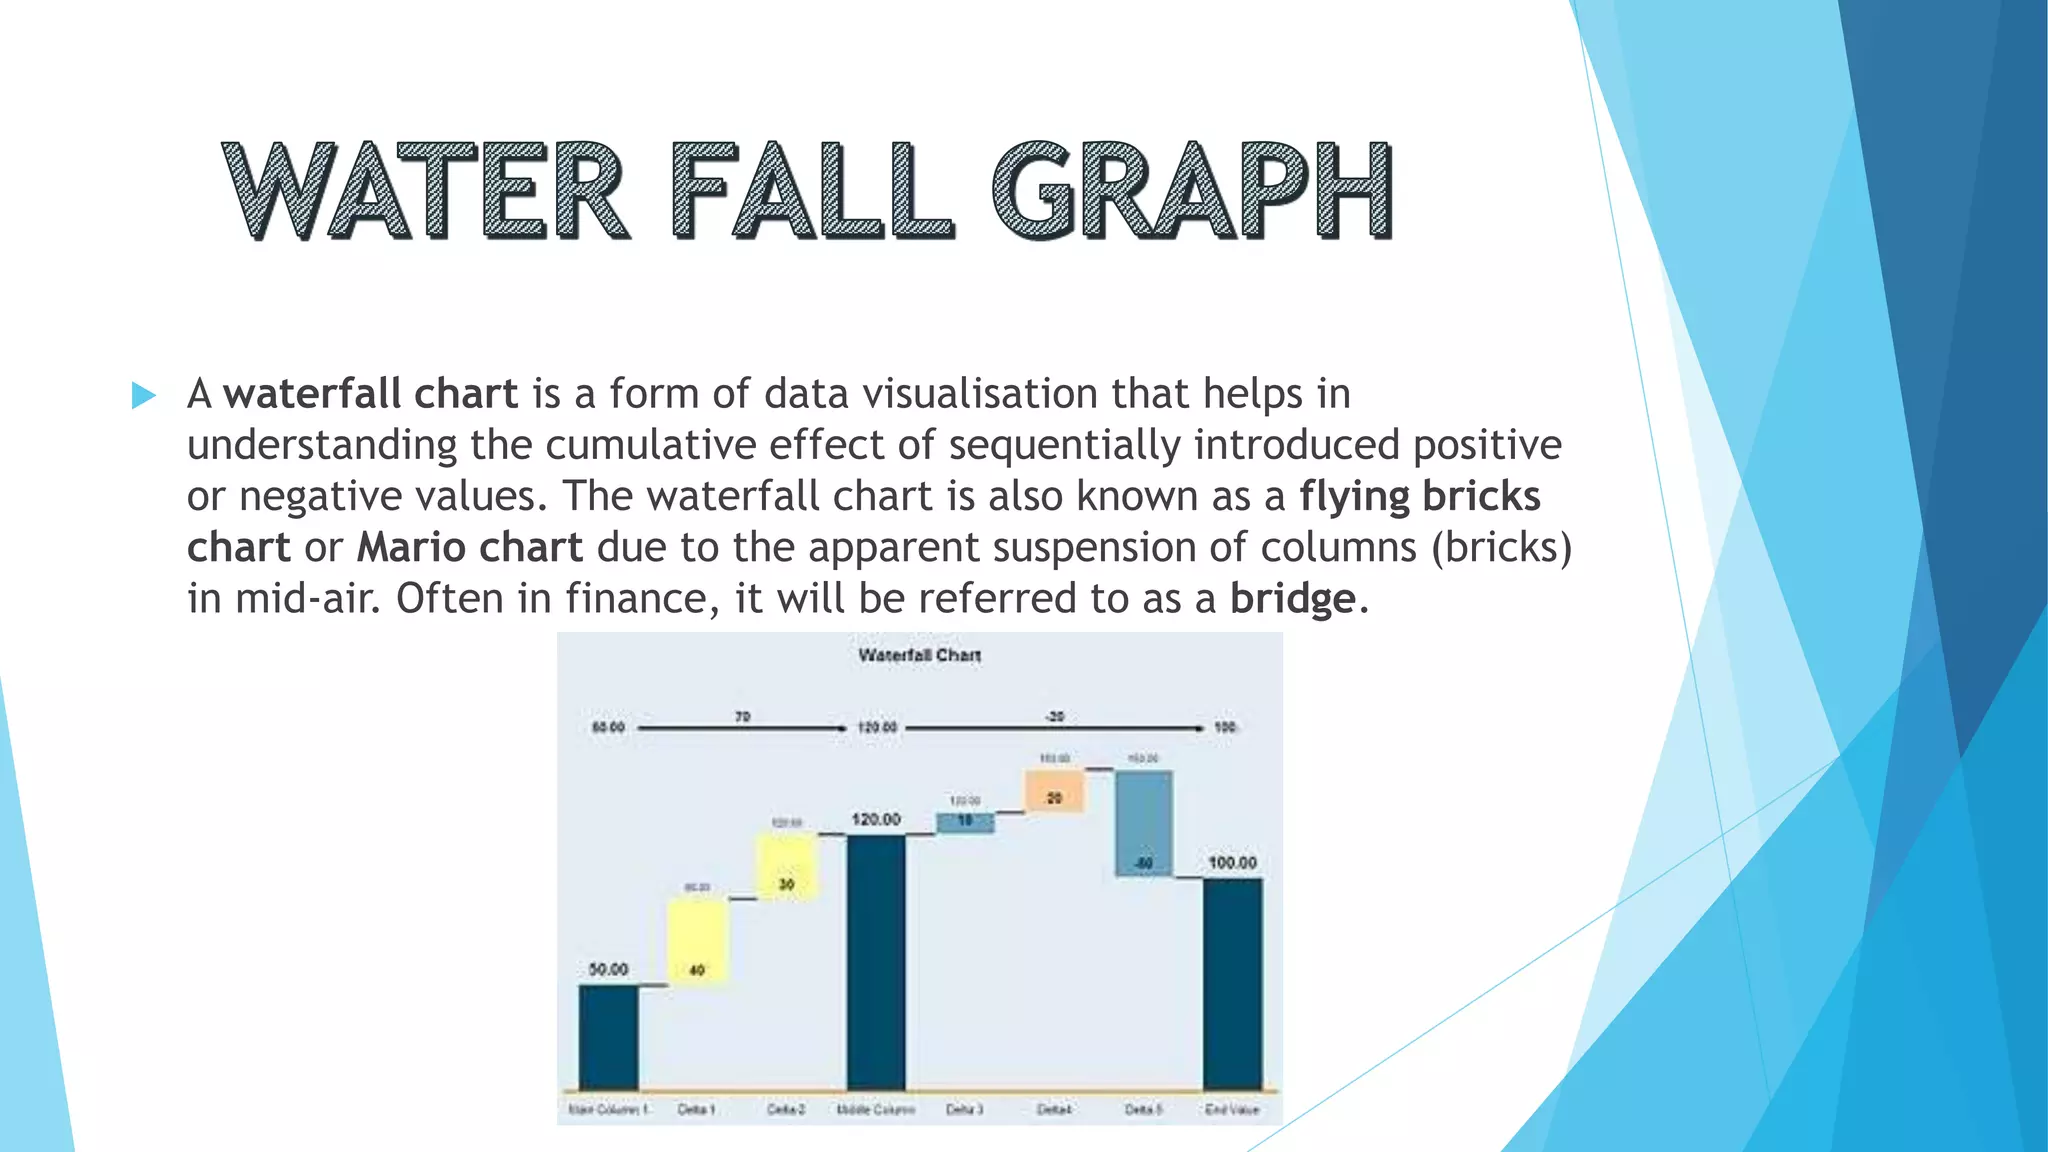
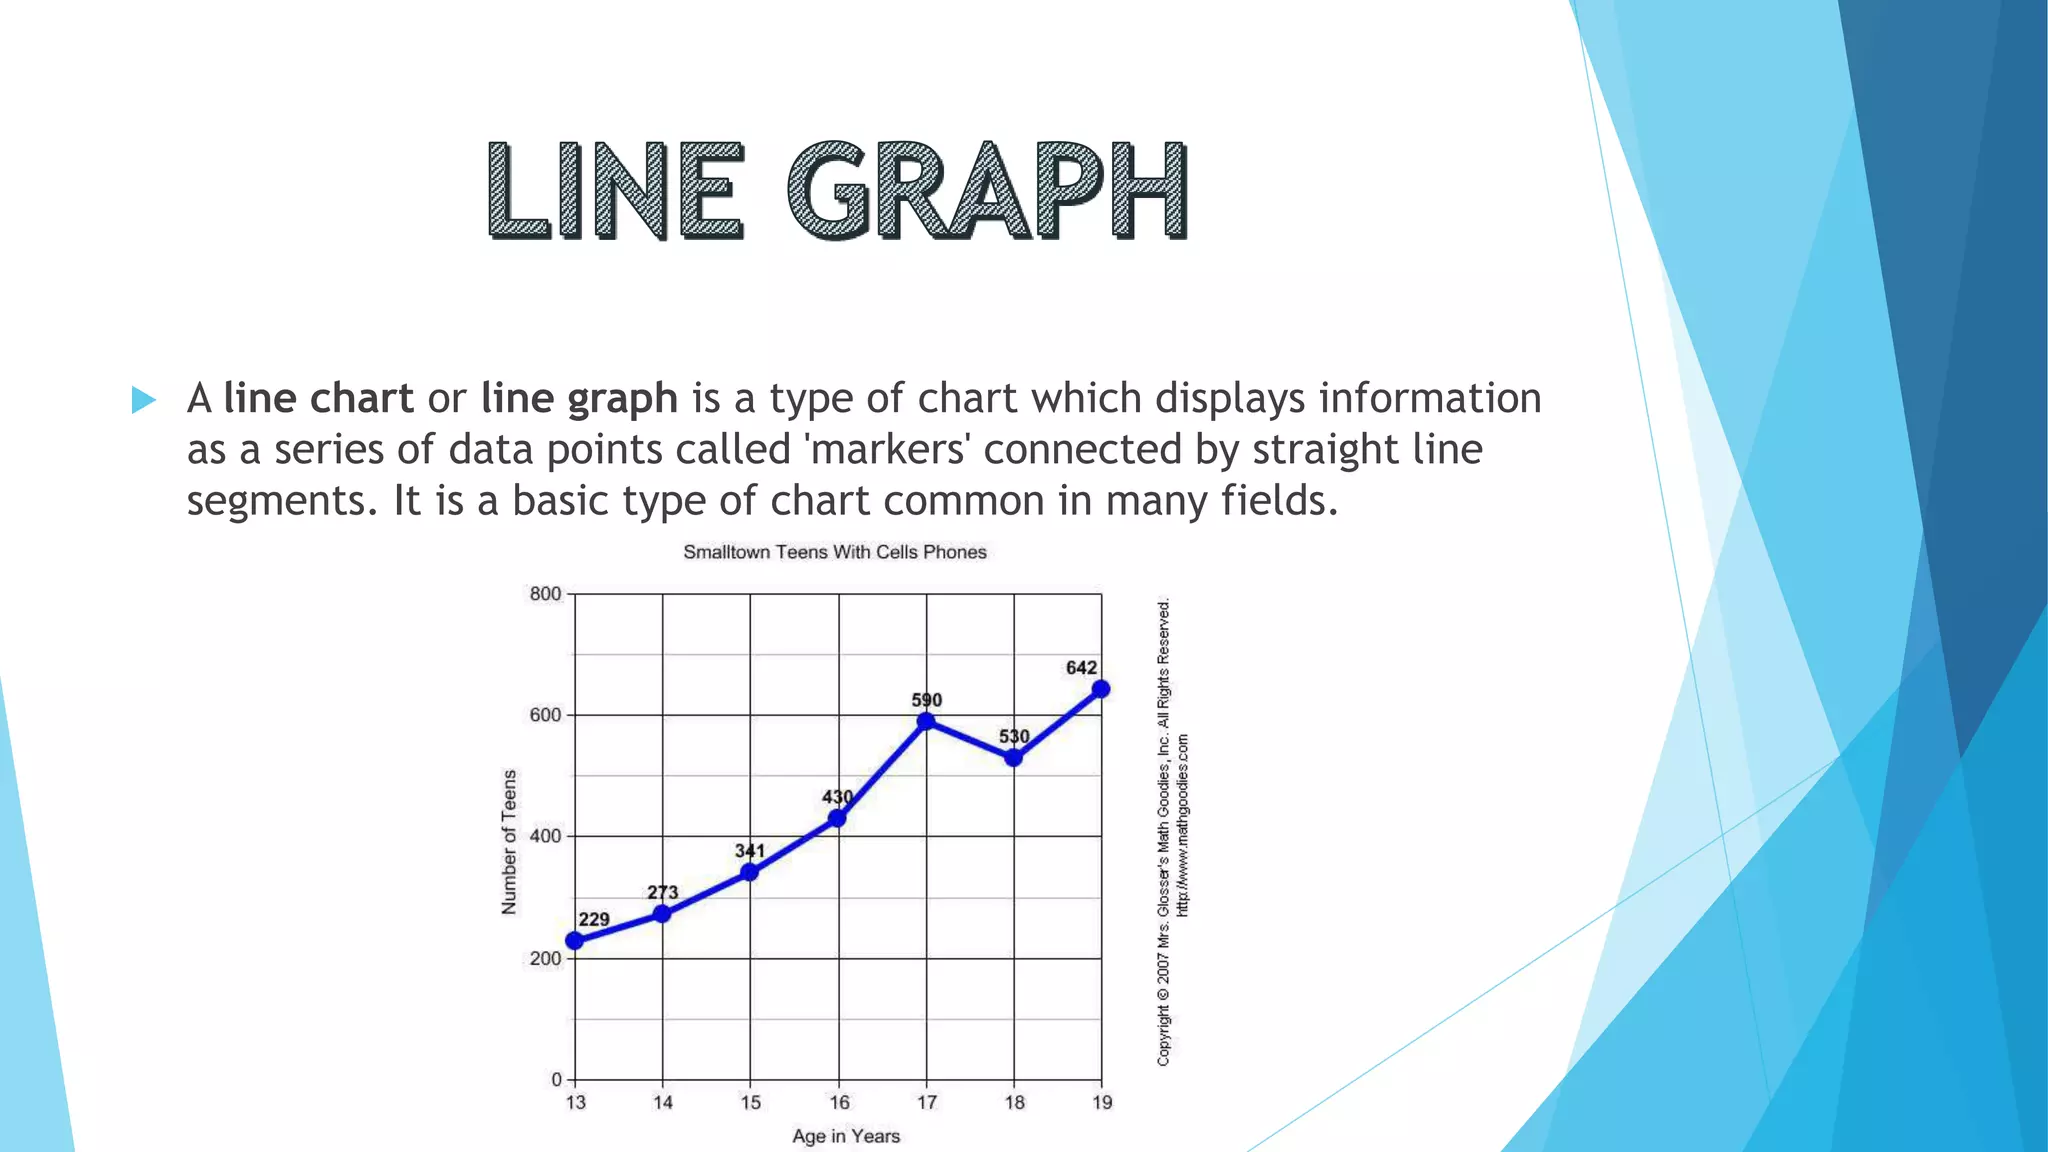
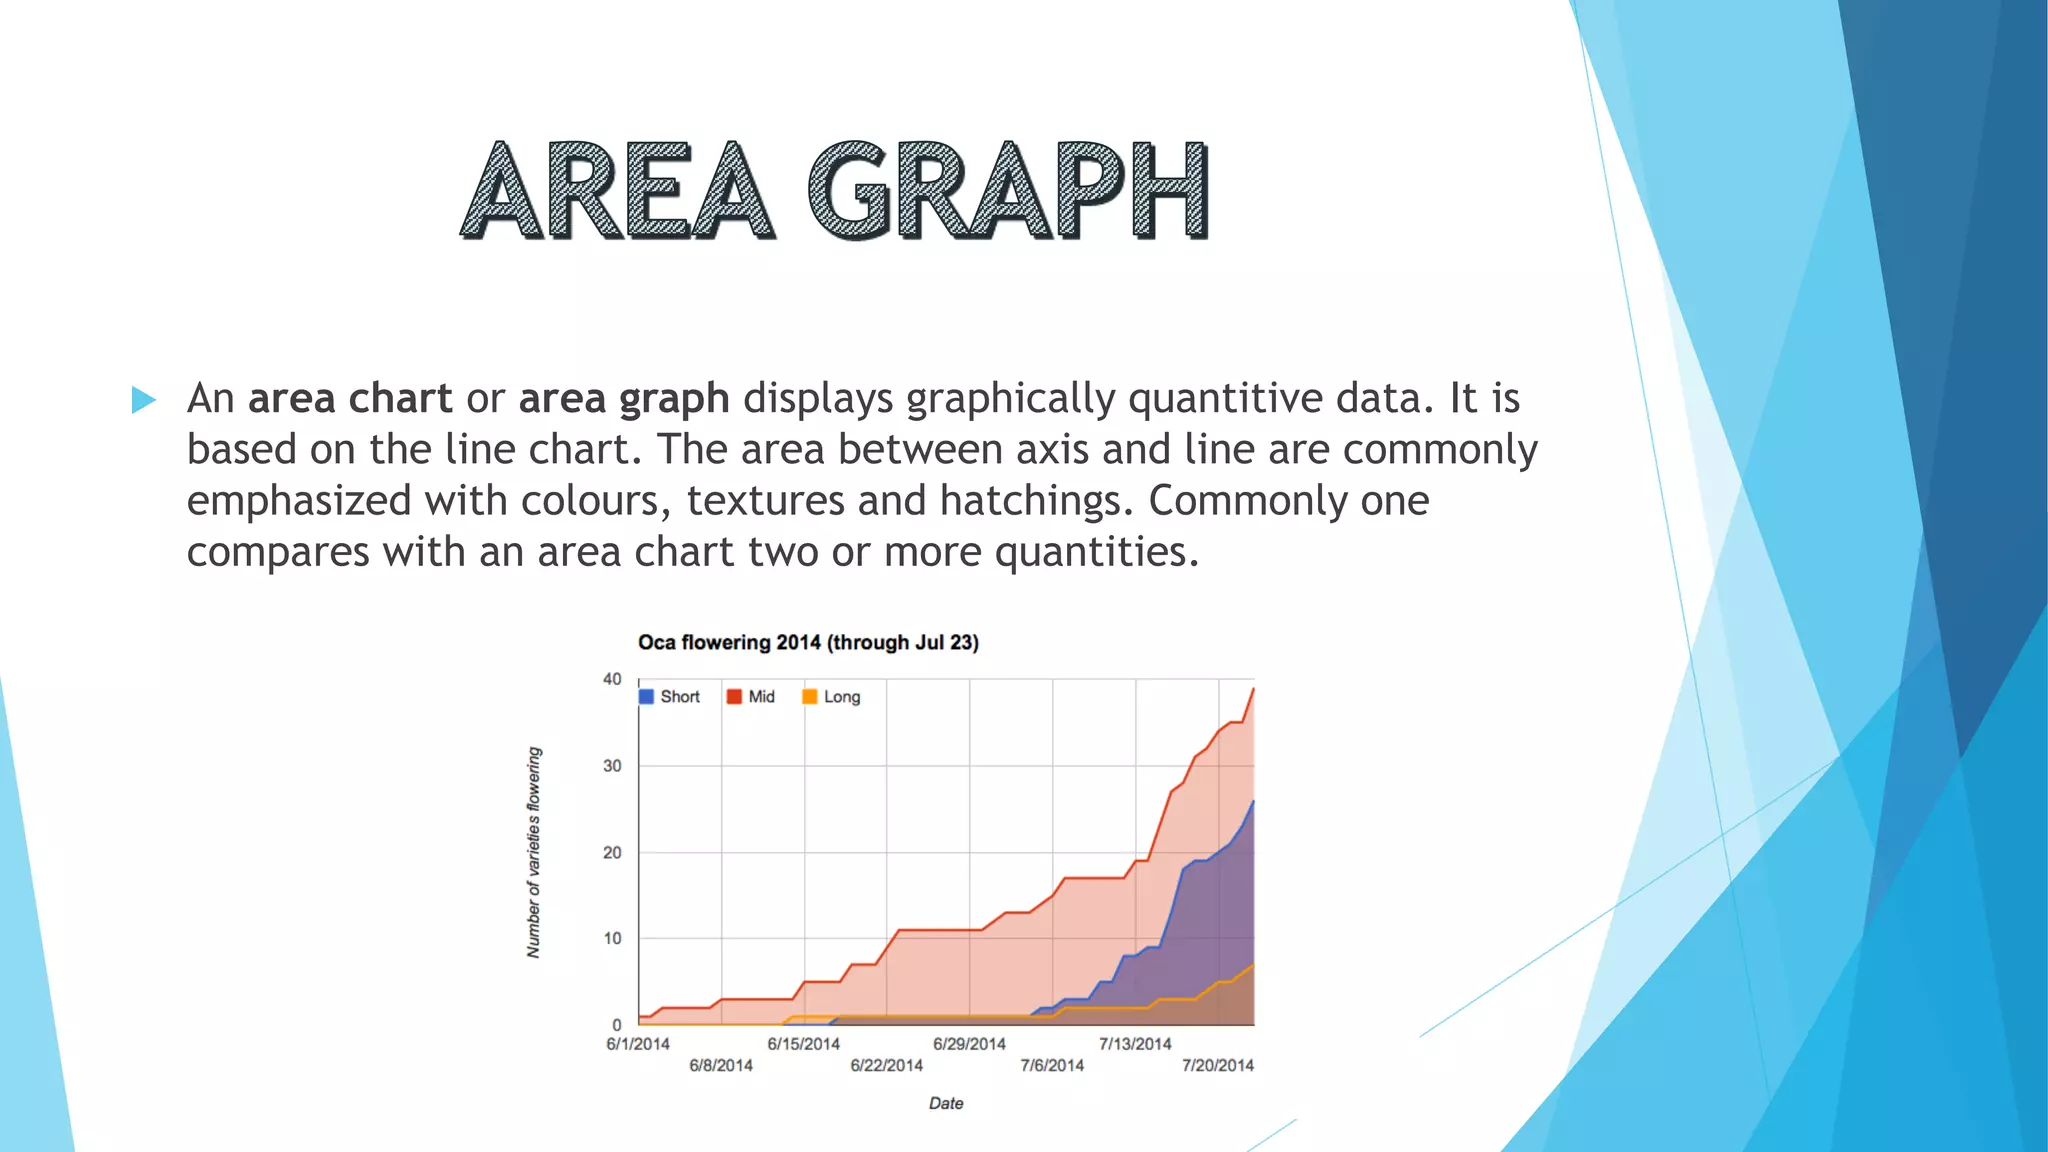
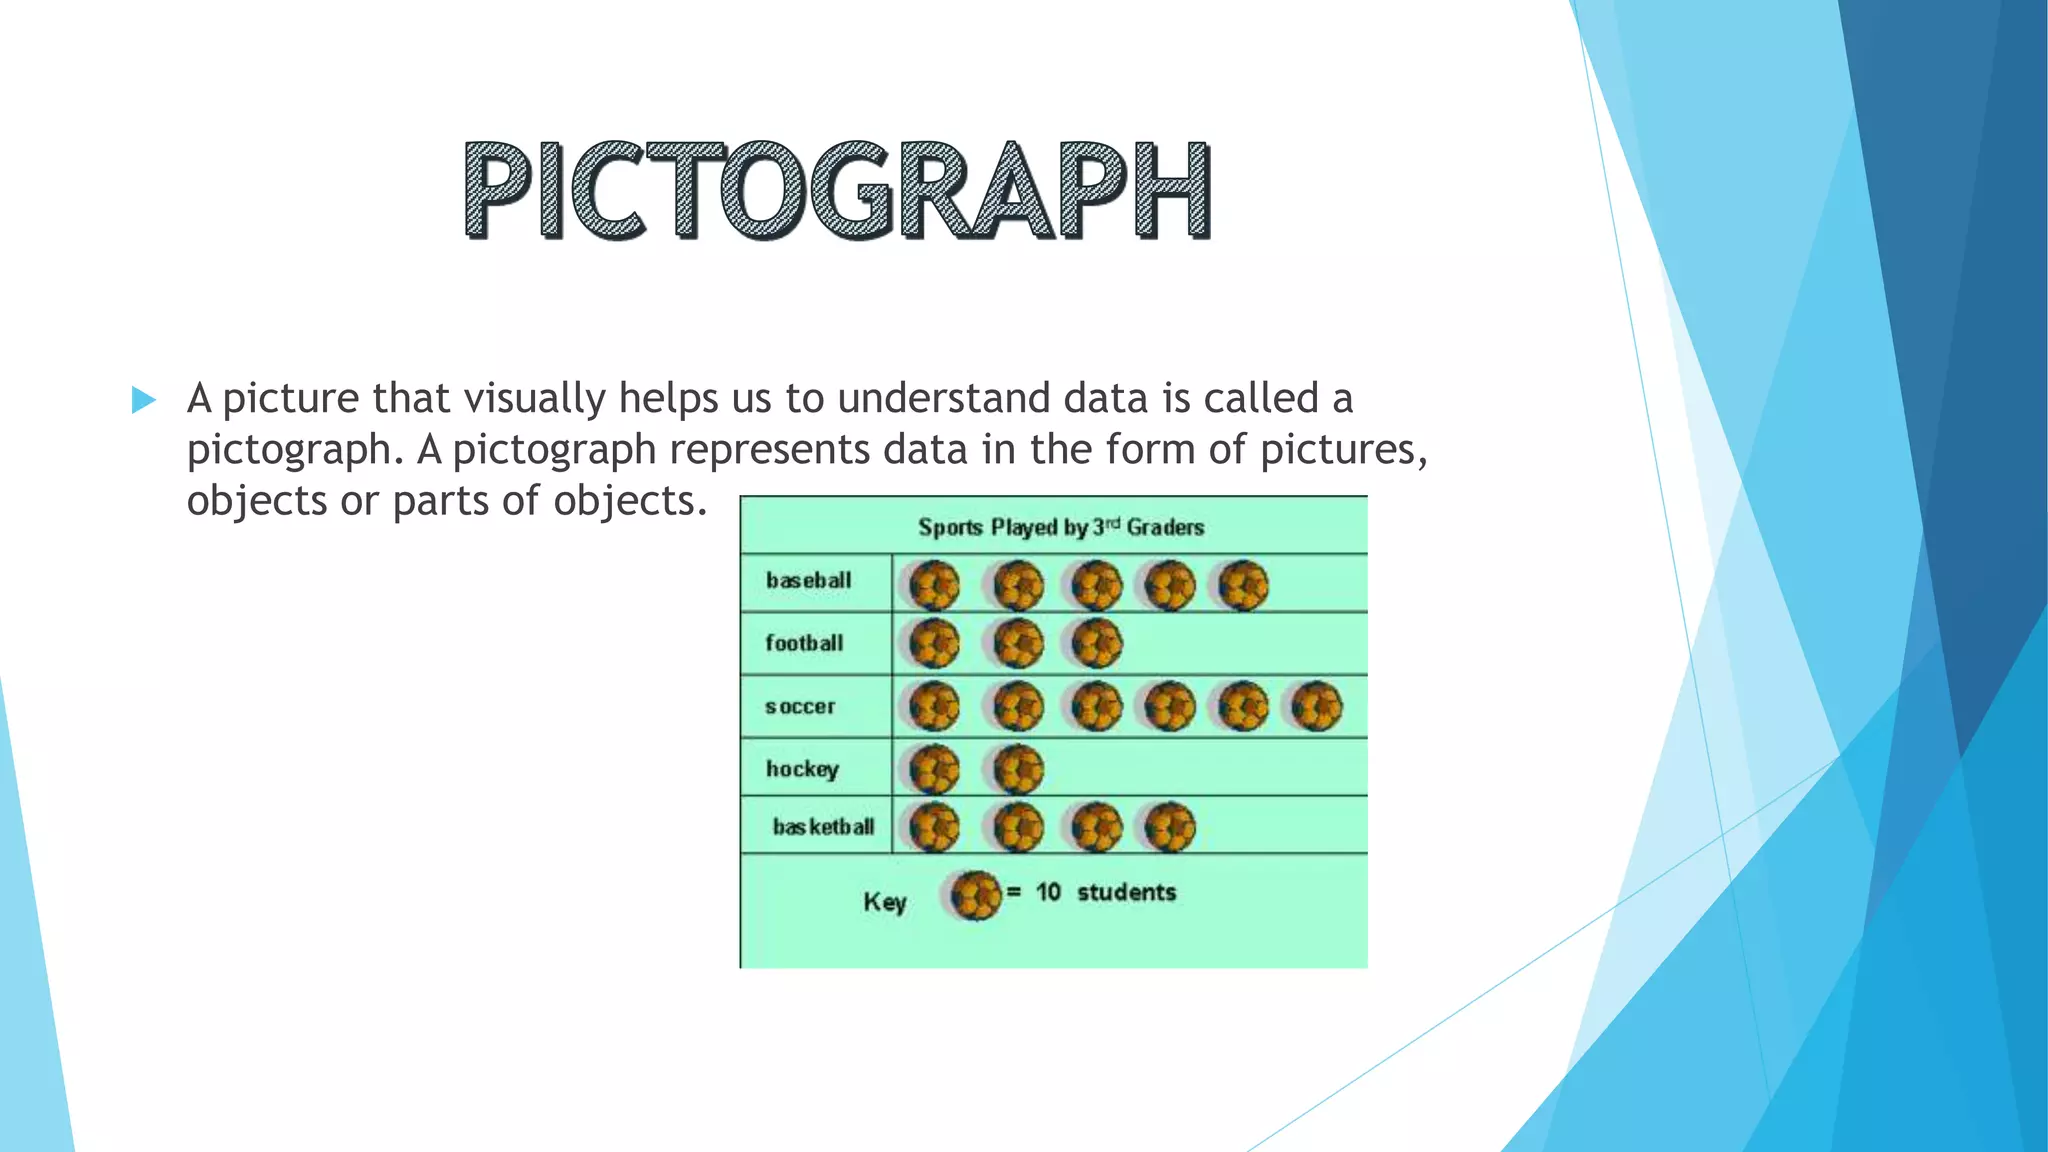
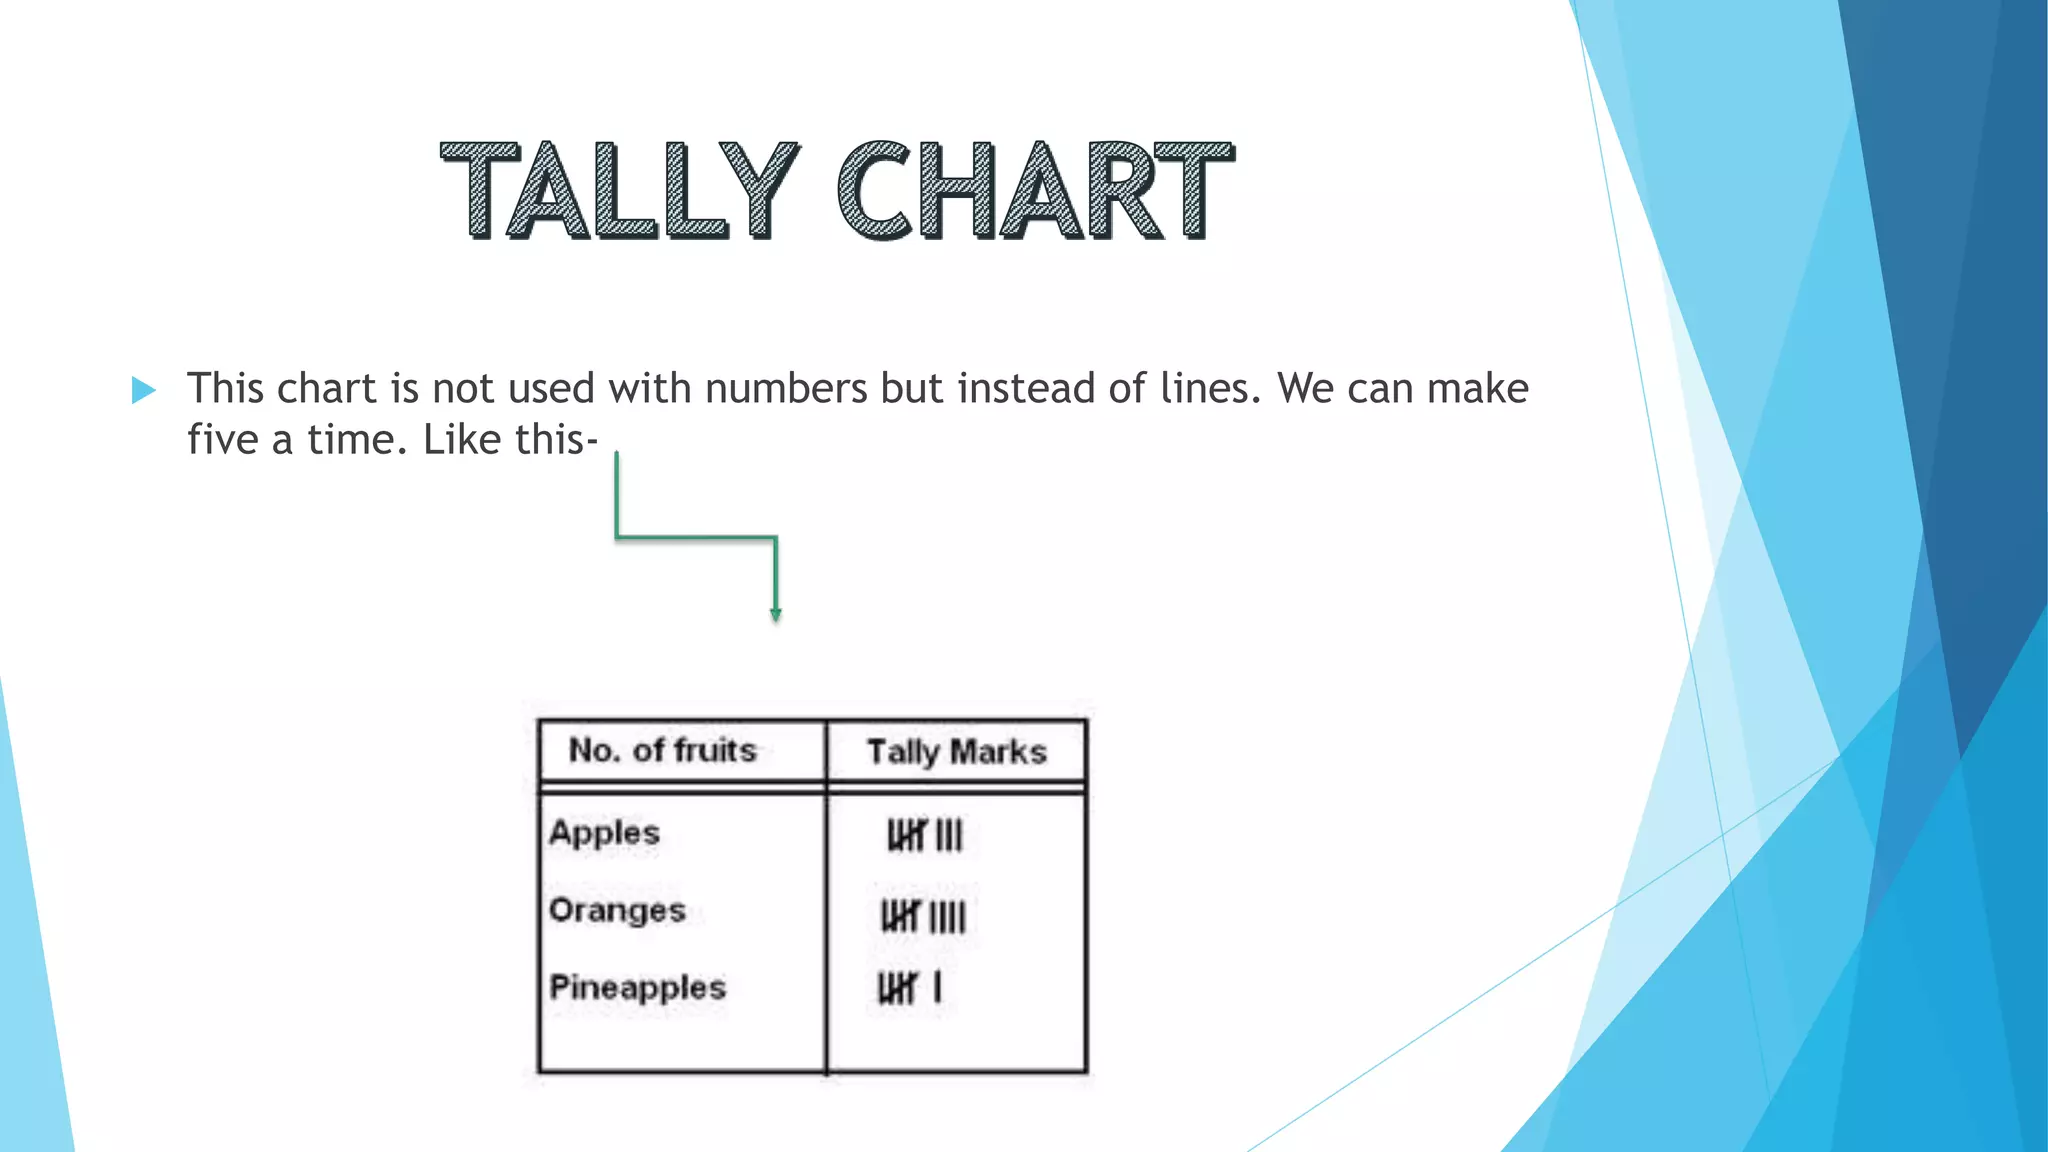
SlideShare a Scribd company logo
INDEX
What is data handling?
The types of graphs
Bar graph
The axis
Pie chart
Water fall graph
Line graph
Area graph
Pictograph
Tally chart
By Rayna Rocha VI J
 Data handling is the process of ensuring that research data is stored,
archived or disposed off in a safe and secure manner during and after
the conclusion of a research project. This includes the development of
policies and procedures to manage data handled electronically as
well as through non-electronic means .
 There are eight main graphs. Their names are
 Bar graphs
 Pie charts
 Tally charts
 Area graphs
 Pictographs
 Water fall graphs
 Line graphs
 Polar graphs
 This is a type of chart, which contains labelled horizontal or vertical
bars showing a piece of information and an axis. The numbers along
the side of bar graph compose the axis. This is also called as a
histogram; Bar Graph is useful when there is a numerical comparison.
 There are two types of axis present in a bar graph. The line which is
horizontal is known as the X Axis. The line which is vertical is known
as the Y Axis.
 A pie chart is divided into sectors, illustrating numerical proportion. In
a pie chart, the arc length of each sector, is proportional to the
quantity it represents.
 A waterfall chart is a form of data visualisation that helps in
understanding the cumulative effect of sequentially introduced positive
or negative values. The waterfall chart is also known as a flying bricks
chart or Mario chart due to the apparent suspension of columns (bricks)
in mid-air. Often in finance, it will be referred to as a bridge.
 A line chart or line graph is a type of chart which displays information
as a series of data points called 'markers' connected by straight line
segments. It is a basic type of chart common in many fields.
 An area chart or area graph displays graphically quantitive data. It is
based on the line chart. The area between axis and line are commonly
emphasized with colours, textures and hatchings. Commonly one
compares with an area chart two or more quantities.
 A picture that visually helps us to understand data is called a
pictograph. A pictograph represents data in the form of pictures,
objects or parts of objects.
 This chart is not used with numbers but instead of lines. We can make
five a time. Like this-
Data handling

More Related Content

What's hot

Data handling
Data handlingData handling
Data handling
Advetya Pillai
 
Data Handling
Data HandlingData Handling
Data Handling
Manisha Keim
 
Different Types of Graphs
Different Types of GraphsDifferent Types of Graphs
Different Types of Graphs
RileyAntler
 
Chapter5 data handling grade 8 cbse
Chapter5  data handling grade 8 cbseChapter5  data handling grade 8 cbse
Chapter5 data handling grade 8 cbse
htanny
 
What is Line Graph
What is Line GraphWhat is Line Graph
What is Line Graph
Asad Afridi
 
number system ppt
number system ppt number system ppt
number system ppt
Akash dixit
 
Algebraic expressions
Algebraic expressionsAlgebraic expressions
Algebraic expressions
Christie Harp
 
Bar graph presentation
Bar graph presentationBar graph presentation
Bar graph presentation982665379
 
Hcf+lcm
Hcf+lcm Hcf+lcm
Hcf+lcm
mayank jain
 
Ratio and Proportion
Ratio and ProportionRatio and Proportion
Ratio and Proportion
Cristy Melloso
 
Rational and irrational numbers
Rational and irrational numbersRational and irrational numbers
Rational and irrational numbers
Amarendra Kumar
 
Introduction 3D shapes
Introduction 3D shapesIntroduction 3D shapes
Introduction 3D shapes
Inne Milanisti Sihasale
 
PIE CHART
PIE CHARTPIE CHART
PIE CHART
Priya Dharshini
 
Bar chart
Bar chartBar chart
Bar chart
DrGhadooRa
 
Factors and Multiples
Factors and MultiplesFactors and Multiples
Factors and Multiples
Ruby Rose Ann Panganod
 
Average
AverageAverage
Average
hooriaFahad
 
Factors and multiples
Factors and multiplesFactors and multiples
Factors and multiples
Adam Mlynarczyk
 
Area & Perimeter
Area & PerimeterArea & Perimeter
Area & Perimeter
mlimon
 
Data handling class 8th
Data handling class 8thData handling class 8th
Data handling class 8th
Sanjay Thakran
 

What's hot (20)

Data handling
Data handlingData handling
Data handling
 
Data Handling
Data HandlingData Handling
Data Handling
 
Different Types of Graphs
Different Types of GraphsDifferent Types of Graphs
Different Types of Graphs
 
Chapter5 data handling grade 8 cbse
Chapter5  data handling grade 8 cbseChapter5  data handling grade 8 cbse
Chapter5 data handling grade 8 cbse
 
What is Line Graph
What is Line GraphWhat is Line Graph
What is Line Graph
 
number system ppt
number system ppt number system ppt
number system ppt
 
Algebraic expressions
Algebraic expressionsAlgebraic expressions
Algebraic expressions
 
Bar graph presentation
Bar graph presentationBar graph presentation
Bar graph presentation
 
Hcf+lcm
Hcf+lcm Hcf+lcm
Hcf+lcm
 
Ratio and Proportion
Ratio and ProportionRatio and Proportion
Ratio and Proportion
 
Rational and irrational numbers
Rational and irrational numbersRational and irrational numbers
Rational and irrational numbers
 
Data Handling
Data HandlingData Handling
Data Handling
 
Introduction 3D shapes
Introduction 3D shapesIntroduction 3D shapes
Introduction 3D shapes
 
PIE CHART
PIE CHARTPIE CHART
PIE CHART
 
Bar chart
Bar chartBar chart
Bar chart
 
Factors and Multiples
Factors and MultiplesFactors and Multiples
Factors and Multiples
 
Average
AverageAverage
Average
 
Factors and multiples
Factors and multiplesFactors and multiples
Factors and multiples
 
Area & Perimeter
Area & PerimeterArea & Perimeter
Area & Perimeter
 
Data handling class 8th
Data handling class 8thData handling class 8th
Data handling class 8th
 

Viewers also liked

Data Handling
Data HandlingData Handling
Data Handling
Praveen M Jigajinni
 
Data Handling.
Data Handling. Data Handling.
Data Handling.
Vrinda Baweja
 
Data handling -
Data handling  -Data handling  -
Data handling -
Manpreet Singh
 
Data handling
Data handlingData handling
Data handling
Sarvesh Khandagale
 
Data Handling
Data HandlingData Handling
Data Handling
MAJU
 
Handling social science data: Challenges and responses
Handling social science data: Challenges and responsesHandling social science data: Challenges and responses
Handling social science data: Challenges and responses
NeISSProject
 
Handling quantitative data and preparing for sharing and reuse, including dat...
Handling quantitative data and preparing for sharing and reuse, including dat...Handling quantitative data and preparing for sharing and reuse, including dat...
Handling quantitative data and preparing for sharing and reuse, including dat...
Arhiv družboslovnih podatkov
 
Graphs and chars
Graphs and charsGraphs and chars
Graphs and chars
salemhusin
 
specimen collection&handling,Lusubilo2012
specimen collection&handling,Lusubilo2012specimen collection&handling,Lusubilo2012
specimen collection&handling,Lusubilo2012
Lusubilo Malakibungu
 
Chapter 3: Prsentation of Data
Chapter 3: Prsentation of DataChapter 3: Prsentation of Data
Chapter 3: Prsentation of Data
Andrilyn Alcantara
 
Statistics
StatisticsStatistics
Statisticsdiereck
 
Collection and Handling of Specimens for Laboratory Diagnosis
Collection and Handling of Specimens for Laboratory DiagnosisCollection and Handling of Specimens for Laboratory Diagnosis
Collection and Handling of Specimens for Laboratory Diagnosis
Perez Eric
 
Data integrity
Data integrityData integrity
Data integrity
Kiran Kota
 
1.1 real number system dfs
1.1 real number system dfs1.1 real number system dfs
1.1 real number system dfs
Farhana Shaheen
 
Number system
Number systemNumber system
Number system
Aditya Sharat
 
Graphical presentation of data
Graphical presentation of dataGraphical presentation of data
Graphical presentation of datadrasifk
 
Specimen collection and preservation
Specimen collection and preservationSpecimen collection and preservation
Specimen collection and preservation
Serene Pearl
 

Viewers also liked (20)

Data Handling
Data HandlingData Handling
Data Handling
 
Data Handling.
Data Handling. Data Handling.
Data Handling.
 
Data handling -
Data handling  -Data handling  -
Data handling -
 
Data handling
Data handlingData handling
Data handling
 
Data Handling
Data HandlingData Handling
Data Handling
 
Data handling
Data handlingData handling
Data handling
 
Number scale
Number scaleNumber scale
Number scale
 
Handling social science data: Challenges and responses
Handling social science data: Challenges and responsesHandling social science data: Challenges and responses
Handling social science data: Challenges and responses
 
Handling quantitative data and preparing for sharing and reuse, including dat...
Handling quantitative data and preparing for sharing and reuse, including dat...Handling quantitative data and preparing for sharing and reuse, including dat...
Handling quantitative data and preparing for sharing and reuse, including dat...
 
Number types
Number typesNumber types
Number types
 
Graphs and chars
Graphs and charsGraphs and chars
Graphs and chars
 
specimen collection&handling,Lusubilo2012
specimen collection&handling,Lusubilo2012specimen collection&handling,Lusubilo2012
specimen collection&handling,Lusubilo2012
 
Chapter 3: Prsentation of Data
Chapter 3: Prsentation of DataChapter 3: Prsentation of Data
Chapter 3: Prsentation of Data
 
Statistics
StatisticsStatistics
Statistics
 
Collection and Handling of Specimens for Laboratory Diagnosis
Collection and Handling of Specimens for Laboratory DiagnosisCollection and Handling of Specimens for Laboratory Diagnosis
Collection and Handling of Specimens for Laboratory Diagnosis
 
Data integrity
Data integrityData integrity
Data integrity
 
1.1 real number system dfs
1.1 real number system dfs1.1 real number system dfs
1.1 real number system dfs
 
Number system
Number systemNumber system
Number system
 
Graphical presentation of data
Graphical presentation of dataGraphical presentation of data
Graphical presentation of data
 
Specimen collection and preservation
Specimen collection and preservationSpecimen collection and preservation
Specimen collection and preservation
 

Similar to Data handling

Graphing Data
Graphing DataGraphing Data
Graphing Datashas595
 
Basics of Educational Statistics (Graphs & its Types)
Basics of Educational Statistics (Graphs & its Types)Basics of Educational Statistics (Graphs & its Types)
Basics of Educational Statistics (Graphs & its Types)
HennaAnsari
 
Graphs
GraphsGraphs
seminar.pptx
seminar.pptxseminar.pptx
seminar.pptx
DilkashMittal1
 
Different Types of Graphs - Copy.pptx
Different Types of Graphs - Copy.pptxDifferent Types of Graphs - Copy.pptx
Different Types of Graphs - Copy.pptx
Chrysler Kayce
 
transcoding_linear_to_non-linear_text.pptx
transcoding_linear_to_non-linear_text.pptxtranscoding_linear_to_non-linear_text.pptx
transcoding_linear_to_non-linear_text.pptx
GladdysJoyRomano
 
Organizing And Presenting Data.pptx
Organizing And Presenting Data.pptxOrganizing And Presenting Data.pptx
Organizing And Presenting Data.pptx
VanessaRobante
 
Organizing And Presenting Data.pptx
Organizing And Presenting Data.pptxOrganizing And Presenting Data.pptx
Organizing And Presenting Data.pptx
VanessaRobante
 
Presentation de la DATA visualisation.pptx
Presentation de la DATA visualisation.pptxPresentation de la DATA visualisation.pptx
Presentation de la DATA visualisation.pptx
salmakoummich
 
Statistical Graphics / Exploratory Data Analysis - DAY 2 - 8614 - B.Ed - AIOU
Statistical Graphics / Exploratory Data Analysis - DAY 2 - 8614 - B.Ed - AIOUStatistical Graphics / Exploratory Data Analysis - DAY 2 - 8614 - B.Ed - AIOU
Statistical Graphics / Exploratory Data Analysis - DAY 2 - 8614 - B.Ed - AIOU
EqraBaig
 
Charts And Graphs
Charts And GraphsCharts And Graphs
Charts And Graphs
Himadri Shekhar
 
Introduction to Statistics information.pptx
Introduction to Statistics information.pptxIntroduction to Statistics information.pptx
Introduction to Statistics information.pptx
HarshiHarshika1
 
GRAPHS-FOR-QUALITATIVE-DATA.pptx
GRAPHS-FOR-QUALITATIVE-DATA.pptxGRAPHS-FOR-QUALITATIVE-DATA.pptx
GRAPHS-FOR-QUALITATIVE-DATA.pptx
NectorMoradaRapsingB
 
Qt graphical representation of data
Qt   graphical representation of dataQt   graphical representation of data
Qt graphical representation of dataJoel Pais
 
Qt graphical representation of data
Qt   graphical representation of dataQt   graphical representation of data
Qt graphical representation of dataJoel Pais
 
Displaying data using charts and graphs
Displaying data using charts and graphsDisplaying data using charts and graphs
Displaying data using charts and graphsCharles Flynt
 
GIS Ostrava 2018 – Insights for ArGIS
GIS Ostrava 2018 – Insights for ArGISGIS Ostrava 2018 – Insights for ArGIS
GIS Ostrava 2018 – Insights for ArGIS
Jan Novotný
 
105575916 maths-edit-new
105575916 maths-edit-new105575916 maths-edit-new
105575916 maths-edit-new
homeworkping7
 
Introduction to graph
Introduction to graphIntroduction to graph
Introduction to graphRoyB
 
Visual Aids.pptx
Visual Aids.pptxVisual Aids.pptx
Visual Aids.pptx
VinothKumarasamy2
 

Similar to Data handling (20)

Graphing Data
Graphing DataGraphing Data
Graphing Data
 
Basics of Educational Statistics (Graphs & its Types)
Basics of Educational Statistics (Graphs & its Types)Basics of Educational Statistics (Graphs & its Types)
Basics of Educational Statistics (Graphs & its Types)
 
Graphs
GraphsGraphs
Graphs
 
seminar.pptx
seminar.pptxseminar.pptx
seminar.pptx
 
Different Types of Graphs - Copy.pptx
Different Types of Graphs - Copy.pptxDifferent Types of Graphs - Copy.pptx
Different Types of Graphs - Copy.pptx
 
transcoding_linear_to_non-linear_text.pptx
transcoding_linear_to_non-linear_text.pptxtranscoding_linear_to_non-linear_text.pptx
transcoding_linear_to_non-linear_text.pptx
 
Organizing And Presenting Data.pptx
Organizing And Presenting Data.pptxOrganizing And Presenting Data.pptx
Organizing And Presenting Data.pptx
 
Organizing And Presenting Data.pptx
Organizing And Presenting Data.pptxOrganizing And Presenting Data.pptx
Organizing And Presenting Data.pptx
 
Presentation de la DATA visualisation.pptx
Presentation de la DATA visualisation.pptxPresentation de la DATA visualisation.pptx
Presentation de la DATA visualisation.pptx
 
Statistical Graphics / Exploratory Data Analysis - DAY 2 - 8614 - B.Ed - AIOU
Statistical Graphics / Exploratory Data Analysis - DAY 2 - 8614 - B.Ed - AIOUStatistical Graphics / Exploratory Data Analysis - DAY 2 - 8614 - B.Ed - AIOU
Statistical Graphics / Exploratory Data Analysis - DAY 2 - 8614 - B.Ed - AIOU
 
Charts And Graphs
Charts And GraphsCharts And Graphs
Charts And Graphs
 
Introduction to Statistics information.pptx
Introduction to Statistics information.pptxIntroduction to Statistics information.pptx
Introduction to Statistics information.pptx
 
GRAPHS-FOR-QUALITATIVE-DATA.pptx
GRAPHS-FOR-QUALITATIVE-DATA.pptxGRAPHS-FOR-QUALITATIVE-DATA.pptx
GRAPHS-FOR-QUALITATIVE-DATA.pptx
 
Qt graphical representation of data
Qt   graphical representation of dataQt   graphical representation of data
Qt graphical representation of data
 
Qt graphical representation of data
Qt   graphical representation of dataQt   graphical representation of data
Qt graphical representation of data
 
Displaying data using charts and graphs
Displaying data using charts and graphsDisplaying data using charts and graphs
Displaying data using charts and graphs
 
GIS Ostrava 2018 – Insights for ArGIS
GIS Ostrava 2018 – Insights for ArGISGIS Ostrava 2018 – Insights for ArGIS
GIS Ostrava 2018 – Insights for ArGIS
 
105575916 maths-edit-new
105575916 maths-edit-new105575916 maths-edit-new
105575916 maths-edit-new
 
Introduction to graph
Introduction to graphIntroduction to graph
Introduction to graph
 
Visual Aids.pptx
Visual Aids.pptxVisual Aids.pptx
Visual Aids.pptx
 

Recently uploaded

一比一原版(BU毕业证)波士顿大学毕业证成绩单
一比一原版(BU毕业证)波士顿大学毕业证成绩单一比一原版(BU毕业证)波士顿大学毕业证成绩单
一比一原版(BU毕业证)波士顿大学毕业证成绩单
ewymefz
 
Opendatabay - Open Data Marketplace.pptx
Opendatabay - Open Data Marketplace.pptxOpendatabay - Open Data Marketplace.pptx
Opendatabay - Open Data Marketplace.pptx
Opendatabay
 
Adjusting primitives for graph : SHORT REPORT / NOTES
Adjusting primitives for graph : SHORT REPORT / NOTESAdjusting primitives for graph : SHORT REPORT / NOTES
Adjusting primitives for graph : SHORT REPORT / NOTES
Subhajit Sahu
 
一比一原版(UMich毕业证)密歇根大学|安娜堡分校毕业证成绩单
一比一原版(UMich毕业证)密歇根大学|安娜堡分校毕业证成绩单一比一原版(UMich毕业证)密歇根大学|安娜堡分校毕业证成绩单
一比一原版(UMich毕业证)密歇根大学|安娜堡分校毕业证成绩单
ewymefz
 
一比一原版(TWU毕业证)西三一大学毕业证成绩单
一比一原版(TWU毕业证)西三一大学毕业证成绩单一比一原版(TWU毕业证)西三一大学毕业证成绩单
一比一原版(TWU毕业证)西三一大学毕业证成绩单
ocavb
 
Q1’2024 Update: MYCI’s Leap Year Rebound
Q1’2024 Update: MYCI’s Leap Year ReboundQ1’2024 Update: MYCI’s Leap Year Rebound
Q1’2024 Update: MYCI’s Leap Year Rebound
Oppotus
 
SOCRadar Germany 2024 Threat Landscape Report
SOCRadar Germany 2024 Threat Landscape ReportSOCRadar Germany 2024 Threat Landscape Report
SOCRadar Germany 2024 Threat Landscape Report
SOCRadar
 
一比一原版(UPenn毕业证)宾夕法尼亚大学毕业证成绩单
一比一原版(UPenn毕业证)宾夕法尼亚大学毕业证成绩单一比一原版(UPenn毕业证)宾夕法尼亚大学毕业证成绩单
一比一原版(UPenn毕业证)宾夕法尼亚大学毕业证成绩单
ewymefz
 
Criminal IP - Threat Hunting Webinar.pdf
Criminal IP - Threat Hunting Webinar.pdfCriminal IP - Threat Hunting Webinar.pdf
Criminal IP - Threat Hunting Webinar.pdf
Criminal IP
 
Predicting Product Ad Campaign Performance: A Data Analysis Project Presentation
Predicting Product Ad Campaign Performance: A Data Analysis Project PresentationPredicting Product Ad Campaign Performance: A Data Analysis Project Presentation
Predicting Product Ad Campaign Performance: A Data Analysis Project Presentation
Boston Institute of Analytics
 
Algorithmic optimizations for Dynamic Levelwise PageRank (from STICD) : SHORT...
Algorithmic optimizations for Dynamic Levelwise PageRank (from STICD) : SHORT...Algorithmic optimizations for Dynamic Levelwise PageRank (from STICD) : SHORT...
Algorithmic optimizations for Dynamic Levelwise PageRank (from STICD) : SHORT...
Subhajit Sahu
 
Sample_Global Non-invasive Prenatal Testing (NIPT) Market, 2019-2030.pdf
Sample_Global Non-invasive Prenatal Testing (NIPT) Market, 2019-2030.pdfSample_Global Non-invasive Prenatal Testing (NIPT) Market, 2019-2030.pdf
Sample_Global Non-invasive Prenatal Testing (NIPT) Market, 2019-2030.pdf
Linda486226
 
Ch03-Managing the Object-Oriented Information Systems Project a.pdf
Ch03-Managing the Object-Oriented Information Systems Project a.pdfCh03-Managing the Object-Oriented Information Systems Project a.pdf
Ch03-Managing the Object-Oriented Information Systems Project a.pdf
haila53
 
一比一原版(Adelaide毕业证书)阿德莱德大学毕业证如何办理
一比一原版(Adelaide毕业证书)阿德莱德大学毕业证如何办理一比一原版(Adelaide毕业证书)阿德莱德大学毕业证如何办理
一比一原版(Adelaide毕业证书)阿德莱德大学毕业证如何办理
slg6lamcq
 
Data Centers - Striving Within A Narrow Range - Research Report - MCG - May 2...
Data Centers - Striving Within A Narrow Range - Research Report - MCG - May 2...Data Centers - Striving Within A Narrow Range - Research Report - MCG - May 2...
Data Centers - Striving Within A Narrow Range - Research Report - MCG - May 2...
pchutichetpong
 
Best best suvichar in gujarati english meaning of this sentence as Silk road ...
Best best suvichar in gujarati english meaning of this sentence as Silk road ...Best best suvichar in gujarati english meaning of this sentence as Silk road ...
Best best suvichar in gujarati english meaning of this sentence as Silk road ...
AbhimanyuSinha9
 
一比一原版(RUG毕业证)格罗宁根大学毕业证成绩单
一比一原版(RUG毕业证)格罗宁根大学毕业证成绩单一比一原版(RUG毕业证)格罗宁根大学毕业证成绩单
一比一原版(RUG毕业证)格罗宁根大学毕业证成绩单
vcaxypu
 
一比一原版(Bradford毕业证书)布拉德福德大学毕业证如何办理
一比一原版(Bradford毕业证书)布拉德福德大学毕业证如何办理一比一原版(Bradford毕业证书)布拉德福德大学毕业证如何办理
一比一原版(Bradford毕业证书)布拉德福德大学毕业证如何办理
mbawufebxi
 
Levelwise PageRank with Loop-Based Dead End Handling Strategy : SHORT REPORT ...
Levelwise PageRank with Loop-Based Dead End Handling Strategy : SHORT REPORT ...Levelwise PageRank with Loop-Based Dead End Handling Strategy : SHORT REPORT ...
Levelwise PageRank with Loop-Based Dead End Handling Strategy : SHORT REPORT ...
Subhajit Sahu
 
一比一原版(UVic毕业证)维多利亚大学毕业证成绩单
一比一原版(UVic毕业证)维多利亚大学毕业证成绩单一比一原版(UVic毕业证)维多利亚大学毕业证成绩单
一比一原版(UVic毕业证)维多利亚大学毕业证成绩单
ukgaet
 

Recently uploaded (20)

一比一原版(BU毕业证)波士顿大学毕业证成绩单
一比一原版(BU毕业证)波士顿大学毕业证成绩单一比一原版(BU毕业证)波士顿大学毕业证成绩单
一比一原版(BU毕业证)波士顿大学毕业证成绩单
 
Opendatabay - Open Data Marketplace.pptx
Opendatabay - Open Data Marketplace.pptxOpendatabay - Open Data Marketplace.pptx
Opendatabay - Open Data Marketplace.pptx
 
Adjusting primitives for graph : SHORT REPORT / NOTES
Adjusting primitives for graph : SHORT REPORT / NOTESAdjusting primitives for graph : SHORT REPORT / NOTES
Adjusting primitives for graph : SHORT REPORT / NOTES
 
一比一原版(UMich毕业证)密歇根大学|安娜堡分校毕业证成绩单
一比一原版(UMich毕业证)密歇根大学|安娜堡分校毕业证成绩单一比一原版(UMich毕业证)密歇根大学|安娜堡分校毕业证成绩单
一比一原版(UMich毕业证)密歇根大学|安娜堡分校毕业证成绩单
 
一比一原版(TWU毕业证)西三一大学毕业证成绩单
一比一原版(TWU毕业证)西三一大学毕业证成绩单一比一原版(TWU毕业证)西三一大学毕业证成绩单
一比一原版(TWU毕业证)西三一大学毕业证成绩单
 
Q1’2024 Update: MYCI’s Leap Year Rebound
Q1’2024 Update: MYCI’s Leap Year ReboundQ1’2024 Update: MYCI’s Leap Year Rebound
Q1’2024 Update: MYCI’s Leap Year Rebound
 
SOCRadar Germany 2024 Threat Landscape Report
SOCRadar Germany 2024 Threat Landscape ReportSOCRadar Germany 2024 Threat Landscape Report
SOCRadar Germany 2024 Threat Landscape Report
 
一比一原版(UPenn毕业证)宾夕法尼亚大学毕业证成绩单
一比一原版(UPenn毕业证)宾夕法尼亚大学毕业证成绩单一比一原版(UPenn毕业证)宾夕法尼亚大学毕业证成绩单
一比一原版(UPenn毕业证)宾夕法尼亚大学毕业证成绩单
 
Criminal IP - Threat Hunting Webinar.pdf
Criminal IP - Threat Hunting Webinar.pdfCriminal IP - Threat Hunting Webinar.pdf
Criminal IP - Threat Hunting Webinar.pdf
 
Predicting Product Ad Campaign Performance: A Data Analysis Project Presentation
Predicting Product Ad Campaign Performance: A Data Analysis Project PresentationPredicting Product Ad Campaign Performance: A Data Analysis Project Presentation
Predicting Product Ad Campaign Performance: A Data Analysis Project Presentation
 
Algorithmic optimizations for Dynamic Levelwise PageRank (from STICD) : SHORT...
Algorithmic optimizations for Dynamic Levelwise PageRank (from STICD) : SHORT...Algorithmic optimizations for Dynamic Levelwise PageRank (from STICD) : SHORT...
Algorithmic optimizations for Dynamic Levelwise PageRank (from STICD) : SHORT...
 
Sample_Global Non-invasive Prenatal Testing (NIPT) Market, 2019-2030.pdf
Sample_Global Non-invasive Prenatal Testing (NIPT) Market, 2019-2030.pdfSample_Global Non-invasive Prenatal Testing (NIPT) Market, 2019-2030.pdf
Sample_Global Non-invasive Prenatal Testing (NIPT) Market, 2019-2030.pdf
 
Ch03-Managing the Object-Oriented Information Systems Project a.pdf
Ch03-Managing the Object-Oriented Information Systems Project a.pdfCh03-Managing the Object-Oriented Information Systems Project a.pdf
Ch03-Managing the Object-Oriented Information Systems Project a.pdf
 
一比一原版(Adelaide毕业证书)阿德莱德大学毕业证如何办理
一比一原版(Adelaide毕业证书)阿德莱德大学毕业证如何办理一比一原版(Adelaide毕业证书)阿德莱德大学毕业证如何办理
一比一原版(Adelaide毕业证书)阿德莱德大学毕业证如何办理
 
Data Centers - Striving Within A Narrow Range - Research Report - MCG - May 2...
Data Centers - Striving Within A Narrow Range - Research Report - MCG - May 2...Data Centers - Striving Within A Narrow Range - Research Report - MCG - May 2...
Data Centers - Striving Within A Narrow Range - Research Report - MCG - May 2...
 
Best best suvichar in gujarati english meaning of this sentence as Silk road ...
Best best suvichar in gujarati english meaning of this sentence as Silk road ...Best best suvichar in gujarati english meaning of this sentence as Silk road ...
Best best suvichar in gujarati english meaning of this sentence as Silk road ...
 
一比一原版(RUG毕业证)格罗宁根大学毕业证成绩单
一比一原版(RUG毕业证)格罗宁根大学毕业证成绩单一比一原版(RUG毕业证)格罗宁根大学毕业证成绩单
一比一原版(RUG毕业证)格罗宁根大学毕业证成绩单
 
一比一原版(Bradford毕业证书)布拉德福德大学毕业证如何办理
一比一原版(Bradford毕业证书)布拉德福德大学毕业证如何办理一比一原版(Bradford毕业证书)布拉德福德大学毕业证如何办理
一比一原版(Bradford毕业证书)布拉德福德大学毕业证如何办理
 
Levelwise PageRank with Loop-Based Dead End Handling Strategy : SHORT REPORT ...
Levelwise PageRank with Loop-Based Dead End Handling Strategy : SHORT REPORT ...Levelwise PageRank with Loop-Based Dead End Handling Strategy : SHORT REPORT ...
Levelwise PageRank with Loop-Based Dead End Handling Strategy : SHORT REPORT ...
 
一比一原版(UVic毕业证)维多利亚大学毕业证成绩单
一比一原版(UVic毕业证)维多利亚大学毕业证成绩单一比一原版(UVic毕业证)维多利亚大学毕业证成绩单
一比一原版(UVic毕业证)维多利亚大学毕业证成绩单
 

Data handling

  • 1. INDEX What is data handling? The types of graphs Bar graph The axis Pie chart Water fall graph Line graph Area graph Pictograph Tally chart By Rayna Rocha VI J
  • 2.  Data handling is the process of ensuring that research data is stored, archived or disposed off in a safe and secure manner during and after the conclusion of a research project. This includes the development of policies and procedures to manage data handled electronically as well as through non-electronic means .
  • 3.  There are eight main graphs. Their names are  Bar graphs  Pie charts  Tally charts  Area graphs
  • 4.  Pictographs  Water fall graphs  Line graphs  Polar graphs
  • 5.  This is a type of chart, which contains labelled horizontal or vertical bars showing a piece of information and an axis. The numbers along the side of bar graph compose the axis. This is also called as a histogram; Bar Graph is useful when there is a numerical comparison.
  • 6.  There are two types of axis present in a bar graph. The line which is horizontal is known as the X Axis. The line which is vertical is known as the Y Axis.
  • 7.  A pie chart is divided into sectors, illustrating numerical proportion. In a pie chart, the arc length of each sector, is proportional to the quantity it represents.
  • 8.  A waterfall chart is a form of data visualisation that helps in understanding the cumulative effect of sequentially introduced positive or negative values. The waterfall chart is also known as a flying bricks chart or Mario chart due to the apparent suspension of columns (bricks) in mid-air. Often in finance, it will be referred to as a bridge.
  • 9.  A line chart or line graph is a type of chart which displays information as a series of data points called 'markers' connected by straight line segments. It is a basic type of chart common in many fields.
  • 10.  An area chart or area graph displays graphically quantitive data. It is based on the line chart. The area between axis and line are commonly emphasized with colours, textures and hatchings. Commonly one compares with an area chart two or more quantities.
  • 11.  A picture that visually helps us to understand data is called a pictograph. A pictograph represents data in the form of pictures, objects or parts of objects.
  • 12.  This chart is not used with numbers but instead of lines. We can make five a time. Like this-