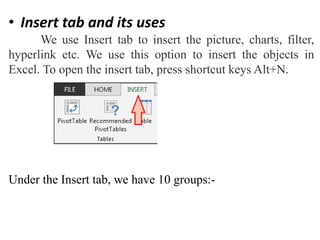
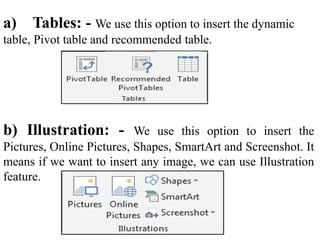
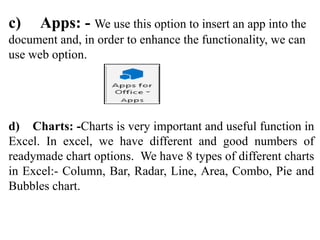
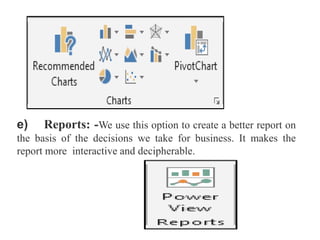
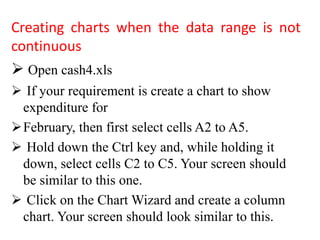
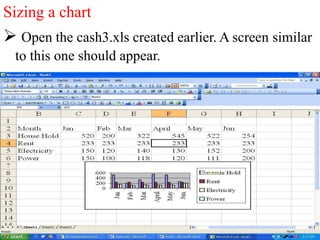
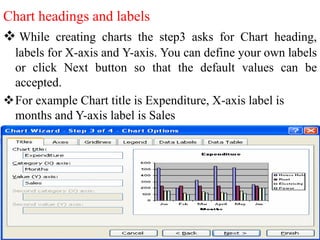
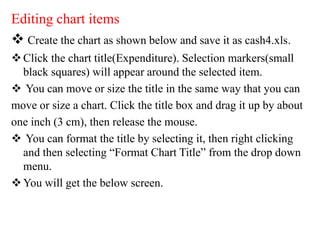
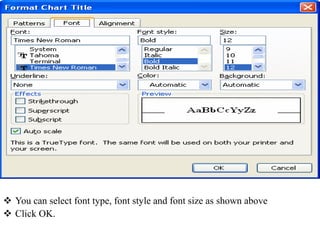
The document discusses various features and functions of the Insert tab in Microsoft Excel, including how to insert tables, illustrations, charts, reports, and other objects. It provides details on different types of charts like column, bar, and line charts that can be created in Excel and how to modify chart properties. The document also summarizes steps for creating, editing, moving, deleting, and formatting charts in Excel worksheets.
Types of charts in Excel and How to use themVijay Perepa
There are different Chart types and some times we face difficulty to find which chart is suitable for a specific Data set. In this series of Videos, we have discussed about each chart type and when to use etc.
Types of charts in Excel and How to use themVijay Perepa
There are different Chart types and some times we face difficulty to find which chart is suitable for a specific Data set. In this series of Videos, we have discussed about each chart type and when to use etc.
Curious about the different types of chart? This presentation demonstrates the variety of charts and their purpose. All these charts have been created using Chartblocks online chart building tool.
this ppt is about charts in ms excel.there are many types of chart used in ms excel but in this ppt some common types are defined,as line chart,bar,column,area ,scatter chart etc...
$5 COUPON LINK - Excel Udemy Course: Excel with Excel Dynamic Graphs, Dashboa...mellontraining
Learn everything about Charts with Excel 2013
Create Interactive Advanced Excel Charts, Pivot Charts and Dashboards - with Microsoft Excel 2013 + Free Excel Templates
******************************************************************************************************
GET THE COURSE FOR $5 WITH THE COUPON LINK:
https://www.udemy.com/excel-charts-learn-everything-about-charts-with-excel-2013/?couponCode=STUDENT5
Top 8 Different Types Of Charts In Statistics And Their UsesStat Analytica
Are you confused about various Types Of Charts In Statistics? In this blog, you will get to learn about the various Types Of Charts In Statistics in detail.
The Roman Empire A Historical Colossus.pdfkaushalkr1407
The Roman Empire, a vast and enduring power, stands as one of history's most remarkable civilizations, leaving an indelible imprint on the world. It emerged from the Roman Republic, transitioning into an imperial powerhouse under the leadership of Augustus Caesar in 27 BCE. This transformation marked the beginning of an era defined by unprecedented territorial expansion, architectural marvels, and profound cultural influence.
The empire's roots lie in the city of Rome, founded, according to legend, by Romulus in 753 BCE. Over centuries, Rome evolved from a small settlement to a formidable republic, characterized by a complex political system with elected officials and checks on power. However, internal strife, class conflicts, and military ambitions paved the way for the end of the Republic. Julius Caesar’s dictatorship and subsequent assassination in 44 BCE created a power vacuum, leading to a civil war. Octavian, later Augustus, emerged victorious, heralding the Roman Empire’s birth.
Under Augustus, the empire experienced the Pax Romana, a 200-year period of relative peace and stability. Augustus reformed the military, established efficient administrative systems, and initiated grand construction projects. The empire's borders expanded, encompassing territories from Britain to Egypt and from Spain to the Euphrates. Roman legions, renowned for their discipline and engineering prowess, secured and maintained these vast territories, building roads, fortifications, and cities that facilitated control and integration.
The Roman Empire’s society was hierarchical, with a rigid class system. At the top were the patricians, wealthy elites who held significant political power. Below them were the plebeians, free citizens with limited political influence, and the vast numbers of slaves who formed the backbone of the economy. The family unit was central, governed by the paterfamilias, the male head who held absolute authority.
Culturally, the Romans were eclectic, absorbing and adapting elements from the civilizations they encountered, particularly the Greeks. Roman art, literature, and philosophy reflected this synthesis, creating a rich cultural tapestry. Latin, the Roman language, became the lingua franca of the Western world, influencing numerous modern languages.
Roman architecture and engineering achievements were monumental. They perfected the arch, vault, and dome, constructing enduring structures like the Colosseum, Pantheon, and aqueducts. These engineering marvels not only showcased Roman ingenuity but also served practical purposes, from public entertainment to water supply.
Instructions for Submissions thorugh G- Classroom.pptxJheel Barad
This presentation provides a briefing on how to upload submissions and documents in Google Classroom. It was prepared as part of an orientation for new Sainik School in-service teacher trainees. As a training officer, my goal is to ensure that you are comfortable and proficient with this essential tool for managing assignments and fostering student engagement.
Operation “Blue Star” is the only event in the history of Independent India where the state went into war with its own people. Even after about 40 years it is not clear if it was culmination of states anger over people of the region, a political game of power or start of dictatorial chapter in the democratic setup.
The people of Punjab felt alienated from main stream due to denial of their just demands during a long democratic struggle since independence. As it happen all over the word, it led to militant struggle with great loss of lives of military, police and civilian personnel. Killing of Indira Gandhi and massacre of innocent Sikhs in Delhi and other India cities was also associated with this movement.
Francesca Gottschalk - How can education support child empowerment.pptxEduSkills OECD
Francesca Gottschalk from the OECD’s Centre for Educational Research and Innovation presents at the Ask an Expert Webinar: How can education support child empowerment?
Macroeconomics- Movie Location
This will be used as part of your Personal Professional Portfolio once graded.
Objective:
Prepare a presentation or a paper using research, basic comparative analysis, data organization and application of economic information. You will make an informed assessment of an economic climate outside of the United States to accomplish an entertainment industry objective.
Acetabularia Information For Class 9 .docxvaibhavrinwa19
Acetabularia acetabulum is a single-celled green alga that in its vegetative state is morphologically differentiated into a basal rhizoid and an axially elongated stalk, which bears whorls of branching hairs. The single diploid nucleus resides in the rhizoid.
2. • Insert tab and its uses
We use Insert tab to insert the picture, charts, filter,
hyperlink etc. We use this option to insert the objects in
Excel. To open the insert tab, press shortcut keys Alt+N.
Under the Insert tab, we have 10 groups:-
3. a) Tables: - We use this option to insert the dynamic
table, Pivot table and recommended table.
b) Illustration: - We use this option to insert the
Pictures, Online Pictures, Shapes, SmartArt and Screenshot. It
means if we want to insert any image, we can use Illustration
feature.
4. c) Apps: - We use this option to insert an app into the
document and, in order to enhance the functionality, we can
use web option.
d) Charts: -Charts is very important and useful function in
Excel. In excel, we have different and good numbers of
readymade chart options. We have 8 types of different charts
in Excel:- Column, Bar, Radar, Line, Area, Combo, Pie and
Bubbles chart.
5. e) Reports: -We use this option to create a better report on
the basis of the decisions we take for business. It makes the
report more interactive and decipherable.
6. f) Sparklines: Sparkline is a very tricky and useful
option added by Microsoft Excel. On the basis of a range, it
can visualize the trends in a single cell as charts. We have 3
different types of cell charts:- Line, Column and Win/Loss
chart.
g) Filters:
7. Column chart
A column chart is made up of vertical bars
that is used to compare values over time or two
compare values in different categories.
Bar chart
A bar chart is made up of horizontal bars that
is used to compare values in different categories.
Line chart
Line chart are useful when you want to show
a trend over the years (or other time periods
such as weeks, months, or quarters).
8. Change in Charts Group
The Charts Group on the Ribbon in MS Excel 2013 looks as follows:
You can observe that:
The subgroups are clubbed together.
A new option ‘Recommended Charts’ is added.
Let us create a chart. Follow the steps given below.
Step 1: Select the data for which you want to create a chart.
Step 2: Click on the Insert Column Chart icon as shown below.
10. Ribbon in MS-Excel
The ribbon in Excel consists of the tabs at
the top. These tabs are split into groups
which categorize related command buttons
into sub tasks.
Each group has its respective command
button and the dialog box launcher, which
are present in the lower right corner in some
of the groups.
11. Ribbon of Chart Tools
When you click on your Chart, the CHART TOOLS tab, comprising of the DESIGN
and FORMAT tabs is introduced on the ribbon.
Step 1: Click on the Chart. CHART TOOLS with the DESIGN and FORMAT tabs will be
displayed on the ribbon.
12.
13. Creating charts and graphs
Open cash.xls spreadsheet.
Select the cells A1 to G5 as shown below
Click on Insert menu and click Chart option. This will start the
Office Assistant, to guide you through creating chart.
Follow the instructions in each step of the Wizard. The Assistant
explains each step.
At step 3, you can specify the Chart title, X-axis title and Yaxis
title separately.
At step 4, click As object in sheet 1, then click Finish.
Your chart is now finished. Save as cash4. Your chart is saved
with the spreadsheet. This type of chart is known as an
embedded chart and is saved with its worksheet.
14. Creating charts when the data range is not
continuous
Open cash4.xls
If your requirement is create a chart to show
expenditure for
February, then first select cells A2 to A5.
Hold down the Ctrl key and, while holding it
down, select cells C2 to C5. Your screen should
be similar to this one.
Click on the Chart Wizard and create a column
chart. Your screen should look similar to this.
15. Sizing a chart
Open the cash3.xls created earlier. A screen similar
to this one should appear.
16. The small black markers at each corner and mid-way along
each side of the chart. These indicate that the chart is selected,
and are called its selection squares.
Click on the mid-point marker on the right-hand side, hold
down the left mouse button and drag the mouse to the right
about one inch(3cm), then release the mouse. The width of
the chart will have increased.
Now practice the same operation on the mid-point marker of
each of the other sides of the chart.
Now try the above, but this time on one of the four corner
markers. Note that when you use these techniques, the whole
chart changes in size, but it retains its original proportions.
Now use the same technique to reduce the size of the chart.
17. Deleting Charts
Make sure the chart is selected(the small black
markers are visible). If not, move the mouse pointer into
the chart area and click and release the left mouse
button once.
Press Delete to delete the chart.
Moving charts and graphs
Make the chart active.
Move the mouse pointer into the chart area.
Hold down the left mouse button and drag the chart to
the desired position.
18. Chart headings and labels
While creating charts the step3 asks for Chart heading,
labels for X-axis and Y-axis. You can define your own labels
or click Next button so that the default values can be
accepted.
For example Chart title is Expenditure, X-axis label is
months and Y-axis label is Sales
19. Editing chart items
Create the chart as shown below and save it as cash4.xls.
Click the chart title(Expenditure). Selection markers(small
black squares) will appear around the selected item.
You can move or size the title in the same way that you can
move or size a chart. Click the title box and drag it up by about
one inch (3 cm), then release the mouse.
You can format the title by selecting it, then right clicking
and then selecting “Format Chart Title” from the drop down
menu.
You will get the below screen.
20. You can select font type, font style and font size as shown above
Click OK.
21. References
R.K.Taxali., “PC Software For Windows Made
Simple”.,MCG Raw – Hill Publicating Company LTD, New
Delhi.
Sanjay Saxena, “MS –Office 2000”,Vikas Publishing House
Private Ltd,New Delhi.
Robert De Levie, “Advanced Excel for Scientific Data
Analysis”, 3rd Edition Wiley Publishing, Cananda.