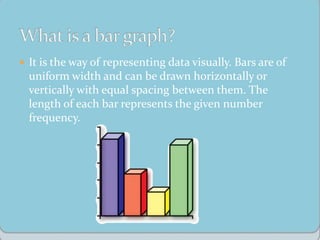
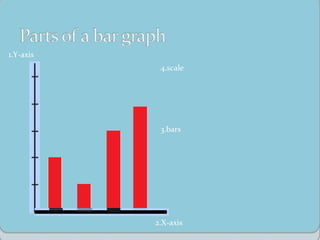
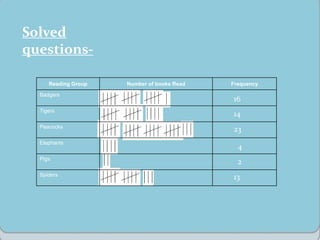
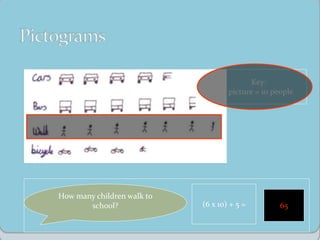
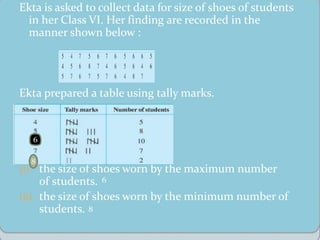
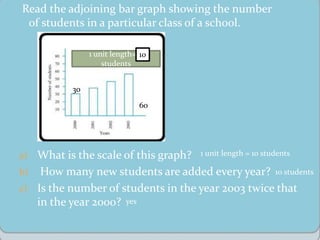
This document discusses different methods of data handling and visualization including bar graphs, pictographs, and tally marks. It provides examples and explanations of key elements of bar graphs including the x-axis, y-axis, bars, and scale. Pictographs are defined as using pictures or symbols to represent and compare data. Tally marks are introduced as a method of counting frequencies according to classification with diagonal lines representing groups of five. Examples of each method are shown.