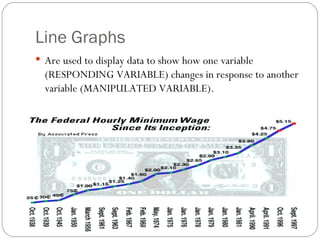
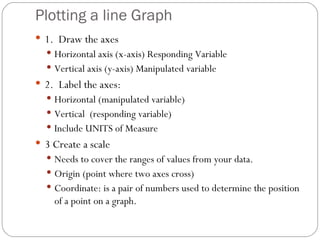
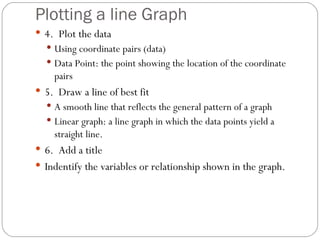
This document discusses line graphs and how to construct them. It explains that line graphs are used to show how one variable changes in response to another variable. It provides steps for plotting a line graph, including labeling the axes, scaling the axes appropriately, plotting the data points, drawing a line of best fit, and adding a title. It also defines key terms like slope, linear and nonlinear graphs, and trends in data.