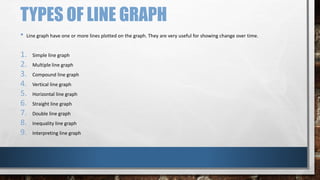
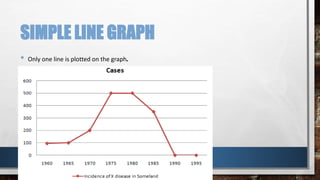
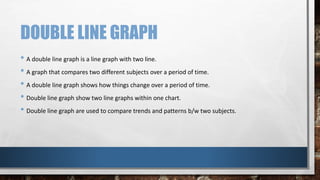
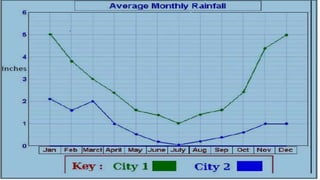
A line graph is a diagram that illustrates the relationship between two variables over time, with an independent variable typically on the x-axis and a dependent variable on the y-axis. The document outlines key components of line graphs, including titles, scales, labels, and types, as well as step-by-step instructions for creating one. Various types of line graphs such as simple, multiple, compound, vertical, and horizontal are discussed, emphasizing their usefulness in displaying data trends.
LINE GRAPH
• Aline graph is a diagram that shows a line joining several points, or a line that shows the
relationship between the points.
• A line graph can be taken as x-y plane, where there will be an independent variable and a
dependent variable and it specifies how the two variables are related to each other and vary
with respect to one another.
• Mostly, the independent variable is taken on the x-axis while the dependent variable on the y-
axis.
4.
PARTS OF LINEGRAPH
Various parts of the line graph:
1. Title: the title is explains what the graph is about.
2. Scale: the scale is the numbers that show the units used on the line graph.
3. Labels: both the side and the bottom of the line graph have a label that tells what kind of data
is shown. X-axis describe what each data point on the line represents and y-axis shows the
numeric value for each point on the line.
4. Line: Connect all data points.
5. Point: Represent the data amount.
6.
MAKE A LINEGRAPH
Steps to make a line graph:
Step 1: use the data from the table to choose an appropriate scale.
Step 2: draw and label the scale on the vertical and horizontal axis.
Step 3: list the each item and locate the points on the graph.
Step 4: connect the points with line segments
7.
EXAMPLE OF LINEGRAPH
Question: the table given below shows the weights of a set of people .
Draw a line graph for the given data.
Months Weights (in Kg)
1 38
3 41
5 43
7 49
9 51
11 54
8.
SOLUTION
• The dataas per given in the table above has been summarized in the form of a line graph below.
9.
EXAMPLE#2
The table showsthe daily earnings of a store for five days.
Construct a line graph for the frequency table.
DAYS EARNINGS
Monday 300
Tuesday 450
Wednesday 200
Thursday 400
Friday 650
EXAMPLE#3
The table showsthe daily sales in RM of different categories of items for five days.
Construct a line graph for the frequency table.
Day Drinks Food
Monday 300 400
Tuesday 450 500
Wednesday 150 350
Thursday 400 300
Friday 650 500
TYPES OF LINEGRAPH
• Line graph have one or more lines plotted on the graph. They are very useful for showing change over time.
1. Simple line graph
2. Multiple line graph
3. Compound line graph
4. Vertical line graph
5. Horizontal line graph
6. Straight line graph
7. Double line graph
8. Inequality line graph
9. Interpreting line graph
MULTIPLE LINE GRAPH
•More than one line is plotted on the same set of axis. A multiple line graph can effectively
compare similar items over the same period of time.
16.
COMPOUND LINE CHART
•If information can be subdivided into two or more types of data. This type of line graph is called a compound line graph.
Lines are drawn to show the component part of a total. The top line shows the total and line below shows part of the
total. The distance between each two lines shows the size of each part.
17.
VERTICAL LINE GRAPH
•Vertical line graphs are graphs in which a vertical line extends from each data point down to the
horizontal axis. Vertical line graph sometime also called as column graph. A line parallel to the y-
axis is called a vertical line.
18.
HORIZONTAL LINE GRAPH
•Horizontal line graphs are graphs in which a horizontal line extends from each data point parallel
to the earth. Horizontal line graph sometime also called as row graph. A line parallel to the x-axis
is called a vertical line.
19.
DOUBLE LINE GRAPH
•A double line graph is a line graph with two line.
• A graph that compares two different subjects over a period of time.
• A double line graph shows how things change over a period of time.
• Double line graph show two line graphs within one chart.
• Double line graph are used to compare trends and patterns b/w two subjects.