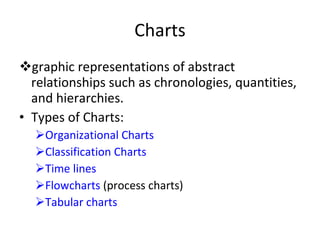
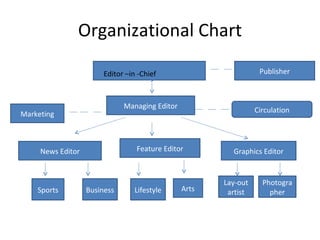
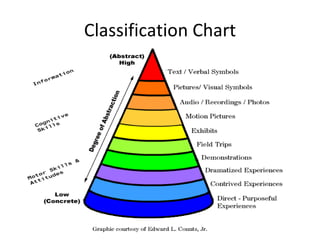
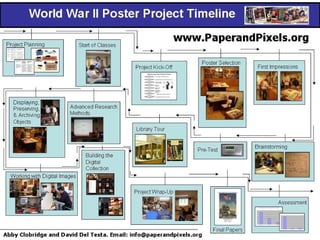
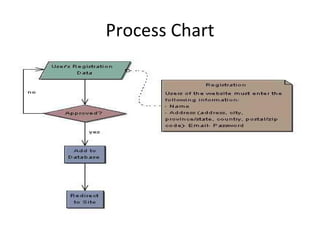
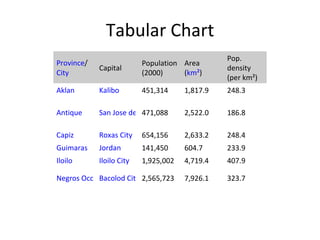
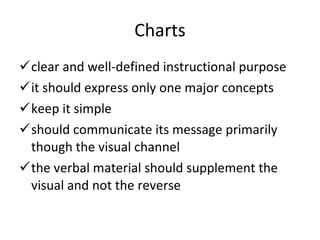
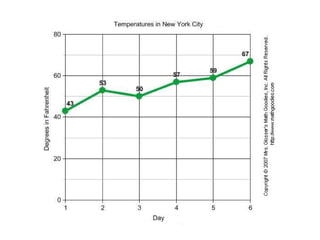
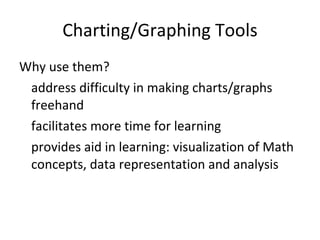
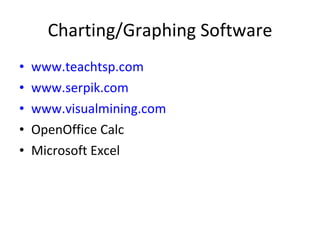
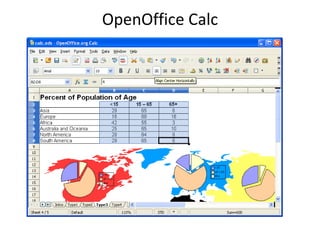
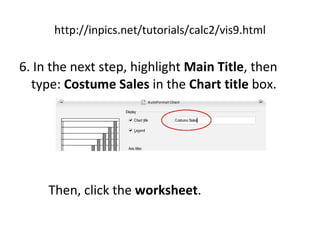
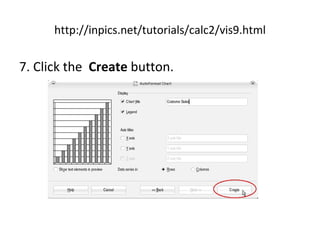
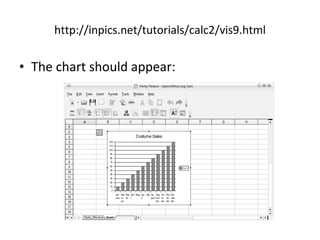
Charts and Graphs
Charts graphic representations of abstract relationships such as chronologies, quantities, and hierarchies. Types of Charts: Organizational Charts  Classification Charts Time lines Flowcharts  (process charts) Tabular charts
Organizational Chart Editor –in -Chief Managing Editor Publisher News Editor Feature Editor Graphics Editor Sports Business Lifestyle Lay-out artist Photographer Arts Marketing Circulation
Classification Chart
 
Process Chart
Tabular Chart Province / City Capital Population (2000) Area ( kmÂČ ) Pop. density (per kmÂČ) Aklan Kalibo 451,314 1,817.9 248.3 Antique San Jose de Buenavista 471,088 2,522.0 186.8 Capiz Roxas City 654,156 2,633.2 248.4 Guimaras Jordan 141,450 604.7 233.9 Iloilo Iloilo City 1,925,002 4,719.4 407.9 Negros Occidental Bacolod City 2,565,723 7,926.1 323.7
Charts clear and well-defined instructional purpose it should express only one major concepts keep it simple should communicate its message primarily though the visual channel the verbal material should supplement the visual and not the reverse
Graphs provide a visual representation of numerical data.  illustrate relationships between units of the data and trends in the data easier data interpretation more visually interesting
Graphs Four major types of graphs:  bar pictorial circle (pie) line The type you choose to use will largely depend on the complexity of your audience.


Charting/Graphing Tools Why use them? address difficulty in making charts/graphs freehand facilitates more time for learning provides aid in learning: visualization of Math concepts, data representation and analysis
Charting/Graphing Software www.teachtsp.com www.serpik.com www.visualmining.com OpenOffice Calc Microsoft Excel
OpenOffice Calc
http://inpics.net/tutorials/calc2/vis9.html Create charts In the  Sales  worksheet, highlight cells  A3  through  L4 .
http://inpics.net/tutorials/calc2/vis9.html 2. On the Toolbar, click  create a graph icon. Then, click the worksheet .
http://inpics.net/tutorials/calc2/vis9.html 3. When the  Auto Format Chart  window appears, click  -new sheet-  in the  Chart results in worksheet  dropdown list. 4. Click the  next  button.
5. Make sure the  Rows  radio button is checked. Click the  next  button twice.
http://inpics.net/tutorials/calc2/vis9.html 6. In the next step, highlight  Main Title , then type:  Costume Sales  in the  Chart title  box.  Then, click the  worksheet .
http://inpics.net/tutorials/calc2/vis9.html 7. Click the  Create  button.
http://inpics.net/tutorials/calc2/vis9.html The chart should appear:
Font Collection Illustration Decoration Flyers Books Letters Notices
Tips on Using Font Be consistent: Arial, Times New Roman Avoid using fancy font styles Contrast font color with background Visible font size ALL CAPS = SCREAMING FONT
Legibility San-serif Font Fonts with Serif Script fonts ‘ Crazy’ font Old English font
SCREAMING CAPS IT IS OFTEN LAMENTED THAT TEACHERS RELY TOO MUCH ON WORDS AS COMMUNICATION VEHICLES. It is often lamented that teachers rely too much on words as communication vehicles.
Spacing  between lines Too close T  o  o  F  a  r Just right
References Heinich, R., Molenda, M., Russel, J. & Smaldino, S. (1999). Instructional media and technologies for learning, 6 th  ed. NJ: Prentice Hall, Inc. Roblyer, M.D. (2006). Integrating technology into teaching. 4 th  ed. NJ: Merrill Prentice Hall. Williams, M.D. (2000). Integrating technology into teaching and learning: Concepts and applications. Singapore: Prentice Hall.
Activity Go to  http://www.onlinecharttool.com/  or  http://chartpart.com/ Create a chart on any topic/data. Label your chart.  Write 3-5 sentence paragraph that supplements the chart you created.

Charts and graphs

  • 1.
  • 2.
    Charts graphic representationsof abstract relationships such as chronologies, quantities, and hierarchies. Types of Charts: Organizational Charts Classification Charts Time lines Flowcharts (process charts) Tabular charts
  • 3.
    Organizational Chart Editor–in -Chief Managing Editor Publisher News Editor Feature Editor Graphics Editor Sports Business Lifestyle Lay-out artist Photographer Arts Marketing Circulation
  • 4.
  • 5.
  • 6.
  • 7.
    Tabular Chart Province/ City Capital Population (2000) Area ( kmÂČ ) Pop. density (per kmÂČ) Aklan Kalibo 451,314 1,817.9 248.3 Antique San Jose de Buenavista 471,088 2,522.0 186.8 Capiz Roxas City 654,156 2,633.2 248.4 Guimaras Jordan 141,450 604.7 233.9 Iloilo Iloilo City 1,925,002 4,719.4 407.9 Negros Occidental Bacolod City 2,565,723 7,926.1 323.7
  • 8.
    Charts clear andwell-defined instructional purpose it should express only one major concepts keep it simple should communicate its message primarily though the visual channel the verbal material should supplement the visual and not the reverse
  • 9.
    Graphs provide avisual representation of numerical data. illustrate relationships between units of the data and trends in the data easier data interpretation more visually interesting
  • 10.
    Graphs Four majortypes of graphs: bar pictorial circle (pie) line The type you choose to use will largely depend on the complexity of your audience.
  • 11.
  • 12.
  • 13.
  • 14.
  • 15.
    Charting/Graphing Tools Whyuse them? address difficulty in making charts/graphs freehand facilitates more time for learning provides aid in learning: visualization of Math concepts, data representation and analysis
  • 16.
    Charting/Graphing Software www.teachtsp.comwww.serpik.com www.visualmining.com OpenOffice Calc Microsoft Excel
  • 17.
  • 18.
    http://inpics.net/tutorials/calc2/vis9.html Create chartsIn the Sales worksheet, highlight cells A3 through L4 .
  • 19.
    http://inpics.net/tutorials/calc2/vis9.html 2. Onthe Toolbar, click create a graph icon. Then, click the worksheet .
  • 20.
    http://inpics.net/tutorials/calc2/vis9.html 3. Whenthe Auto Format Chart window appears, click -new sheet- in the Chart results in worksheet dropdown list. 4. Click the next button.
  • 21.
    5. Make surethe Rows radio button is checked. Click the next button twice.
  • 22.
    http://inpics.net/tutorials/calc2/vis9.html 6. Inthe next step, highlight Main Title , then type: Costume Sales in the Chart title box. Then, click the worksheet .
  • 23.
  • 24.
  • 25.
    Font Collection IllustrationDecoration Flyers Books Letters Notices
  • 26.
    Tips on UsingFont Be consistent: Arial, Times New Roman Avoid using fancy font styles Contrast font color with background Visible font size ALL CAPS = SCREAMING FONT
  • 27.
    Legibility San-serif FontFonts with Serif Script fonts ‘ Crazy’ font Old English font
  • 28.
    SCREAMING CAPS ITIS OFTEN LAMENTED THAT TEACHERS RELY TOO MUCH ON WORDS AS COMMUNICATION VEHICLES. It is often lamented that teachers rely too much on words as communication vehicles.
  • 29.
    Spacing betweenlines Too close T o o F a r Just right
  • 30.
    References Heinich, R.,Molenda, M., Russel, J. & Smaldino, S. (1999). Instructional media and technologies for learning, 6 th ed. NJ: Prentice Hall, Inc. Roblyer, M.D. (2006). Integrating technology into teaching. 4 th ed. NJ: Merrill Prentice Hall. Williams, M.D. (2000). Integrating technology into teaching and learning: Concepts and applications. Singapore: Prentice Hall.
  • 31.
    Activity Go to http://www.onlinecharttool.com/ or http://chartpart.com/ Create a chart on any topic/data. Label your chart. Write 3-5 sentence paragraph that supplements the chart you created.