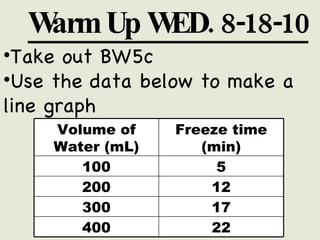
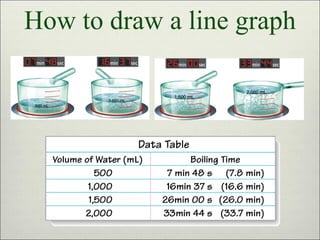
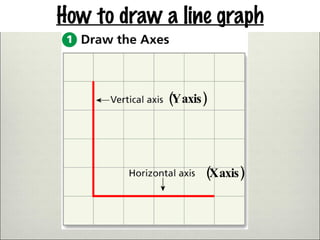
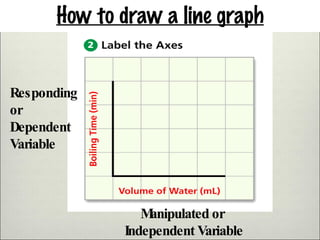
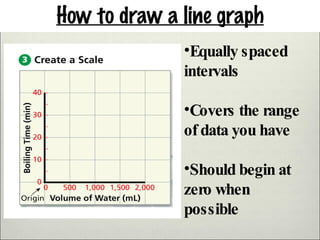
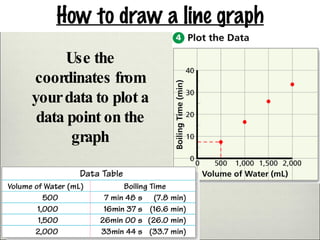
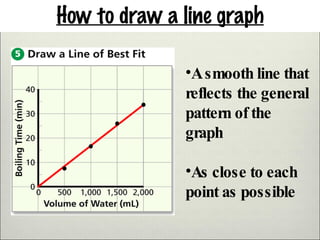
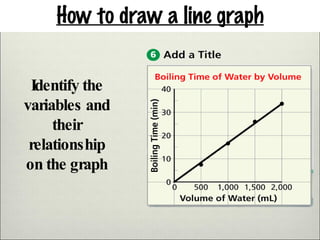
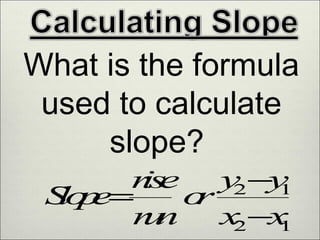
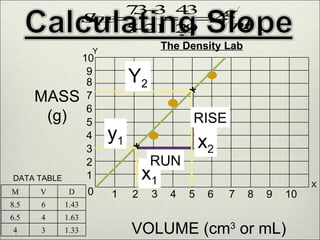
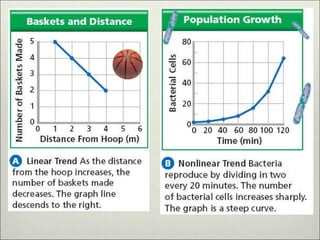
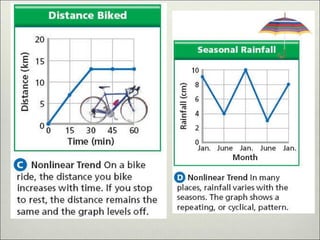
SlideShare a Scribd company logo
Line graphs, slope, and interpreting line graphs Charalee Pera Incorporating Technology into the Classroom Wednesday September 29   2010
Standards ,[object Object],[object Object]
Warm Up WED. 8-18-10 ,[object Object],[object Object],Volume of Water (mL) Freeze time (min) 100 5 200 12 300 17 400 22
How to draw a line graph
How to draw a line graph (Y axis) (X axis)
How to draw a line graph Manipulated or Independent Variable Responding or  Dependent Variable
How to draw a line graph ,[object Object],[object Object],[object Object]
How to draw a line graph Use the coordinates from your data to plot a data point on the graph
How to draw a line graph ,[object Object],[object Object]
How to draw a line graph Identify the variables and their relationship on the graph
What is the formula used to calculate slope?
MASS (g) VOLUME (cm 3  or mL) X Y The Density Lab DATA TABLE * * Y 2 y 1 x 2 x 1 RISE RUN 0 1 2 3 4 5 6 7 8 9 10 1 10 9 8 7 6 5 4 3 2 M V D 8.5 6 1.43 6.5 4 1.63 4 3 1.33
 
 
References  ,[object Object],[object Object]

More Related Content

What's hot

Mean, median, mode, & range ppt
Mean, median, mode, & range pptMean, median, mode, & range ppt
Mean, median, mode, & range ppt
mashal2013
 
Proving Triangles Congruent Sss, Sas Asa
Proving Triangles Congruent Sss, Sas AsaProving Triangles Congruent Sss, Sas Asa
Proving Triangles Congruent Sss, Sas Asa
guestd1dc2e
 
Polygons presentation
Polygons presentationPolygons presentation
Polygons presentation
Jessica
 
Triangle-Congruence-Postulate-Day-4.pptx
Triangle-Congruence-Postulate-Day-4.pptxTriangle-Congruence-Postulate-Day-4.pptx
Triangle-Congruence-Postulate-Day-4.pptx
mikeebio1
 
Stem and-leaf plots
Stem and-leaf plotsStem and-leaf plots
Stem and-leaf plots
ValPatton
 
Estimating square roots
Estimating square rootsEstimating square roots
Estimating square roots
mstf mstf
 

What's hot (20)

Scatter diagrams and correlation
Scatter diagrams and correlationScatter diagrams and correlation
Scatter diagrams and correlation
 
Mean, median, mode, & range ppt
Mean, median, mode, & range pptMean, median, mode, & range ppt
Mean, median, mode, & range ppt
 
The Coordinate Plane (Geometry 2_4)
The Coordinate Plane (Geometry 2_4)The Coordinate Plane (Geometry 2_4)
The Coordinate Plane (Geometry 2_4)
 
Quadrilaterals
QuadrilateralsQuadrilaterals
Quadrilaterals
 
Parallelism and perpendicularity
Parallelism and perpendicularityParallelism and perpendicularity
Parallelism and perpendicularity
 
Chapter 5 Direct Variation
Chapter 5 Direct VariationChapter 5 Direct Variation
Chapter 5 Direct Variation
 
Proving Triangles Congruent Sss, Sas Asa
Proving Triangles Congruent Sss, Sas AsaProving Triangles Congruent Sss, Sas Asa
Proving Triangles Congruent Sss, Sas Asa
 
Comparing Quantities Part 2 "Equivalent Ratio"
Comparing Quantities Part 2 "Equivalent Ratio"Comparing Quantities Part 2 "Equivalent Ratio"
Comparing Quantities Part 2 "Equivalent Ratio"
 
Congruent triangles
Congruent trianglesCongruent triangles
Congruent triangles
 
Linear Inequality
Linear InequalityLinear Inequality
Linear Inequality
 
Polygons presentation
Polygons presentationPolygons presentation
Polygons presentation
 
Translating Mathematical Phrases into Algebraic Expressions or Equations
Translating Mathematical Phrases into Algebraic Expressions or EquationsTranslating Mathematical Phrases into Algebraic Expressions or Equations
Translating Mathematical Phrases into Algebraic Expressions or Equations
 
Triangle-Congruence-Postulate-Day-4.pptx
Triangle-Congruence-Postulate-Day-4.pptxTriangle-Congruence-Postulate-Day-4.pptx
Triangle-Congruence-Postulate-Day-4.pptx
 
Stem and-leaf plots
Stem and-leaf plotsStem and-leaf plots
Stem and-leaf plots
 
Estimating square roots
Estimating square rootsEstimating square roots
Estimating square roots
 
Different Types of Graphs
Different Types of GraphsDifferent Types of Graphs
Different Types of Graphs
 
Maths Quadrilateral
Maths QuadrilateralMaths Quadrilateral
Maths Quadrilateral
 
4-types-of-graphs.pptx
4-types-of-graphs.pptx4-types-of-graphs.pptx
4-types-of-graphs.pptx
 
Bivariate data
Bivariate dataBivariate data
Bivariate data
 
Equation and Inequality.pptx
Equation and Inequality.pptxEquation and Inequality.pptx
Equation and Inequality.pptx
 

Viewers also liked

Graphs in physics
Graphs in physicsGraphs in physics
Graphs in physics
simonandisa
 
Line Graph Presentation
Line Graph Presentation Line Graph Presentation
Line Graph Presentation
Jennifer Field
 
Graphical presentation of data
Graphical presentation of dataGraphical presentation of data
Graphical presentation of data
drasifk
 
Lesson graphing using intercepts
Lesson graphing using interceptsLesson graphing using intercepts
Lesson graphing using intercepts
breesed
 
5 2slope
5 2slope5 2slope
5 2slope
taco40
 
Graph of a linear equation vertical lines
Graph of a linear equation   vertical linesGraph of a linear equation   vertical lines
Graph of a linear equation vertical lines
julienorman80065
 
2.3 linear equations
2.3 linear equations2.3 linear equations
2.3 linear equations
fthrower
 

Viewers also liked (20)

Graphs in physics
Graphs in physicsGraphs in physics
Graphs in physics
 
Line Graph Presentation
Line Graph Presentation Line Graph Presentation
Line Graph Presentation
 
Line graph
Line graphLine graph
Line graph
 
Graphs ppt
Graphs pptGraphs ppt
Graphs ppt
 
Chapter11
Chapter11Chapter11
Chapter11
 
Graphical presentation of data
Graphical presentation of dataGraphical presentation of data
Graphical presentation of data
 
Graphs in science
Graphs in scienceGraphs in science
Graphs in science
 
IELTS ACADEMIC TASK 1: How to describe a line graph
IELTS ACADEMIC TASK 1: How to describe a line graphIELTS ACADEMIC TASK 1: How to describe a line graph
IELTS ACADEMIC TASK 1: How to describe a line graph
 
Graphs
GraphsGraphs
Graphs
 
Pie chart
Pie chartPie chart
Pie chart
 
Bar chart
Bar chartBar chart
Bar chart
 
Charts And Graphs
Charts And GraphsCharts And Graphs
Charts And Graphs
 
Multi-line Graph
Multi-line GraphMulti-line Graph
Multi-line Graph
 
Lesson graphing using intercepts
Lesson graphing using interceptsLesson graphing using intercepts
Lesson graphing using intercepts
 
Graphing Using Slope Intercept Form
Graphing Using Slope Intercept FormGraphing Using Slope Intercept Form
Graphing Using Slope Intercept Form
 
Pre algebra lesson 8-7
Pre algebra lesson 8-7Pre algebra lesson 8-7
Pre algebra lesson 8-7
 
5 2slope
5 2slope5 2slope
5 2slope
 
Finding equations from lines
Finding equations from linesFinding equations from lines
Finding equations from lines
 
Graph of a linear equation vertical lines
Graph of a linear equation   vertical linesGraph of a linear equation   vertical lines
Graph of a linear equation vertical lines
 
2.3 linear equations
2.3 linear equations2.3 linear equations
2.3 linear equations
 

Similar to Line graphs, slope, and interpreting line graphs

How to draw a good graph
How to draw a good graphHow to draw a good graph
How to draw a good graph
Tarun Gehlot
 
Essay On Linear Function
Essay On Linear FunctionEssay On Linear Function
Essay On Linear Function
Angie Lee
 

Similar to Line graphs, slope, and interpreting line graphs (20)

How to draw a good graph
How to draw a good graphHow to draw a good graph
How to draw a good graph
 
Chapter 12
Chapter 12Chapter 12
Chapter 12
 
Visual Techniques
Visual TechniquesVisual Techniques
Visual Techniques
 
Implicit Interpolation Analytical Curves
Implicit Interpolation Analytical CurvesImplicit Interpolation Analytical Curves
Implicit Interpolation Analytical Curves
 
Graphs(Biostatistics and Research Methodology) B.pharmacy(8th sem.)
Graphs(Biostatistics and Research Methodology) B.pharmacy(8th sem.)Graphs(Biostatistics and Research Methodology) B.pharmacy(8th sem.)
Graphs(Biostatistics and Research Methodology) B.pharmacy(8th sem.)
 
Linear regression [Theory and Application (In physics point of view) using py...
Linear regression [Theory and Application (In physics point of view) using py...Linear regression [Theory and Application (In physics point of view) using py...
Linear regression [Theory and Application (In physics point of view) using py...
 
Curves and surfaces
Curves and surfacesCurves and surfaces
Curves and surfaces
 
Comparing the methods of Estimation of Three-Parameter Weibull distribution
Comparing the methods of Estimation of Three-Parameter Weibull distributionComparing the methods of Estimation of Three-Parameter Weibull distribution
Comparing the methods of Estimation of Three-Parameter Weibull distribution
 
Linear Regression
Linear RegressionLinear Regression
Linear Regression
 
Estimating Space-Time Covariance from Finite Sample Sets
Estimating Space-Time Covariance from Finite Sample SetsEstimating Space-Time Covariance from Finite Sample Sets
Estimating Space-Time Covariance from Finite Sample Sets
 
Regression analysis algorithm
Regression analysis algorithm Regression analysis algorithm
Regression analysis algorithm
 
Essay On Linear Function
Essay On Linear FunctionEssay On Linear Function
Essay On Linear Function
 
633e639cc8efda0018e1ca63_##_Graphical Representation 01 _ Class Notes __ (Vic...
633e639cc8efda0018e1ca63_##_Graphical Representation 01 _ Class Notes __ (Vic...633e639cc8efda0018e1ca63_##_Graphical Representation 01 _ Class Notes __ (Vic...
633e639cc8efda0018e1ca63_##_Graphical Representation 01 _ Class Notes __ (Vic...
 
Data Compression in Data mining and Business Intelligencs
Data Compression in Data mining and Business Intelligencs Data Compression in Data mining and Business Intelligencs
Data Compression in Data mining and Business Intelligencs
 
MIXTURES OF TRAINED REGRESSION CURVES MODELS FOR HANDWRITTEN ARABIC CHARACTER...
MIXTURES OF TRAINED REGRESSION CURVES MODELS FOR HANDWRITTEN ARABIC CHARACTER...MIXTURES OF TRAINED REGRESSION CURVES MODELS FOR HANDWRITTEN ARABIC CHARACTER...
MIXTURES OF TRAINED REGRESSION CURVES MODELS FOR HANDWRITTEN ARABIC CHARACTER...
 
17545489052556.pdf
17545489052556.pdf17545489052556.pdf
17545489052556.pdf
 
Graphical Representation of Statistical data
Graphical Representation of Statistical dataGraphical Representation of Statistical data
Graphical Representation of Statistical data
 
Lesson13
Lesson13Lesson13
Lesson13
 
Graphical representation of data mohit verma
Graphical representation of data mohit verma Graphical representation of data mohit verma
Graphical representation of data mohit verma
 
LINEAR FUNCTIONS
LINEAR FUNCTIONSLINEAR FUNCTIONS
LINEAR FUNCTIONS
 

Recently uploaded

The Roman Empire A Historical Colossus.pdf
The Roman Empire A Historical Colossus.pdfThe Roman Empire A Historical Colossus.pdf
The Roman Empire A Historical Colossus.pdf
kaushalkr1407
 

Recently uploaded (20)

Instructions for Submissions thorugh G- Classroom.pptx
Instructions for Submissions thorugh G- Classroom.pptxInstructions for Submissions thorugh G- Classroom.pptx
Instructions for Submissions thorugh G- Classroom.pptx
 
aaaaaaaaaaaaaaaaaaaaaaaaaaaaaaaaaaaaaaaaaaaaaaaaaaaaaaa
aaaaaaaaaaaaaaaaaaaaaaaaaaaaaaaaaaaaaaaaaaaaaaaaaaaaaaaaaaaaaaaaaaaaaaaaaaaaaaaaaaaaaaaaaaaaaaaaaaaaaaaaaaaaaa
aaaaaaaaaaaaaaaaaaaaaaaaaaaaaaaaaaaaaaaaaaaaaaaaaaaaaaa
 
NCERT Solutions Power Sharing Class 10 Notes pdf
NCERT Solutions Power Sharing Class 10 Notes pdfNCERT Solutions Power Sharing Class 10 Notes pdf
NCERT Solutions Power Sharing Class 10 Notes pdf
 
Home assignment II on Spectroscopy 2024 Answers.pdf
Home assignment II on Spectroscopy 2024 Answers.pdfHome assignment II on Spectroscopy 2024 Answers.pdf
Home assignment II on Spectroscopy 2024 Answers.pdf
 
Digital Tools and AI for Teaching Learning and Research
Digital Tools and AI for Teaching Learning and ResearchDigital Tools and AI for Teaching Learning and Research
Digital Tools and AI for Teaching Learning and Research
 
Basic_QTL_Marker-assisted_Selection_Sourabh.ppt
Basic_QTL_Marker-assisted_Selection_Sourabh.pptBasic_QTL_Marker-assisted_Selection_Sourabh.ppt
Basic_QTL_Marker-assisted_Selection_Sourabh.ppt
 
Fish and Chips - have they had their chips
Fish and Chips - have they had their chipsFish and Chips - have they had their chips
Fish and Chips - have they had their chips
 
The geography of Taylor Swift - some ideas
The geography of Taylor Swift - some ideasThe geography of Taylor Swift - some ideas
The geography of Taylor Swift - some ideas
 
Basic phrases for greeting and assisting costumers
Basic phrases for greeting and assisting costumersBasic phrases for greeting and assisting costumers
Basic phrases for greeting and assisting costumers
 
The Roman Empire A Historical Colossus.pdf
The Roman Empire A Historical Colossus.pdfThe Roman Empire A Historical Colossus.pdf
The Roman Empire A Historical Colossus.pdf
 
The Challenger.pdf DNHS Official Publication
The Challenger.pdf DNHS Official PublicationThe Challenger.pdf DNHS Official Publication
The Challenger.pdf DNHS Official Publication
 
TESDA TM1 REVIEWER FOR NATIONAL ASSESSMENT WRITTEN AND ORAL QUESTIONS WITH A...
TESDA TM1 REVIEWER  FOR NATIONAL ASSESSMENT WRITTEN AND ORAL QUESTIONS WITH A...TESDA TM1 REVIEWER  FOR NATIONAL ASSESSMENT WRITTEN AND ORAL QUESTIONS WITH A...
TESDA TM1 REVIEWER FOR NATIONAL ASSESSMENT WRITTEN AND ORAL QUESTIONS WITH A...
 
Embracing GenAI - A Strategic Imperative
Embracing GenAI - A Strategic ImperativeEmbracing GenAI - A Strategic Imperative
Embracing GenAI - A Strategic Imperative
 
1.4 modern child centered education - mahatma gandhi-2.pptx
1.4 modern child centered education - mahatma gandhi-2.pptx1.4 modern child centered education - mahatma gandhi-2.pptx
1.4 modern child centered education - mahatma gandhi-2.pptx
 
MARUTI SUZUKI- A Successful Joint Venture in India.pptx
MARUTI SUZUKI- A Successful Joint Venture in India.pptxMARUTI SUZUKI- A Successful Joint Venture in India.pptx
MARUTI SUZUKI- A Successful Joint Venture in India.pptx
 
Sectors of the Indian Economy - Class 10 Study Notes pdf
Sectors of the Indian Economy - Class 10 Study Notes pdfSectors of the Indian Economy - Class 10 Study Notes pdf
Sectors of the Indian Economy - Class 10 Study Notes pdf
 
Palestine last event orientationfvgnh .pptx
Palestine last event orientationfvgnh .pptxPalestine last event orientationfvgnh .pptx
Palestine last event orientationfvgnh .pptx
 
The Art Pastor's Guide to Sabbath | Steve Thomason
The Art Pastor's Guide to Sabbath | Steve ThomasonThe Art Pastor's Guide to Sabbath | Steve Thomason
The Art Pastor's Guide to Sabbath | Steve Thomason
 
Supporting (UKRI) OA monographs at Salford.pptx
Supporting (UKRI) OA monographs at Salford.pptxSupporting (UKRI) OA monographs at Salford.pptx
Supporting (UKRI) OA monographs at Salford.pptx
 
Unit 8 - Information and Communication Technology (Paper I).pdf
Unit 8 - Information and Communication Technology (Paper I).pdfUnit 8 - Information and Communication Technology (Paper I).pdf
Unit 8 - Information and Communication Technology (Paper I).pdf
 

Line graphs, slope, and interpreting line graphs

  • 1. Line graphs, slope, and interpreting line graphs Charalee Pera Incorporating Technology into the Classroom Wednesday September 29 2010
  • 2.
  • 3.
  • 4. How to draw a line graph
  • 5. How to draw a line graph (Y axis) (X axis)
  • 6. How to draw a line graph Manipulated or Independent Variable Responding or Dependent Variable
  • 7.
  • 8. How to draw a line graph Use the coordinates from your data to plot a data point on the graph
  • 9.
  • 10. How to draw a line graph Identify the variables and their relationship on the graph
  • 11. What is the formula used to calculate slope?
  • 12. MASS (g) VOLUME (cm 3 or mL) X Y The Density Lab DATA TABLE * * Y 2 y 1 x 2 x 1 RISE RUN 0 1 2 3 4 5 6 7 8 9 10 1 10 9 8 7 6 5 4 3 2 M V D 8.5 6 1.43 6.5 4 1.63 4 3 1.33
  • 13.  
  • 14.  
  • 15.