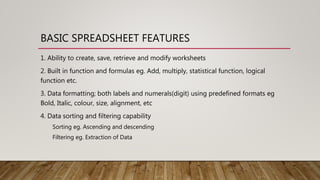
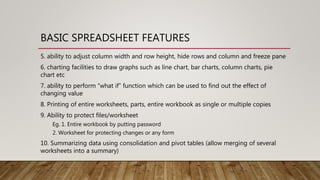
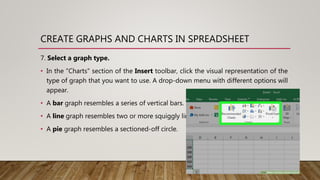
Spreadsheets allow users to organize and calculate data. Key features include the ability to create and modify workbooks containing multiple worksheets with rows and columns. Worksheets can contain numbers, formulas, and functions to automatically calculate values. Common spreadsheet programs like Microsoft Excel allow users to format and visualize data through graphs and charts.
MS Word is a word processing software that allows users to create, edit, format and print documents. It can be used to add text, images, charts and more. Key functions include creating and opening documents, setting page properties like margins and headers/footers, and editing text through copy, paste, find and replace. Common tools in Word help format and manipulate content in a document.
1. The document outlines features of Microsoft PowerPoint including presentations, the ribbon interface, slide views, themes, and working with content such as entering text, copying and pasting, and checking spelling.
2. It also discusses adding graphics to slides by inserting pictures and clip art. Directions are provided for locating, selecting, and positioning images on slides.
3. The agenda covers PowerPoint, creating slides, and inserting graphics. Key areas like the ribbon, slide navigation, saving presentations, adding and formatting slides are summarized.
This document provides an introduction to Microsoft PowerPoint, including:
- An overview of PowerPoint as a presentation program and its features like custom animations, media embedding, and online sharing.
- Descriptions of the basic elements of a PowerPoint presentation like slides, speaker notes, graphs, pictures, and different slide layouts.
- Explanations of how to insert text objects, format text, add media like videos, and use animation and slide transitions when building a PowerPoint presentation.
The document provides instructions on how to create a presentation using PowerPoint. It covers inserting themes, pictures, text boxes, headers and footers, tables, and deleting slides. It also discusses presentation tools used to project visual aids and overhead projectors. The objectives are to produce an effective presentation, manipulate colors and images, and present information to an audience. Evaluation questions ask about presentation tools and their importance.
This document discusses desktop publishing and the software MS Publisher. It will cover understanding desktop publishing, common desktop publishing software including MS Publisher, popular publication types like business cards and brochures, and how to design different publications using MS Publisher like calendars, flyers, and brochures. Students will learn the components, elements, and principles of design and how to access and use MS Publisher to create publications.
This document provides an overview of Microsoft Access, including that it is a relational database management system (RDBMS) that stores data in its own format. It can import or link to data from other sources. Access allows users to create databases and define data types for tables. Key objects in Access include tables, queries, forms and reports. Tables contain the data fields, queries retrieve specific data, forms provide interfaces for data entry and extraction, and reports organize data for presentation.
Excel is an electronic spreadsheet program that allows users to store, organize, and manipulate data in a grid of rows and columns called a worksheet. Worksheets contain cells that can hold text, numbers, or formulas. Excel provides tools like functions, charts, and data analysis features to help work with large amounts of data. Users can enter values, edit data, search, zoom, and print worksheets.
Microsoft Word is a word processing program that allows users to create documents like letters, reports, and flyers. It was first developed in 1981 and released in 1983. Word has various tools like formatting options, spellcheck, find and replace, styles, and page layout features to help users create and edit documents. Some key areas of the Word interface include the ribbon, ruler, text area, scroll bars, and status bar. Word also allows adding things like page numbers, comments, headers and footers, and more.
MS Word is a basic word processing program that allows users to create documents through typing, formatting text, inserting images and other media. Key features of MS Word include easy table creation, auto correct, large document management tools, and mail merge capabilities. The ribbon interface organizes commands into tabs and groups. Text can be manipulated through typing, copying, pasting, searching and replacing, and undoing changes. Font style, size, color and other text formatting can be applied using options on the Home tab.
Formatting in a word document involves organizing text to make it more attractive and readable. This includes formatting fonts, paragraphs, pages, lists, borders, and shading. Font formatting controls font face, size, color, and style through the format menu. Paragraph formatting covers alignment, margins, and breaks. Lists can be made bulleted or numbered. Borders outline paragraphs while shading fills the background.
PowerPoint is a Microsoft presentation program that allows users to create slide shows with notes to display and navigate through during presentations. Slide shows consist of individual pages or "slides" that can be printed, displayed live, or navigated through by the presenter. PowerPoint provides three types of movements between elements on slides (custom animations) and between slides (transitions). It has versions for Windows and Mac operating systems.
Getting Started Microsoft Publisher PowerPointLeith Mazzochi
Microsoft Publisher allows users to add text, charts, images, word art, lines, arrows, boxes and more using the side panel to customize documents. Users can also click on page options, color schemes, font schemes and quick publication options depending on the type of document being created.
The desktop is the screen that appears after turning on a computer and displays icons on a background picture. Double clicking icons with a mouse opens programs, folders, or files. Key concepts include icons, which represent programs, folders, and files that can be opened on the desktop.
This document provides an overview of getting started with Windows 10. It covers starting Windows 10 and signing in with a Microsoft account, navigating the desktop and Start menu, using a pointing device to point, click and drag, starting apps from the Start menu or by typing the name, working with windows by resizing, minimizing, maximizing and closing them, managing multiple windows, using buttons, menus and dialog boxes to provide instructions to Windows, and getting help or exiting Windows 10. The objectives are to learn the basic functions for navigating, launching programs, manipulating windows and providing input in Windows 10.
This document provides an overview of the basic terminology and tools in Microsoft PowerPoint. It discusses how to get started with PowerPoint and open a new presentation. It then summarizes the main menus and tools for formatting text, inserting images, tables, charts and other objects. The tools covered include changing fonts, formatting text, inserting slides, tables, pictures, and shapes. The document aims to accelerate learning PowerPoint through understanding its menus and ribbon interface.
PowerPoint is a presentation tool used to create slideshows and communicate ideas visually. It allows users to create new presentations from templates, add text, images, tables and other media to slides. The document discusses how to start PowerPoint, use various templates to create presentations, insert slides, add objects, work in different views and some other presentation software alternatives to PowerPoint.
Microsoft Word is a word processing program that allows users to type, edit, and save documents. The document provides an introduction to MS Word 2007, describing its purpose and main components. It explains that Word 2007 introduced the ribbon interface which organizes commands into tabs and groups, replacing the traditional menus and toolbars. It also outlines the main tabs in the ribbon, including the Home, Insert, and Page Layout tabs, describing the functions of each group within the tabs.
This lesson is for students taking the Cambridge School certificate exams Computer science subject(2210).I hope that it will of help to students in this period of crisis. Send me your feedback or suggestions on buxooa72@ gmail.com,
This document provides an introduction to spreadsheets and Microsoft Excel. It discusses key spreadsheet concepts like workbooks, sheets, and cells. It then describes the main interface elements of Excel, including the ribbon, tabs, quick access toolbar, formula bar, and status bar. Various functions of Excel are also covered like opening and navigating worksheets, entering data, and performing calculations. The document is intended to familiarize users with the basic features and capabilities of spreadsheet software.
PowerPoint is a presentation program developed by Microsoft as part of the Microsoft Office suite. It runs on Windows and Mac operating systems. The current versions are PowerPoint 2007 and 2010 for Windows, and PowerPoint 2011 for Mac. PowerPoint was initially called "Presenter" before being renamed in 1987. It provides tools for creating slides with text, images, and multimedia content and arranging them in a presentation. Users can customize slide layouts, themes, animations and slide transitions.
How to create a basic power point presentationjoluisae
This document provides instructions for creating a basic PowerPoint presentation in 9 steps:
1) Open PowerPoint and save your project, saving often to prevent data loss.
2) Create a title slide with the presentation title and subtitle.
3) Choose a slide design template.
4) Add new slides and edit the slide layout.
5) Add text to slides by adjusting font settings.
6) Add pictures to slides by inserting images from your computer.
7) Create multiple slides by following steps 4-6.
8) Add slide transitions by selecting different transition styles and settings.
9) Repeat step 8 to add transitions to other slides and preview the completed presentation.
This document provides an overview of basic features in Microsoft Word 2013, including how to create and edit documents, format text and pages, insert symbols, and set indents and tabs. It discusses the Word interface and tools like the ribbon, ruler, and views. It describes how to change font features, size, color and effects. It also covers adjusting page layout options like orientation, margins and size. Finally, it reviews formatting line and paragraph spacing, as well as using tabs. The goal is to familiarize users with Word's core functionality for document creation and editing.
Excel allows users to create and edit spreadsheets. It contains tools for entering and formatting data, performing calculations with formulas and functions, and creating charts and graphs. Common Excel functions include SUM, AVERAGE, COUNT, and financial calculations. Users can format cells, insert and delete rows/columns, move or copy data, and fill cells automatically with a series.
Microsoft Excel is a component of MS Office used to enter, analyze, and present quantitative data. It uses a spreadsheet format laid out in a grid of rows and columns. Excel is commonly used in business for tasks like budgeting, inventory management, and decision making. The Excel window interface includes elements like the ribbon, tabs, quick access toolbar, worksheet, formula bar, and status bar that allow the user to navigate, enter data and formulas, and view information. Formulas in Excel use operators to calculate and return values based on cell data.
This document provides an introduction to Adobe PageMaker, including definitions, features, advantages, disadvantages, and how to use it. PageMaker is a desktop publishing program that allows users to design documents like books, brochures, and newsletters. It includes tools for placing images, data merging, improved PDF support, and updated filters. The document also explains how to create a new PageMaker document and utilize various palettes that control objects, text, styles, layers, master pages, and hyperlinks.
The document outlines the module objectives for Word 2016, which include understanding word processing software, exploring the Word window, starting and saving documents, selecting and formatting text, using document templates, and navigating documents. The module contains 27 slides that provide instruction on the features and functions of Word 2016 through explanations, screenshots and examples.
The document provides instructions on how to use various features of Microsoft Word, including how to start and open documents, insert headers and footers, find and replace text, add borders and shading, check spelling and grammar, and create tables. It describes how to perform common formatting tasks like changing font styles and size, adding bullets and numbering, and converting text case. Instructions are provided with screenshots and step-by-step details.
Microsoft Excel is a spreadsheet application developed by Microsoft for creating and formatting spreadsheets. Spreadsheets allow information to be organized in rows and columns and analyzed using automatic mathematics. Excel workbooks can contain multiple worksheets which are made up of a grid of cells organized into rows and columns where data can be stored and analyzed using formulas. Excel offers various features for working with spreadsheets including formatting options, functions, charts and more.
NCompass Live - Aug. 22, 2018
http://nlc.nebraska.gov/ncompasslive/
Microsoft Excel has a variety of uses in the library world from keeping track of budgets or managing program registrations to viewing circulation or collection statistics. Learn some hints and tips for working with already existing spreadsheets as well as building your own. We’ll also take a look at Google Sheets and see how that compares with Excel.
Presenter: Megan Boggs, Seward (NE) Memorial Library.
The document provides an introduction to Excel basics, including:
- What a spreadsheet is and its key components like rows, columns, and cells.
- How to enter and format data, insert and delete rows and columns, and move or copy data within a spreadsheet.
- How to use formulas with mathematical and logical operators, functions, and cell references.
- Features for analyzing data like sorting, filtering, and creating charts and graphs.
Spreadsheets use a grid of rows and columns to organize and store data for calculations. Electronic spreadsheets offer benefits over manual ones like ease of calculation, editing, storage and display options. Spreadsheets consist of cells at the intersection of columns and rows where data like labels, values or formulas can be entered. Formulas use cell references, operators and functions to perform calculations. Charts can be used to visualize spreadsheet data in bar, column, line or pie formats.
Microsoft Excel is a spreadsheet program created by Microsoft that allows users to organize, format, and calculate data. It has tools like pivot tables, graphs, formulas, and macros to help users analyze information. Excel allows data analysts to easily examine and update data. Key parts of Excel include active cells, columns, rows, fill handles, address bars, formula bars, title bars, menus, toolbars, ribbons, worksheet tabs, and status bars. Important Excel formulas include SUM, AVERAGE, COUNT, and VLOOKUP to calculate and look up values.
This document defines key terms related to the Excel user interface and workbooks. It describes:
1) The main components of the Excel interface including the title bar, menus, toolbars, worksheet, cells, and sheet tabs.
2) How workbooks contain worksheets made up of columns and rows that intersect to form cells.
3) How to navigate within and between worksheets using keyboard shortcuts, scroll bars, and sheet tabs.
A spreadsheet consists of columns and rows that intersect to form cells. A cell is identified by its address, using the column letter followed by the row number. A range can refer to a single cell or group of cells. Spreadsheets allow users to organize data, perform calculations with formulas, and create charts and graphs. Common uses of spreadsheets include managing finances, analyzing test results, and visualizing data.
Microsoft Excel is a spreadsheet program used to organize data in grids with formulas and functions, allowing users to perform calculations, analyze data, and create charts. It provides tools for entering and manipulating data, performing calculations with functions, and creating charts to visualize data. Excel allows users to efficiently store, manipulate, and gain insights from large amounts of data.
Uses & applications of microsoft excel in vph researchDr Alok Bharti
Microsoft Excel is a spreadsheet application that allows users to enter and organize data into columns and rows, perform calculations with formulas, and visualize data through graphs and charts. It consists of worksheets where data is entered into cells that are organized by columns and rows. Common functions include formatting cells, filtering and sorting data, and using formulas to analyze data through calculations and pivot tables to examine relationships between variables.
The site present the assignment to the students in well- structured manner including all the information in the simplest form, so that students need not spend extra time and effort in completion of the assignment and along with these they can also gain all the content engraved in the brain.
This document summarizes an Excel training session that covered various Excel topics including basics, formulas, charts, printing, and mail merges. The training was led by three organizers and included an overview of Excel components and functions, hands-on exercises to create a shopping list and chart, and demonstrations of how to print worksheets, insert formulas, and use mail merges to generate reports and send emails. Additional topics discussed how Pearl and Microsoft Access relate to accessing and analyzing organizational data stored in the database.
This document provides an introduction to spreadsheets and their main components. It discusses labels, values, formulas and functions. It also outlines some common uses of spreadsheets like budgets, grades, and financial statements. The document identifies the parts of a spreadsheet window like columns, rows, cells, and describes entering different data types. It explains formulas and functions, relative and absolute referencing, and basic formatting and analysis tools like sorting, charts and graphs. Practical examples are provided on formatting cells and changing column widths.
The document discusses various features of Excel including pivot tables, conditional formatting, charts and graphics, auto-fill, paste special, built-in formulas, data sorting and filtering, and password protection. It also discusses the different parts of the Excel window including workbooks, the ribbon, tabs, the workspace, cells, formulas, and sheet tabs. Finally, it describes different types of charts in Excel like column, bar, line, area, pie, doughnut, XY scatter, and surface charts. It also provides an example of how to filter data in Excel to view specific records.
This document provides an overview of using Microsoft Excel to handle, graph, and analyze scientific data. It begins with basics of the Excel interface and entering data. It then demonstrates how to manipulate data through calculations, format cells, and use functions. The document shows how to create scatter plots and add regression lines to graphs. It also discusses interpolation, extrapolation, printing graphs, downloading internet data, and more advanced statistical analyses in Excel.
This document provides an introduction and overview of Microsoft Excel. It discusses key aspects of Excel including its use as a spreadsheet program to record and analyze numerical data in columns and rows. It describes the Office button, formatting text, inserting rows and columns, sorting and editing data, using formulas and functions, and some shortcut keys.
This document provides an overview of spreadsheets and Microsoft Excel. It discusses how Excel allows users to perform calculations, organize and analyze data. Common uses of spreadsheets include sales, accounting, scheduling and inventory. The document then reviews Excel basics like worksheets, cells, formatting, sorting, inserting/deleting rows and columns. It provides instructions for entering labels and values, cutting/copying/pasting, and formatting cells.
The document provides information about working with Microsoft Excel. It discusses key aspects of the Excel interface like the ribbon, tabs, groups of buttons, worksheet, cells, and more. It also provides steps to perform basic arithmetic operations in Excel like addition, subtraction, division, and multiplication on a sample dataset. Finally, it discusses different types of charts in Excel like column charts, line charts, bar charts, area charts, and pie/doughnut charts. It provides detailed steps to create a column chart on a sample dataset of animal population rates over six years.
Spreadsheets allow users to enter data into a table with rows and columns and perform calculations automatically. Formulas and functions can be used to calculate values within cells. Data can be sorted, charts can be created from cell ranges, and cells or ranges of cells can be moved or copied.
Microsoft Excel is a spreadsheet application that allows users to enter and organize data into worksheets and cells. Worksheets contain rows and columns that make up a grid, and data is entered into the grid's cells. Excel includes functions and formulas to perform calculations on data and create charts for visual representation. Users can format and style worksheets, enter formulas, filter and sort data, and perform other analysis. Google Sheets provides similar spreadsheet functionality to Excel in a web-based format.
Strategies for Effective Upskilling is a presentation by Chinwendu Peace in a Your Skill Boost Masterclass organisation by the Excellence Foundation for South Sudan on 08th and 09th June 2024 from 1 PM to 3 PM on each day.
Exploiting Artificial Intelligence for Empowering Researchers and Faculty, In...Dr. Vinod Kumar Kanvaria
Exploiting Artificial Intelligence for Empowering Researchers and Faculty,
International FDP on Fundamentals of Research in Social Sciences
at Integral University, Lucknow, 06.06.2024
By Dr. Vinod Kumar Kanvaria
বাংলাদেশের অর্থনৈতিক সমীক্ষা ২০২৪ [Bangladesh Economic Review 2024 Bangla.pdf] কম্পিউটার , ট্যাব ও স্মার্ট ফোন ভার্সন সহ সম্পূর্ণ বাংলা ই-বুক বা pdf বই " সুচিপত্র ...বুকমার্ক মেনু 🔖 ও হাইপার লিংক মেনু 📝👆 যুক্ত ..
আমাদের সবার জন্য খুব খুব গুরুত্বপূর্ণ একটি বই ..বিসিএস, ব্যাংক, ইউনিভার্সিটি ভর্তি ও যে কোন প্রতিযোগিতা মূলক পরীক্ষার জন্য এর খুব ইম্পরট্যান্ট একটি বিষয় ...তাছাড়া বাংলাদেশের সাম্প্রতিক যে কোন ডাটা বা তথ্য এই বইতে পাবেন ...
তাই একজন নাগরিক হিসাবে এই তথ্য গুলো আপনার জানা প্রয়োজন ...।
বিসিএস ও ব্যাংক এর লিখিত পরীক্ষা ...+এছাড়া মাধ্যমিক ও উচ্চমাধ্যমিকের স্টুডেন্টদের জন্য অনেক কাজে আসবে ...
ISO/IEC 27001, ISO/IEC 42001, and GDPR: Best Practices for Implementation and...PECB
Denis is a dynamic and results-driven Chief Information Officer (CIO) with a distinguished career spanning information systems analysis and technical project management. With a proven track record of spearheading the design and delivery of cutting-edge Information Management solutions, he has consistently elevated business operations, streamlined reporting functions, and maximized process efficiency.
Certified as an ISO/IEC 27001: Information Security Management Systems (ISMS) Lead Implementer, Data Protection Officer, and Cyber Risks Analyst, Denis brings a heightened focus on data security, privacy, and cyber resilience to every endeavor.
His expertise extends across a diverse spectrum of reporting, database, and web development applications, underpinned by an exceptional grasp of data storage and virtualization technologies. His proficiency in application testing, database administration, and data cleansing ensures seamless execution of complex projects.
What sets Denis apart is his comprehensive understanding of Business and Systems Analysis technologies, honed through involvement in all phases of the Software Development Lifecycle (SDLC). From meticulous requirements gathering to precise analysis, innovative design, rigorous development, thorough testing, and successful implementation, he has consistently delivered exceptional results.
Throughout his career, he has taken on multifaceted roles, from leading technical project management teams to owning solutions that drive operational excellence. His conscientious and proactive approach is unwavering, whether he is working independently or collaboratively within a team. His ability to connect with colleagues on a personal level underscores his commitment to fostering a harmonious and productive workplace environment.
Date: May 29, 2024
Tags: Information Security, ISO/IEC 27001, ISO/IEC 42001, Artificial Intelligence, GDPR
-------------------------------------------------------------------------------
Find out more about ISO training and certification services
Training: ISO/IEC 27001 Information Security Management System - EN | PECB
ISO/IEC 42001 Artificial Intelligence Management System - EN | PECB
General Data Protection Regulation (GDPR) - Training Courses - EN | PECB
Webinars: https://pecb.com/webinars
Article: https://pecb.com/article
-------------------------------------------------------------------------------
For more information about PECB:
Website: https://pecb.com/
LinkedIn: https://www.linkedin.com/company/pecb/
Facebook: https://www.facebook.com/PECBInternational/
Slideshare: http://www.slideshare.net/PECBCERTIFICATION
How to Setup Warehouse & Location in Odoo 17 InventoryCeline George
In this slide, we'll explore how to set up warehouses and locations in Odoo 17 Inventory. This will help us manage our stock effectively, track inventory levels, and streamline warehouse operations.
How to Manage Your Lost Opportunities in Odoo 17 CRMCeline George
Odoo 17 CRM allows us to track why we lose sales opportunities with "Lost Reasons." This helps analyze our sales process and identify areas for improvement. Here's how to configure lost reasons in Odoo 17 CRM
This slide is special for master students (MIBS & MIFB) in UUM. Also useful for readers who are interested in the topic of contemporary Islamic banking.
This presentation was provided by Steph Pollock of The American Psychological Association’s Journals Program, and Damita Snow, of The American Society of Civil Engineers (ASCE), for the initial session of NISO's 2024 Training Series "DEIA in the Scholarly Landscape." Session One: 'Setting Expectations: a DEIA Primer,' was held June 6, 2024.
Walmart Business+ and Spark Good for Nonprofits.pdfTechSoup
"Learn about all the ways Walmart supports nonprofit organizations.
You will hear from Liz Willett, the Head of Nonprofits, and hear about what Walmart is doing to help nonprofits, including Walmart Business and Spark Good. Walmart Business+ is a new offer for nonprofits that offers discounts and also streamlines nonprofits order and expense tracking, saving time and money.
The webinar may also give some examples on how nonprofits can best leverage Walmart Business+.
The event will cover the following::
Walmart Business + (https://business.walmart.com/plus) is a new shopping experience for nonprofits, schools, and local business customers that connects an exclusive online shopping experience to stores. Benefits include free delivery and shipping, a 'Spend Analytics” feature, special discounts, deals and tax-exempt shopping.
Special TechSoup offer for a free 180 days membership, and up to $150 in discounts on eligible orders.
Spark Good (walmart.com/sparkgood) is a charitable platform that enables nonprofits to receive donations directly from customers and associates.
Answers about how you can do more with Walmart!"
A review of the growth of the Israel Genealogy Research Association Database Collection for the last 12 months. Our collection is now passed the 3 million mark and still growing. See which archives have contributed the most. See the different types of records we have, and which years have had records added. You can also see what we have for the future.
2. INTRODUCTION
• Spreadsheet
is an application package used in manipulation of figures, also it is used
in data presentation and analysis
• Spreadsheet
is a file made of rows and columns that help sort data, arrange data
easily, and calculate numerical data.
What makes a spreadsheet software program unique is its ability
to calculate values using mathematical formulas and the data in
cells.
3. EXAMPLES OF SPREADSHEET PROGRAMS
• Today, Microsoft Excel is the most popular and widely used
spreadsheet program, but there are also many alternatives.
Below application packages that fall under this spreadsheet.
Microsoft Excel
Google Sheets - (Online and free)
iWork Numbers - Apple Office Suite
LibreOffice – for calculation
Lotus 1-2-3
Lotus Symphony - Spreadsheets
4. MICROSOFT - EXCEL
• Microsoft Excel
Is a software program that allows users to organize, format and
calculate data with formulas using a spreadsheet system.
• The features of excel is ability to perform basic calculations, use
graphing tools, create pivot tables and create macros.
• Excel has the same basic features as all spreadsheet
applications, which use a collection of cells arranged into rows
and columns to organize
5. COMPONENT OF MS-EXCEL
• Workbook: A workbook is a collection of worksheets that are saved together in
one file. Individual worksheets can be given descriptive names and you can
switch from one worksheet to another by using the sheet tabs that appear
beneath the worksheet grid area.
• Worksheet: A worksheet is the grid of columns and rows that information is
inputted into. In many spreadsheet applications (such as Microsoft Excel) one file
-- called a workbook -- can contain several worksheets.
• Rows: is the horizontally arrangement of a cell on the spreadsheet screen. An
Excel spreadsheet contains 16,384 rows which are labeled numerically
6. COMPONENT OF MS-EXCEL
• Column: are the vertically arrangement of a cell on the spreadsheet screen. An Excel
spreadsheet contains 256 columns that are labeled with the letters of the alphabet.
When the column labels reach letter "Z" they continue on with AA, AB, AC...... AZ
and then BA, BB, BC.....BZ etc
• Cell: A cell is a rectangular area formed by the intersection of a column and a row.
Cells are identified by the Cell Name (or Reference, which is found by combining the
Column Letter with the Row Number. For example the cell in Column "C" in Row "3"
would be cell C3.
• Cell Reference: A cell reference is the name of the cell that is found by combining
the Column Letter with the Row Number. For example the cell in Column "C" in Row
"3" would be cell C3.
7. COMPONENT OF MS-EXCEL
• Active Cell: The active cell is the cell in the spreadsheet that is currently selected
for data entry. You can change which cell is the active cell by clicking the left
mouse button once or using the arrow keys on the keyboard. The current active
cell can be identified as being the one that has a darker black border around it.
• Anchor Cell: The anchor cell is the first cell that is highlighted in a range. When
a range of cells is selected, they appear as highlighted in black. The anchor cell,
however, remains white. If only one cell is selected in the sheet, it is the anchor
cell
8. COMPONENT OF MS-EXCEL
• Data: Data refers to the type of information that can be stored in the cells of a
spreadsheet. Spreadsheet data types include values (numbers), labels, formulas
and functions
• Fill Handle: The fill handle is the small bold square in the bottom right corner of
a cell that can be used to copy (fill) data to adjacent cells in the same row or
column. When you hover over the fill handle box, the mouse pointer will change
to a black plus sign. You may then click the left mouse button, (and hold it
down) while selecting the adjacent cells to copy to. Releasing the mouse button
will then fill the content
9. COMPONENT OF MS-EXCEL
• Filter: Filtering will allow you to quickly find the information that you are looking for
in a spreadsheet. When you apply a filter, you control the data that is displayed on
the screen by setting criteria. Data contained in rows that don't meet your criteria
will temporarily disappear from view when the filter is applied. When the filter is
cleared, all of the data will once again appear in the spreadsheet
• Gridlines: Gridlines are the horizontal and vertical lines on the screen that separate
cells in a spreadsheet. Gridlines typically do not print unless the option is set in the
layout options of the spreadsheet
• Labels: Labels refer to text that is typed into the cells of a spreadsheet. Labels have
no numeric value and cannot be used in a formula or function
10. COMPONENT OF MS-EXCEL
• Formula: A formula is a spreadsheet mathematical expression that used to calculate a result
and display it in the active cell. A formula is written using cell references and must begin with
an equal sign "=" to distinguish it from a label. An example of a formula would be: =A3+C3
which would take whatever value was entered into cell A3 and add it to the value that was
typed into C3. After typing the formula and pressing the Enter key, the resulting value will be
displayed
• Freezing Columns and/or Rows: Freezing is a technique that can be used in larger
spreadsheets to assist in viewing the information on the screen. If a spreadsheet contains
many rows, you can freeze the rows containing your heading labels so that as you scroll down
in the sheet the headings stay at the top and line up with the appropriate data. Likewise, if
your spreadsheet contains many columns, the leftmost columns may be frozen so that they
stay with the data as you scroll to the right.
11. COMPONENT OF MS-EXCEL
• Function: Functions are built-in formulas that are used to enter either commonly
used or very complex formulas. Like formulas, functions begin with an equal
sign "=" and use cell references in their format. One commonly used function is
the Sum function, which will add up the values in a range. The function:
=sum(H2:H25) would add all values contained in cells H2 through H25 and
return the result when the enter key is pressed
Note:
• If you want to write any formula you should start with equal sign followed by
bracket
12.
13. BASIC SPREADSHEET FEATURES
1. Ability to create, save, retrieve and modify worksheets
2. Built in function and formulas eg. Add, multiply, statistical function, logical
function etc.
3. Data formatting; both labels and numerals(digit) using predefined formats eg
Bold, Italic, colour, size, alignment, etc
4. Data sorting and filtering capability
Sorting eg. Ascending and descending
Filtering eg. Extraction of Data
14. BASIC SPREADSHEET FEATURES
5. ability to adjust column width and row height, hide rows and column and freeze pane
6. charting facilities to draw graphs such as line chart, bar charts, column charts, pie
chart etc
7. ability to perform “what if” function which can be used to find out the effect of
changing value
8. Printing of entire worksheets, parts, entire workbook as single or multiple copies
9. Ability to protect files/worksheet
Eg. 1. Entire workbook by putting password
2. Worksheet for protecting changes or any form
10. Summarizing data using consolidation and pivot tables (allow merging of several
worksheets into a summary)
15. CREATE GRAPHS AND CHARTS IN SPREADSHEET
1. Consider the type of graph you want to make.
There are three basic types of graph that you can create in Excel, each of which works best for
certain types of data:
• Bar - Displays one or more sets of data using vertical bars. Best for listing differences
in data over time or comparing two similar sets of data.
• Line - Displays one or more sets of data using horizontal lines. Best for showing
growth or decline in data over time.
• Pie - Displays one set of data as fractions of a whole. Best for showing a visual
distribution of data.
16. CREATE GRAPHS AND CHARTS IN SPREADSHEET
2. Add your graph's headers.
• The headers, which determine the labels for individual sections of data, should go
in the top row of the spreadsheet starting with cell B1 and moving right from
there.. For example, to create a set of data called "Number of Lights" and another
set called "Power Bill", you would type Number of Lights into cell B1 and Power
Bill into C1
• Always leave cell A1 blank.
17. CREATE GRAPHS AND CHARTS IN SPREADSHEET
3. Add your graph's labels.
• The labels that separate rows of data go in the A column (starting in cell A2).
Things like time (e.g., "Day 1", "Day 2", etc.) are usually used as labels. For
example, if you're comparing your budget with your friend's budget in a bar
graph, you might label each column by week or month.
• You should add a label for each row of data.
18. CREATE GRAPHS AND CHARTS IN SPREADSHEET
4. Enter your graph's data.
• Starting in the cell immediately below your first header and immediately to the
right of your first label (most likely B2), enter the numbers that you want to use
for your graph.
• You can press the Tab ↹ key once you're done typing in one cell to enter the
data and jump one cell to the right if you're filling in multiple cells in a row.
19. CREATE GRAPHS AND CHARTS IN SPREADSHEET
5. Select your data.
• Click and drag your mouse from the top-left corner of the data group (e.g.,
cell A1) to the bottom-right corner, making sure to select the headers and labels
as well.
20. CREATE GRAPHS AND CHARTS IN SPREADSHEET
6. Click the Insert tab.
It's near the top of the Excel window. Doing so will open a toolbar below
the Insert tab.
21. CREATE GRAPHS AND CHARTS IN SPREADSHEET
7. Select a graph type.
• In the "Charts" section of the Insert toolbar, click the visual representation of the
type of graph that you want to use. A drop-down menu with different options will
appear.
• A bar graph resembles a series of vertical bars.
• A line graph resembles two or more squiggly lines.
• A pie graph resembles a sectioned-off circle.
22. CREATE GRAPHS AND CHARTS IN SPREADSHEET
8. Select a graph format.
• In your selected graph's drop-down menu, click a version of the graph (e.g., 3D)
that you want to use in your Excel document. The graph will be created in your
document. You can also hover over a format to see a preview of what it will look
like when using your data.
23. CREATE GRAPHS AND CHARTS IN SPREADSHEET
9. Add a title to the graph.
• Double-click the "Chart Title" text at the top of the chart, then delete the "Chart
Title" text, replace it with your own, and click a blank space on the graph.
24. FIVE BASIC EXCEL FORMULAS
1. SUM
• The SUM function is the first must-know formula in Excel. It usually aggregates
values from a selection of columns or rows from your selected range.
• Example:
=SUM(B2:G2) – A simple selection that sums the values of a row.
2. AVERAGE
• The AVERAGE function should remind you of simple averages of data such as
the average number of shareholders in a given shareholding pool.
25. FIVE BASIC EXCEL FORMULAS
• Example:
=AVERAGE(B2:B11) – Shows a simple average, also similar to (SUM(B2:B11)/10)
3. COUNT
• The COUNT function counts all cells in a given range that contain only numeric
values.
• Example
=COUNT(A1:C1) – Now it can count rows.
26. FIVE BASIC EXCEL FORMULAS
4. COUNTA
• Like the COUNT function, COUNTA counts all cells in a given rage. However, it
counts all cells regardless of type. That is, unlike COUNT that only counts
numerics, it also counts dates, times, strings, logical values, errors, empty string,
or text.
• Example
=COUNTA(C2:H2) will count columns C to H
27. FIVE BASIC EXCEL FORMULAS
5. IF
• The IF function is often used when you want to sort your data according to a
given logic. The best part of the IF formula is that you can embed formulas and
function in it.
• Example:
=IF(C2<D3, ‘TRUE,’ ‘FALSE’) – Checks if the value at C3 is less than the value at D3.
If the logic is true, let the cell value be TRUE, else, FALSE