Downloaded 522 times


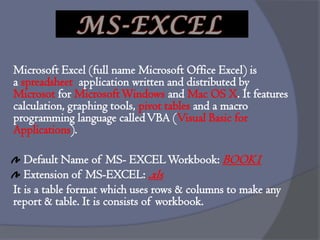
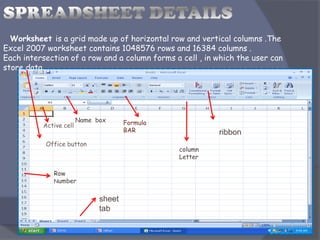


Microsoft Excel is a spreadsheet application that allows users to perform calculations, create graphs, and manage data using various tools such as pivot tables and a macro programming language (VBA). It features a grid of rows and columns, where users can utilize various formulas for calculations, data manipulation, and visual data representation using charts. Excel also provides advanced functionalities like filters, customizable reports, and interactive data analysis through pivot tables.