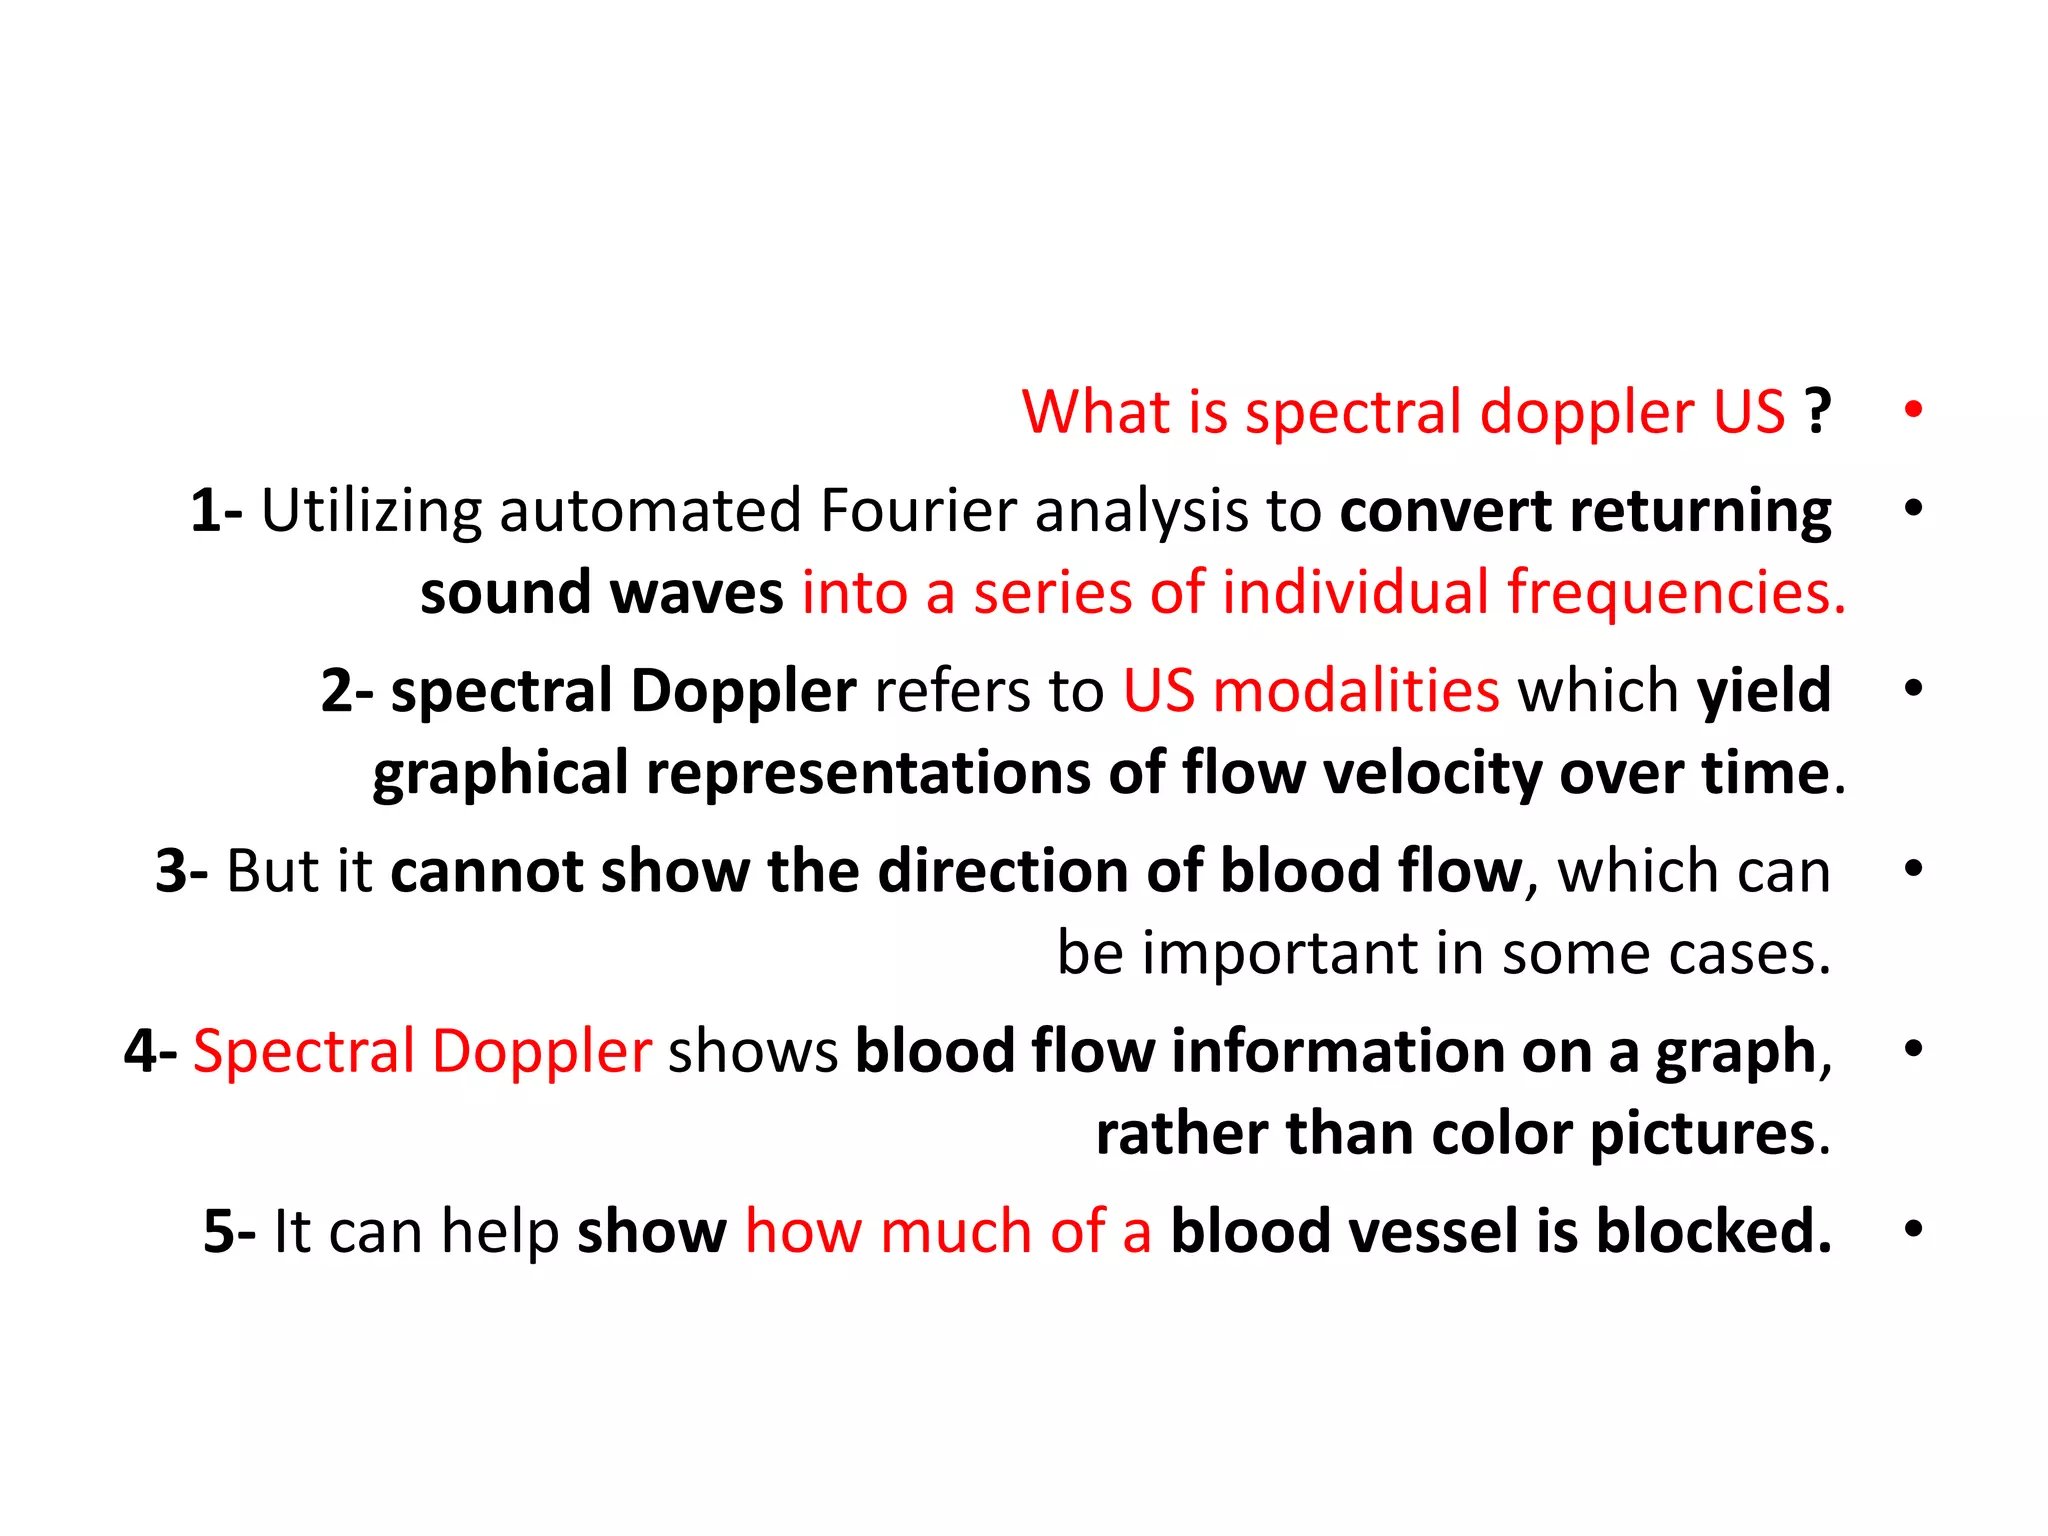
1) Spectral Doppler ultrasound analyzes returning sound waves to create graphical representations of blood flow velocity over time. It shows flow information as a graph rather than color images.
2) Key spectral Doppler parameters include angle, spectral gain, gate size and position, wall filter, and inversion of flow. The gate samples a small area to measure velocities, and should be optimally positioned. The wall filter removes low frequency noise.
3) Spectral Doppler analysis provides information on flow direction, absolute velocities, pulsatility, and hemodynamics. Proper adjustment of parameters like gain, gate, and wall filter optimize the measurement of flow.
![Doppler Principles [2]
Dr. Kamal Sayed MBBS MSc US UAA](https://image.slidesharecdn.com/dopplerprinciples2-210517111747/75/Doppler-principles-2-1-2048.jpg)
![•
Parametres of duplex / frequency spectrum : include :
•
## settings appropriate for specific exam, assigned by setup
applications/keys.
•
A] spectral-specific parametres : 1- angle. 2- spectral gain.
•
3- gate [b/w bars]. 4- gate site.
•
B] color & spectral parameters : 1- base line. 2- velocity scale.
3- wall filter. 4- inversion of flow. 5- focus.
•
C] color-specific parameters : 1- color gain. 2- color bar.
•
3- color box/ overlay.](https://image.slidesharecdn.com/dopplerprinciples2-210517111747/75/Doppler-principles-2-2-2048.jpg)
![•
Spectral doppler parameters [contd]
•
1- base line : discussed in PPt [1] . .
2- angle : discussed in PPt [1]
3- angle correction cursor : discussed in PPt [1]
•
4- doppler spectral gain.
•
5- gate site. 6- gate size [between bars]. 7- wall filter
8- inversion of flow.
•
•](https://image.slidesharecdn.com/dopplerprinciples2-210517111747/75/Doppler-principles-2-3-2048.jpg)

![•
4] Spectral Doppler gain
•
1- All US systems have gain control. It’s often a knob, button,
and/or a series of sliders.
•
2- Gain is a uniform amplification of the ultrasonic signal that
is returning to the TXR after it travels through the tissue.
•
So rather than brightening the monitor, the image on the
screen is whitened by a uniform margin, as though the
returning signal is stronger than it is, to make it easier to see.
•
3- Too much amplification can result in a washed-out image
with loss of detail or production of artifact.
•](https://image.slidesharecdn.com/dopplerprinciples2-210517111747/75/Doppler-principles-2-8-2048.jpg)
![•
When to Adjust Gain ?
•
If you have considered all of these previous suggestions in
slide [8] and your image is still dark, adjust your gain as
necessary to optimize the brightness of the image while
preserving detail.
•
@ too low gain setting, falsely suggests absent flow.
•
@ too high gain setting, artificially fills in the spectral
waveform, resulting in falsely increased flow.
•
Slide [10]
•](https://image.slidesharecdn.com/dopplerprinciples2-210517111747/75/Doppler-principles-2-10-2048.jpg)
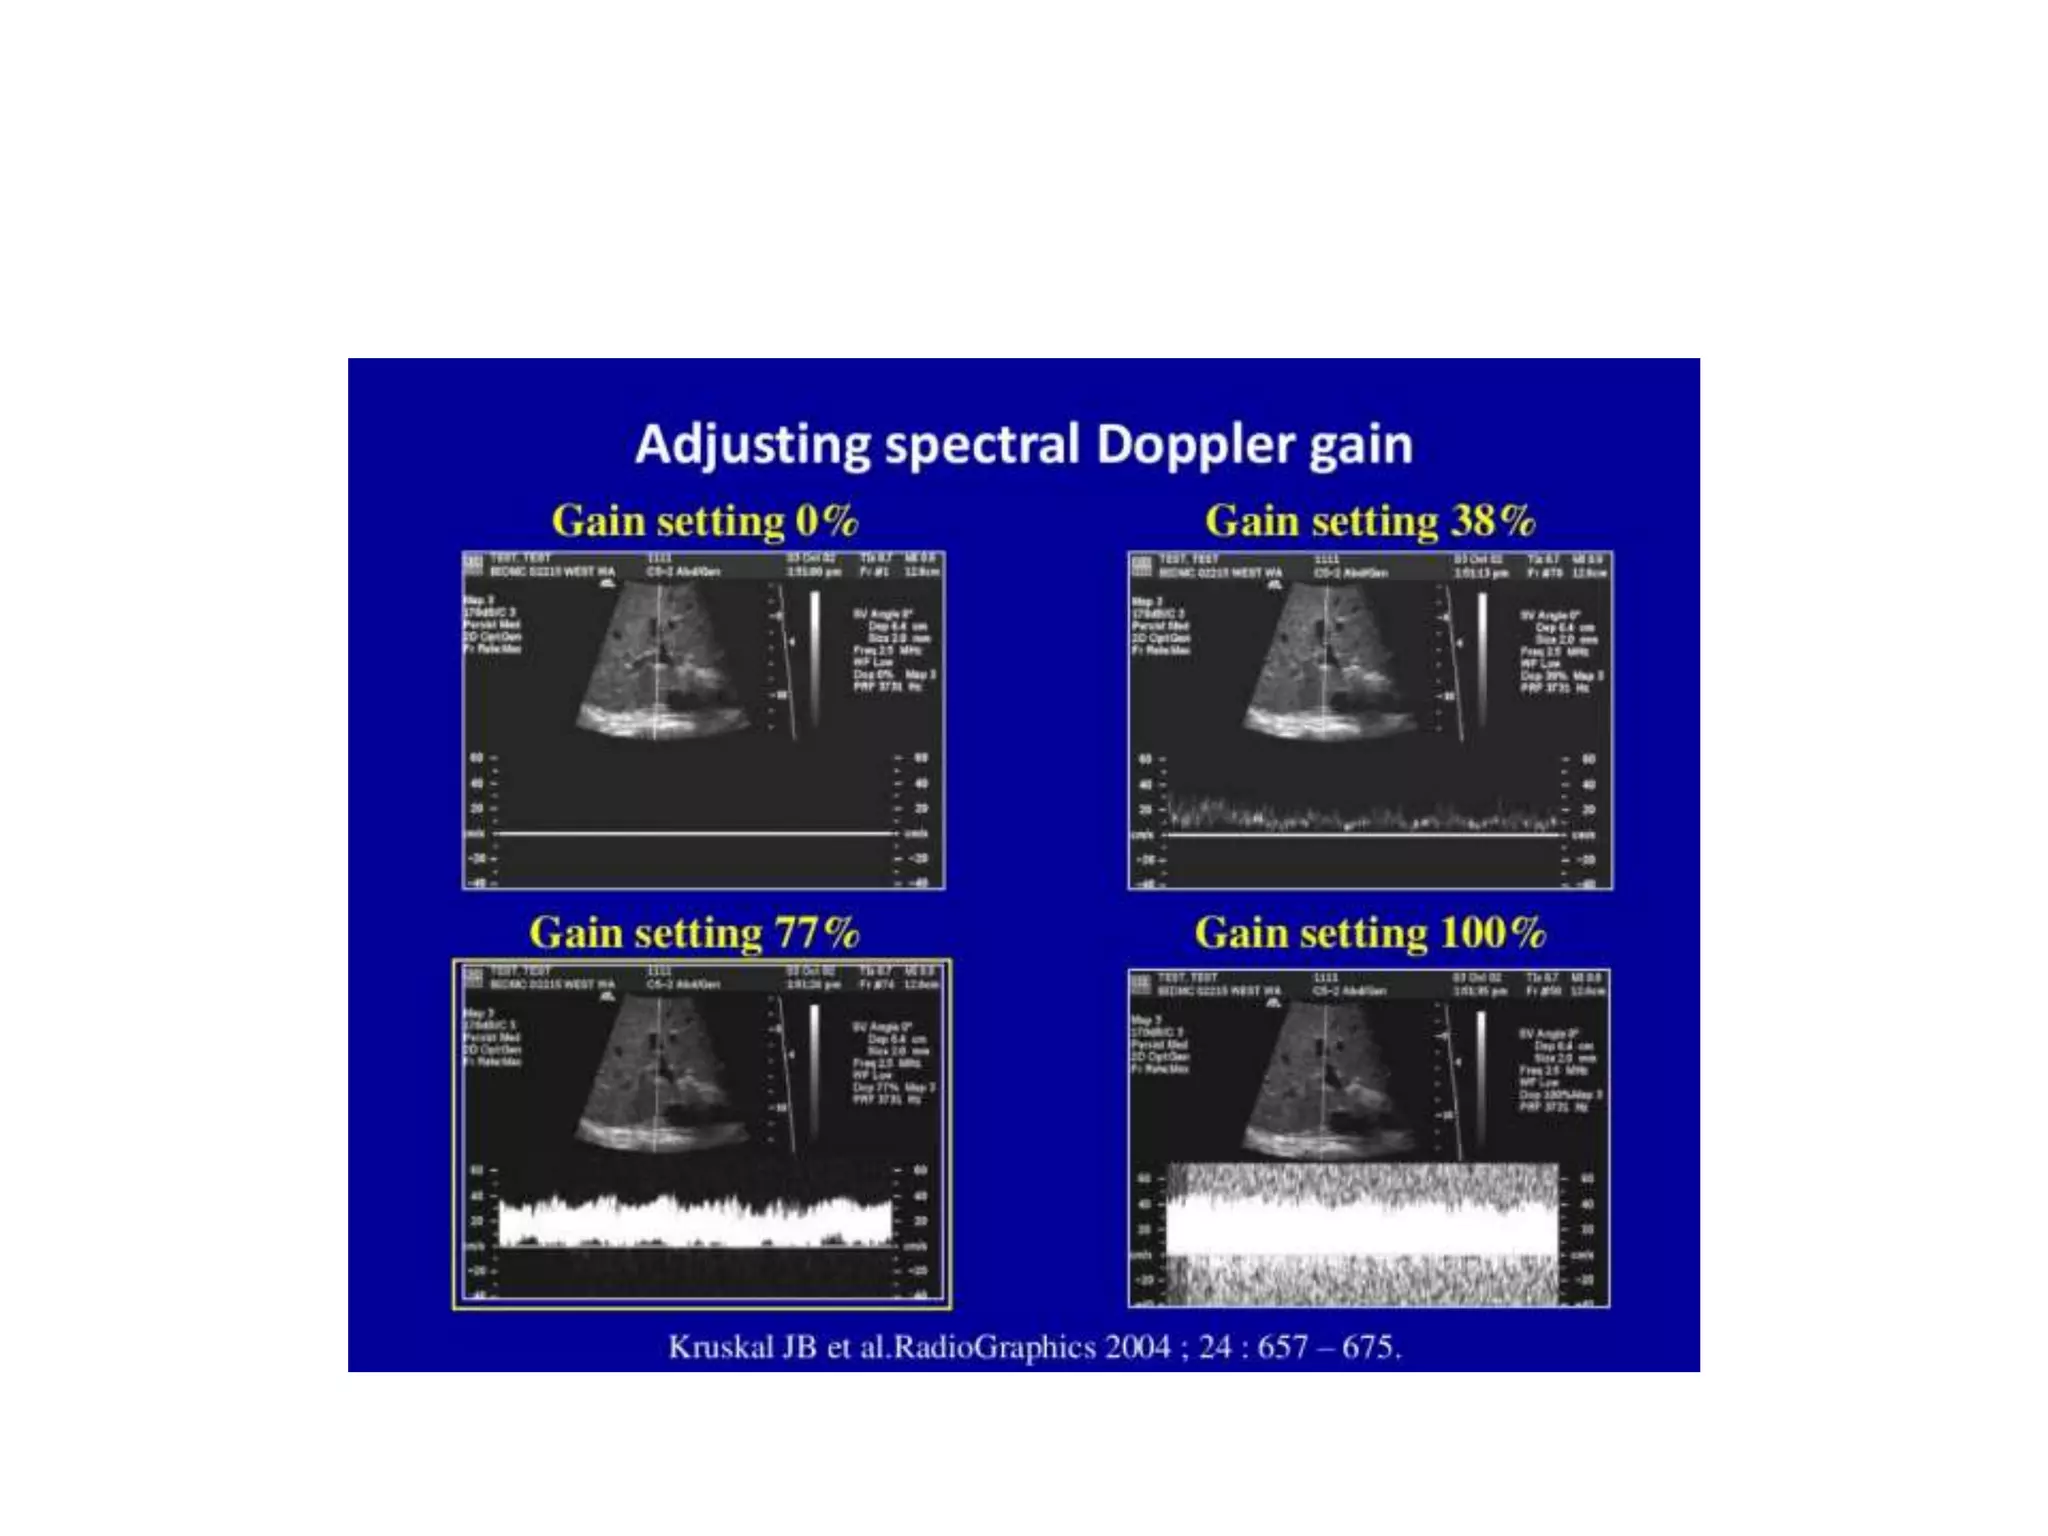
![•
optimizing gain settings [slide 12]
•
(A) upper LT : @ duplex image obtained with spectral doppler
US as active scanning mode, with too low gain settings [0%].
•
@ falsely suggests absent flow.
•
(B, C, D) duplex US image obtained with a gain setting of :
•
38% [b], 77% [c], 100% [d] ; demonstrate gradual artificial
filling in of the spectral waveform, yielding a false finding of
increased flow with little meaningful quantitative flow data.
•
@ the gain settings function indepedently of other
parameters. Slide [11/12]](https://image.slidesharecdn.com/dopplerprinciples2-210517111747/75/Doppler-principles-2-11-2048.jpg)

![•
5] Spectral gate
•
What is a gate in ultrasound?
•
1- In (PWD), the user defines a small area (the sample
"volume" or "gate") within the B-mode image, and (based on
pulse repetition frequency [PRF], or the time required for
returning sound waves) only the Doppler shifts recorded from
that area are recorded.
•
2- Doppler gate size determines how much of the flow
throughout a vessel cross-section will contribute to
the Doppler measurement. IN parabolic flow, the velocity of
the moving RBCs is greatest in the center of the vessel and
lowest near the vessel wall.](https://image.slidesharecdn.com/dopplerprinciples2-210517111747/75/Doppler-principles-2-14-2048.jpg)
![•
3- gate size is delineated as a pair of cross-hairs within the 2-D
image, & should be as small as possible to exclude erroneous
signal arising from adjacent vessels or marginal flow.
•
Slide [16]
•
6] Spectral gate position [site] :
•
4- To maximize depiction of flow, the gate should be
positioned over the central part of the vessel.
•
5- color duplex obtained with a wide gate in a suboptimal
location, shows sampling of flow in both the portal [above
base line], & hepatic [below] base line] veins.
•
Slide [16]](https://image.slidesharecdn.com/dopplerprinciples2-210517111747/75/Doppler-principles-2-15-2048.jpg)
![•
6- too large a gate size, may result in sampling from too large
an anatomoic region.
•
7- by @ reducing the gate size @ & improving the position for
sampling, a normal spectral waveform is obtained.
•
Slide [16]
•
## spectral window narrow frequencies range, result in clear
window. Slide [19]](https://image.slidesharecdn.com/dopplerprinciples2-210517111747/75/Doppler-principles-2-16-2048.jpg)


![•
Spectral doppler waveform [CCA] : slide [21]
•
1- information regarding the waveform are obtained from a
small gate placed in the center of the CCA.
•
2- the waveform indicates : a) flow direction in the sample
volume. b) velocities at a specific time in the sample volume .
& c) amplitude in the sample volume.
•
3- velocities are proportional the frequency shift, & each
point in the waveform corresponds to a specific velocity.
•
Slide [21]](https://image.slidesharecdn.com/dopplerprinciples2-210517111747/75/Doppler-principles-2-20-2048.jpg)
![Spectral doppler waveform [CCA]](https://image.slidesharecdn.com/dopplerprinciples2-210517111747/75/Doppler-principles-2-21-2048.jpg)
![Inv = inversion
•
4- the slope of the curve represents acceleration, & inflection
points, correspond to changes in acceleration. [inflection is a
point on a smooth plane curve at which the curvature changes
sign].
•
5- an appropriate doppler angle [60^ or less], is essential.
•
6- spectral doppler US yeilds information regarding the :
•
A) flow direction. B) absolute velocity of the moving blood.
•
C) phasicity. D) flow hemodynamics. E) arterial resistance.
•
F) pulsatility.
•
Slide [22]](https://image.slidesharecdn.com/dopplerprinciples2-210517111747/75/Doppler-principles-2-22-2048.jpg)
![•
7] spectral wall filters [slide 24]
•
1- The wall filter in US is a way of filtering out low or high
frequency Doppler signals.
•
2- In clinical US, is used to filter out very low frequencies that
may add noise to a spectral Doppler waveform.
•
3- A typical use is removing the low frequency reverberation
of an arterial wall.
•
4- Filters typically remove low-frequency, high-intensity noise
that may arise from vessel wall motion & surrounding tissues.
•
# arterial wall motion may produce audible & [visible thump].
•
•](https://image.slidesharecdn.com/dopplerprinciples2-210517111747/75/Doppler-principles-2-23-2048.jpg)
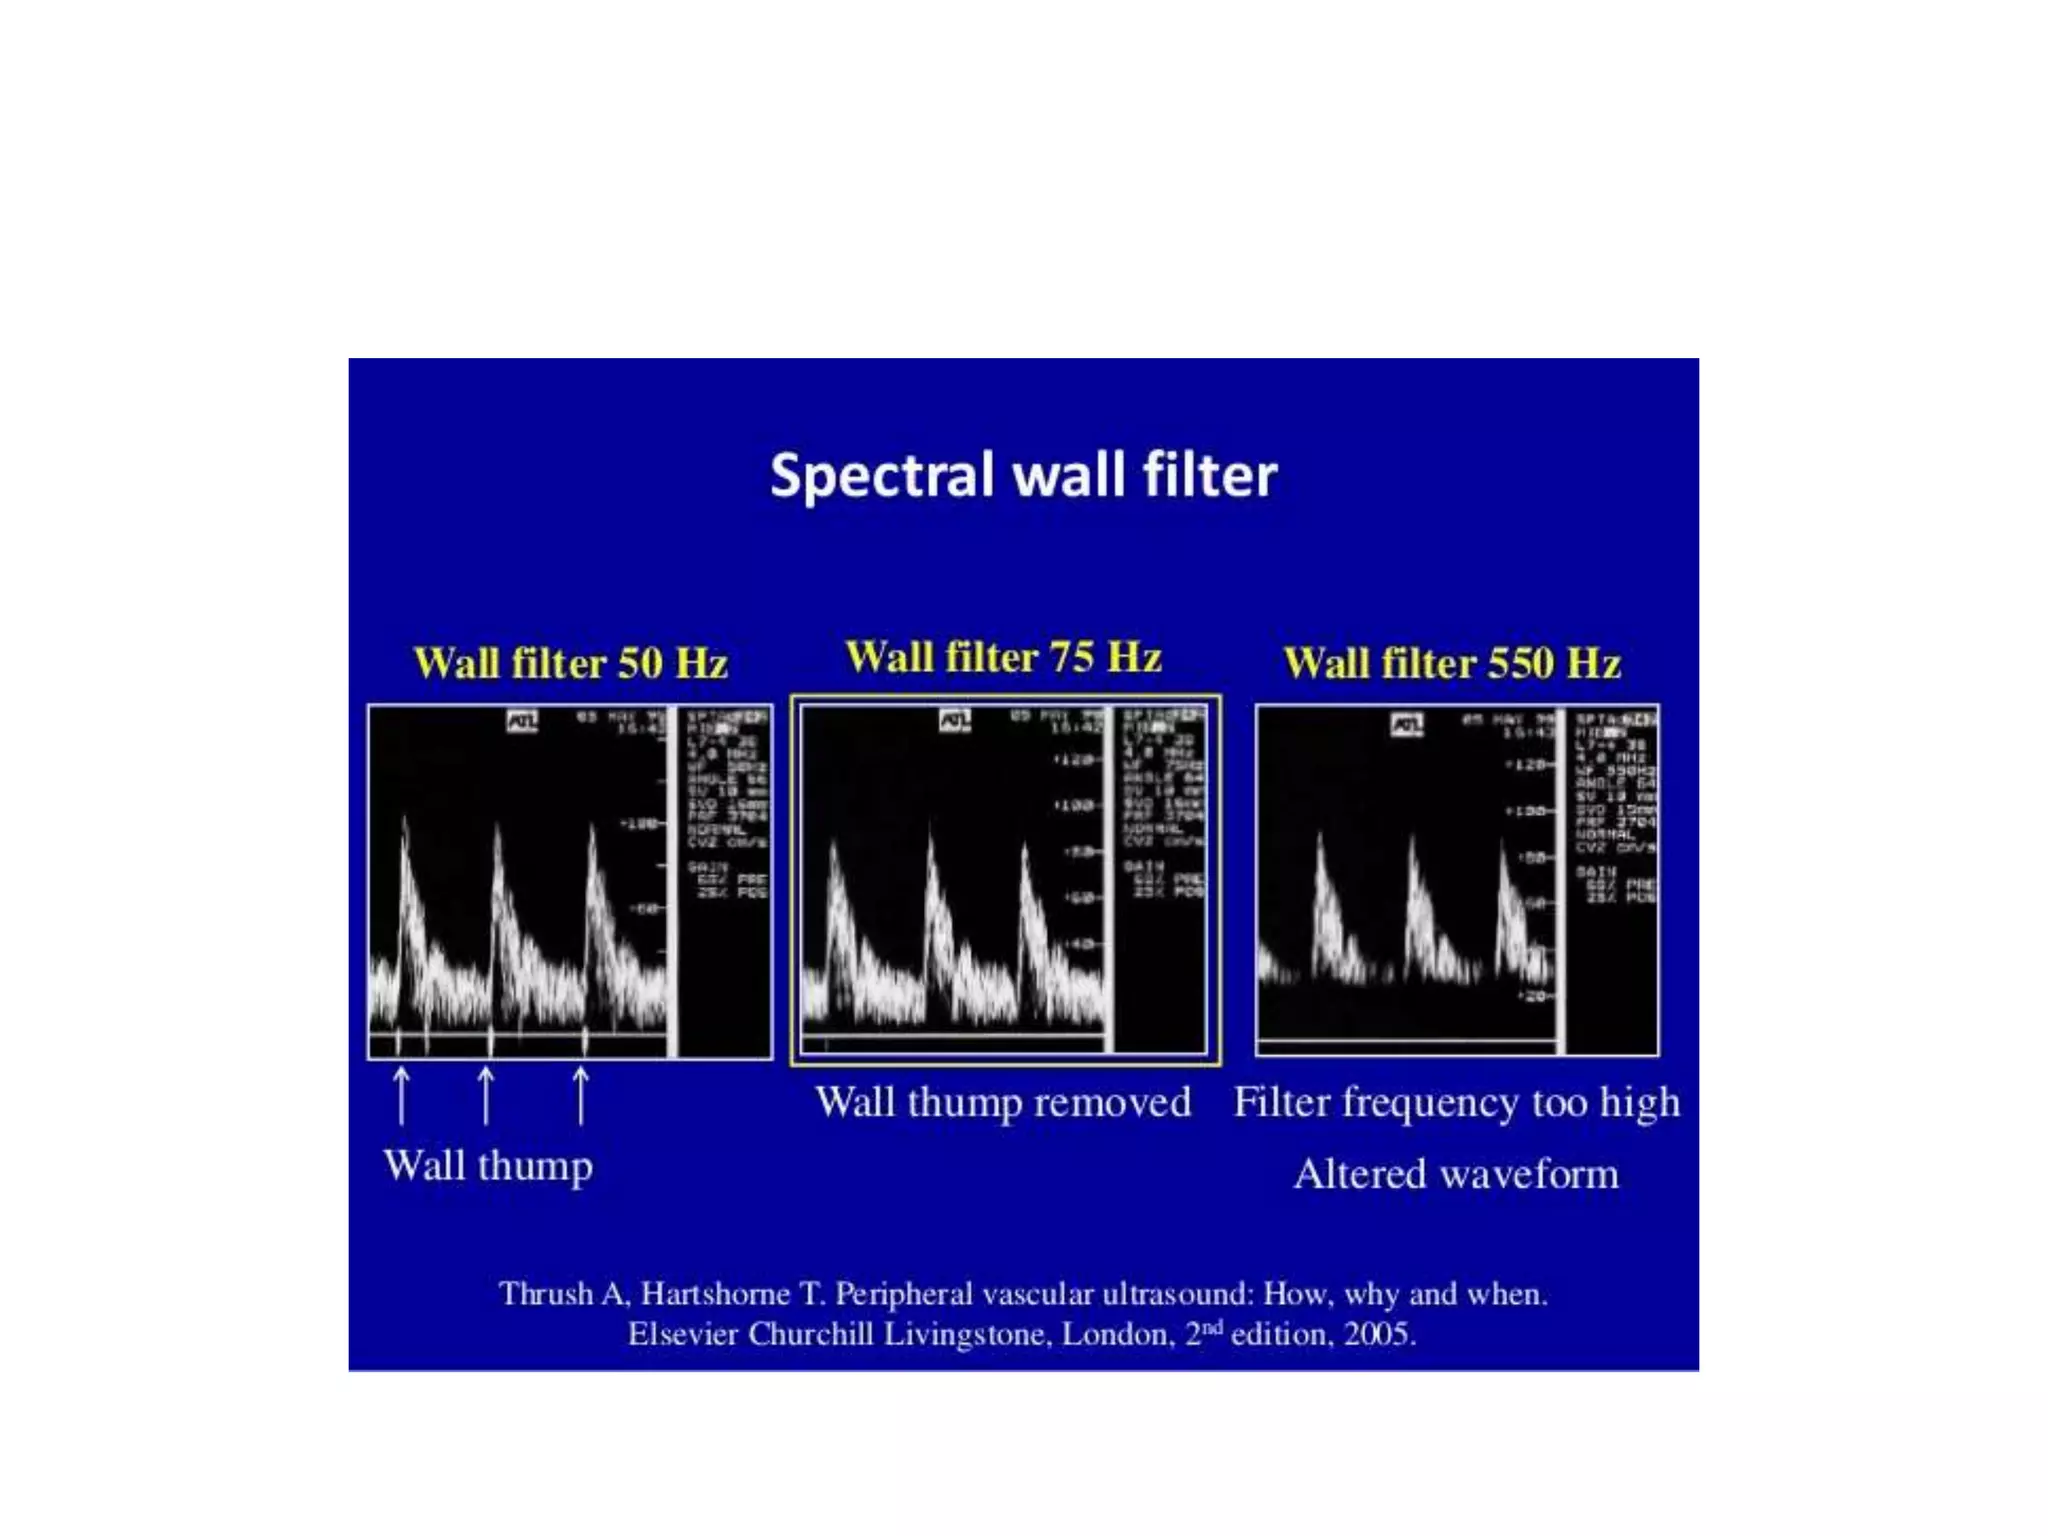
![•
5- A potential pitfall is that the wall filter may filter out
@genuine @ low-frequency @ slow flow, such as venous
blood flow. If the goal is to evaluate venous blood flow, make
sure the wall filter is set as low as possible.
•
6- changing the wall filter :
•
A) color duplex US LT image : @ obtained with a high wall
filter setting, shows loss of low-velocity-flow component of
the spectral waveform immediately above the base line.
•
@ higher-velocity flow is well depicted, & accurate flow
quantification can sill occur.
•
Slide [26]
•
•](https://image.slidesharecdn.com/dopplerprinciples2-210517111747/75/Doppler-principles-2-25-2048.jpg)
![•
@ in evaluation of liver vasculature, this is likely to become
relevant only when velocity is very low & falls within the
range of velocities that are filterd out.
•
B) color duplex US RT image : demonstrates how the spectral
waveform progressively fill in towards the base line as the
wall filter is sequentially reduced from high [LT arrow], to
medium [middle arrow], to low [RT arrow].
•](https://image.slidesharecdn.com/dopplerprinciples2-210517111747/75/Doppler-principles-2-27-2048.jpg)
![•
8] inversion of spectral flow
•
1- is the ability to electronically invert the direction of flow as
depicted on both the color flow & spectral waveform.
•
2- as such, color inversion, will result in a blue-red reversal &
may lead to misinterpretation of the direction of flow in the
vessel being evaluated.
•
3- slide [29] inversion of spectral & color flow falsely
suggesting reversal of portal venous flow :
•
A) LT image on a color duplex US obtained with the spectral
doppler US component as the active scanning mode :](https://image.slidesharecdn.com/dopplerprinciples2-210517111747/75/Doppler-principles-2-28-2048.jpg)


![•
Parametres of duplex / frequency spectrum : include :
•
## settings appropriate for specific exam, assigned by setup
applications/keys.
•
A] spectral-specific parametres : 1- angle. 2- spectral gain.
•
3- gate [b/w bars]. 4- gate site.
•
B] color & spectral parameters : 1- base line. 2- velocity scal.
3- wall filter. 4- inversion of flow. 5- focus.
•
C] color-specific parameters : 1- color gain. 2- color bar.
•
3- color box/ overlay.](https://image.slidesharecdn.com/dopplerprinciples2-210517111747/75/Doppler-principles-2-31-2048.jpg)
![•
[CFD] color-specific parameters :
•
1- color gain. 2- color bar. 3- color box/overlay.
•
1] base line
•
1- The base line is depicted on both the color & spectral
waveform.
•
2- the base line divides the color bar into positive & negative
doppler shifts.
•
3- adjusting the baseline alters the velocity range that is
displayed, & is therefore used to prevent aliasing.
•
Slide [34/35]
•
•](https://image.slidesharecdn.com/dopplerprinciples2-210517111747/75/Doppler-principles-2-32-2048.jpg)
![•
4- the position of the base line on the Color bar, is indicated
by a horizontal black line [yellow circles, slide 34/35].
•
5- when the base line is adjusted [changes] :
•
A) the relative position of this horizontal black line changes.
•
B) the color velocity range that is displayed on the color bar,
also changes. [in this example, from 15.3 to 46.1 cm/s above
or below the base line].
•
C) the range of depicted velocities remains constant, but
different flow velocities will be emphasized depending on
their relative position on the color bar.
•
Slide [34/35]
•](https://image.slidesharecdn.com/dopplerprinciples2-210517111747/75/Doppler-principles-2-33-2048.jpg)

![When color base line changed, color velocity range changed.
BUT : range of depicted [presented] velocities remains constant.](https://image.slidesharecdn.com/dopplerprinciples2-210517111747/75/Doppler-principles-2-35-2048.jpg)
![•
6- changing the base line to avoid aliasing [slide 37/38] :
•
A] @ on a color doppler flow US LT image slide [36], flow
within the portal vein appears green [the color equivalent of
aliasing on the selected color bar] :
•
@ the color baseline [arrow] is positioned too high on the
color bar.
•
@ although the US image helps confirm the presence of flow,
the base line should be lowered to obtain meaningful
directional data.
•
Slide [38/39]](https://image.slidesharecdn.com/dopplerprinciples2-210517111747/75/Doppler-principles-2-36-2048.jpg)
![•
B] on a color doppler flow US RT image slide [38/39],
obtained after lowering of the base line [arrow] :
•
@ accurate directional flow data are obtained from the main
portal vein : appropriate antegrade portal venous flow
towards the TXR appears red.](https://image.slidesharecdn.com/dopplerprinciples2-210517111747/75/Doppler-principles-2-37-2048.jpg)


![2] color velocity scale [PRF]
1- velocity scale is the range of flow velocities that are depicted
with either the color or spectral component.
2- if the measured flow velocity falls outside the selected scale,
aliasing of the currently active scanning mode will occur.
3- adjusting the color velocity : [slide 41]
A] CFD RT image : @ obtained with color velocity scale set too
high [PRF 4500 Hz]= 69.2 cm/s. @ demonstrated apparent
absence of flow in the portal vein.
Slide [41]](https://image.slidesharecdn.com/dopplerprinciples2-210517111747/75/Doppler-principles-2-40-2048.jpg)
![Doppler principles [2]](https://image.slidesharecdn.com/dopplerprinciples2-210517111747/75/Doppler-principles-2-41-2048.jpg)
![Doppler principles [2]](https://image.slidesharecdn.com/dopplerprinciples2-210517111747/75/Doppler-principles-2-42-2048.jpg)


![Doppler principles [1]](https://cdn.slidesharecdn.com/ss_thumbnails/dopplerprinciples1-210517111539-thumbnail.jpg?width=640&height=640&fit=bounds)
![Hepatic doppler us [2]](https://cdn.slidesharecdn.com/ss_thumbnails/hepaticdopplerus2-210813103451-thumbnail.jpg?width=640&height=640&fit=bounds)
![Hepatic doppler us [2]](https://cdn.slidesharecdn.com/ss_thumbnails/hepaticdopplerus2-210517110832-thumbnail.jpg?width=640&height=640&fit=bounds)


![Hepatic doppler us [3]](https://cdn.slidesharecdn.com/ss_thumbnails/hepaticdopplerus3-210813102908-thumbnail.jpg?width=640&height=640&fit=bounds)

![Umbilical artery doppler [1]](https://cdn.slidesharecdn.com/ss_thumbnails/umbilicalarterydoppler1-210517112207-thumbnail.jpg?width=640&height=640&fit=bounds)

![Hepatic dopp us [1]](https://cdn.slidesharecdn.com/ss_thumbnails/hepaticdoppus1-210813101656-thumbnail.jpg?width=640&height=640&fit=bounds)


![Hepatic doppler us [3]](https://cdn.slidesharecdn.com/ss_thumbnails/hepaticdopplerus3-210517111042-thumbnail.jpg?width=640&height=640&fit=bounds)
![Hepatic dopp us [1]](https://cdn.slidesharecdn.com/ss_thumbnails/hepaticdoppus1-210517110108-thumbnail.jpg?width=640&height=640&fit=bounds)


