This document discusses Doppler ultrasound principles including the Doppler effect, spectral Doppler parameters, and optimizing Doppler measurements. The key points are:
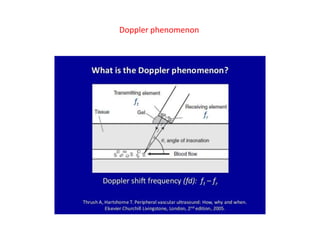
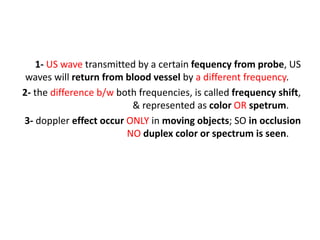
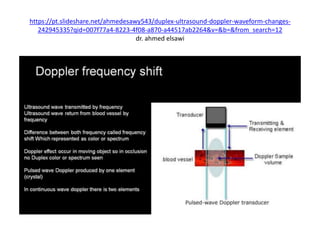
1) The Doppler effect is the change in frequency/pitch of a wave due to relative motion between the source and observer. This principle allows Doppler ultrasound to detect the direction and velocity of blood flow.
2) Important spectral Doppler parameters that affect measurements include the baseline, Doppler angle, and velocity scale. The baseline and velocity scale must be optimized to prevent aliasing, while the Doppler angle should be corrected to compensate for inaccuracies introduced by non-parallel ultrasound beams.
3) Correctly adjusting these spectral Doppler parameters is essential for obtaining accurate blood flow velocity measurements and meaningful Doppler
![Doppler principles [1]
Dr. Kamal Sayed MBBS MSc US UAA](https://image.slidesharecdn.com/dopplerprinciples1-210517111539/85/Doppler-principles-1-1-320.jpg)
![Doppler principles [1]
Dr. Kamal Sayed MBBS MSc US UAA](https://image.slidesharecdn.com/dopplerprinciples1-210517111539/75/Doppler-principles-1-1-2048.jpg)
![•
Doppler Effect & frequency shift
•
1- The apparent change in frequency due to the relative
motion b/w the source & observer is known as the doppler
effect.
•
2- doppler effect is the phenomenon that the wave
frequency changes when the distance b/w a source of sound
& a receiver of sound is changing :
•
@ if objects are coming closer to each other [moving towards
each other], frequency increases [wave compressed &
shortened].
•](https://image.slidesharecdn.com/dopplerprinciples1-210517111539/85/Doppler-principles-1-3-320.jpg)
![•
@ if objects are moving farther away from each other,
frequency decreases [wave rarefied & lengthened].
•
3- doppler effect refers to change in pitch of a sound due to
the motion either of the source or the listener.
•
4- if 2 objects are approching each other, OR if an initial
object is approaching a 2ND standing object, the pitch is
higher.
•
5- if 2 objects are moving apart, OR if an initial object is
moving apart from a 2ND standing object, the pitch is lower.
•
•
•](https://image.slidesharecdn.com/dopplerprinciples1-210517111539/85/Doppler-principles-1-4-320.jpg)
![•
# IF source & observer are moving towards each other, the
pereceived [received] frequency [fr] is higher than the actual
[transmitted] frequency [ft].
•
# IF source & observer are moving away from each other, the
pereceived [received] frequency [fr] is lower than the actual
[transmitted] frequency [ft].
•
6- the change in loudness is the doppler frequency shift.
•
7- doppler phenomenon is the difference b/w transmitted &
received frequencies.
•
Slide [6]
•
•](https://image.slidesharecdn.com/dopplerprinciples1-210517111539/85/Doppler-principles-1-5-320.jpg)
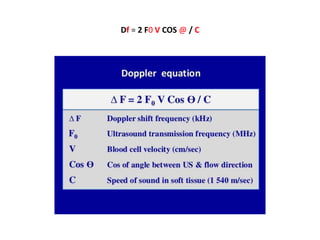
![Df = 2 F0 V COS @ / C
•
The perceived frequency [fr], is RELATED to the actual
•
transmitted frequency [ft], AND the relative speeds of :
•
@ source & @ waves in the medium, BY the
•
doppler equation : slide [23]
•
V = blood cells velocity [cm/s] /
•
Df = doppler frequency shift [KHz]/
•
C = speed of sound in soft tissue [1540 m/s] /
•
F0 = original US transmitted fequency [MHz]/
•
@ = cosine of angle b/w US TXR & blood flow direction/
•
Df = 2 F0 V COS @ / C
•](https://image.slidesharecdn.com/dopplerprinciples1-210517111539/85/Doppler-principles-1-8-320.jpg)
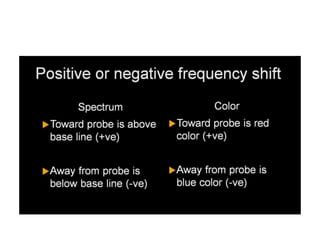
![•
Positive OR negative frequency shifts
•
A) SPECTRAL DOPPLER :
•
1- flow towards probe, is above the baseline; a positive
frequency shift.
•
2- flow away from probe, is below the base line; a negative
frequency shift.
•
B) COLOR FLOW DOPPLER :
•
1- towards probe is red color ; is a positive doppler shift.
•
2- away from probe, is blue color; a negative frequency shift.
•
Slide [25]
•](https://image.slidesharecdn.com/dopplerprinciples1-210517111539/85/Doppler-principles-1-10-320.jpg)
![•
Positive OR negative frequency shifts
•
A) SPECTRAL DOPPLER :
•
1- flow towards probe, is above the baseline; a positive
frequency shift.
•
2- flow away from probe, is below the base line; a negative
frequency shift.
•
B) COLOR FLOW DOPPLER :
•
1- towards probe is red color ; is a positive doppler shift.
•
2- away from probe, is blue color; a negative frequency shift.
•
Slide [13]
•](https://image.slidesharecdn.com/dopplerprinciples1-210517111539/85/Doppler-principles-1-12-320.jpg)
![The received frequency is :
@ higher during approach.
@ identical at instant of passing by.
@ lower during receding [recession].
Doppler phenomenon
Df [doppler freq shift] = Ft [transmitted freq] – Fr [received freq]](https://image.slidesharecdn.com/dopplerprinciples1-210517111539/85/Doppler-principles-1-14-320.jpg)
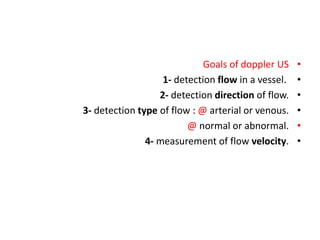
![•
Types of doppler modalities :
•
1- continuous wave doppler [CWD] (other types are all pulsed
wave doppler [PWD]).
•
2- spectral [duplex] doppler.
•
3- spectral & color [triplex] doppler.
•
4- power doppler [PD].
•
ALL doppler US examinations should be performed with :
•
Grey-scale US, color doppler, spectral doppler, power doppler.](https://image.slidesharecdn.com/dopplerprinciples1-210517111539/85/Doppler-principles-1-16-320.jpg)
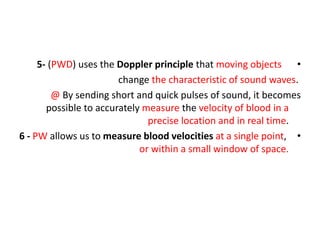
![PULSED WAVE DOPPLER [PWD]
1- PWD employs elements of the transducer that send as well
as receive signals.
2- US is emitted as “pulses” between these pulses.
3- in PWD, the same TXR element receives the reflected signal
[one crystal] but in CWD 2 crystals are employed.
4- every emitted pulse is paired with a corresponding return
signal.](https://image.slidesharecdn.com/dopplerprinciples1-210517111539/85/Doppler-principles-1-17-320.jpg)
![7- US waves are produced in pulses.
•
@ Each pulse is 2-3 cycles of the same frequency.
•
@ The pulse length [SPL] is the distance each pulse travels.
@The [PRF] is the rate at which the transducer emits
the pulses [the number of cycles emitted per seconds in Hz].
•
In US imaging the significance of wavelength is
that short wavelengths are required to produce short pulses
for good anatomical detail (in the depth direction) and this
requires higher frequencies.](https://image.slidesharecdn.com/dopplerprinciples1-210517111539/85/Doppler-principles-1-19-320.jpg)
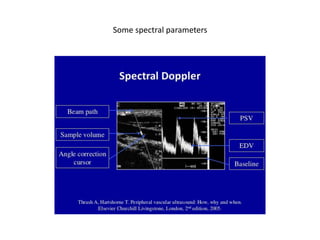
![•
spectral specific parametres [Slide [22]]
•
•
1- base line . .
2- angle. / 3- angle correction cursor.
•
4- doppler spectral gain.
•
5- gate site. / 6- gate size [between bars].
•
7- beam path.
•
8- sample volume.
•
Slide [22]
•
•
•](https://image.slidesharecdn.com/dopplerprinciples1-210517111539/85/Doppler-principles-1-21-320.jpg)
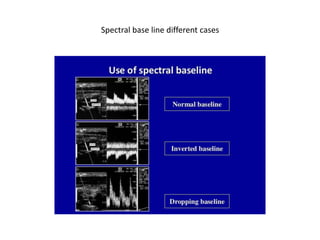
![•
1] Base line
•
1- the base line is depicted on both spectral waveform
•
& the color bar.
•
2- the base line divides the color bar into positive & negative
doppler shifts.
•
3- adjusment of the base line alters the velocity range that is
displayed, & therefor used to prevent aliasis.
•
4- color base line : the position of the base line on the color
bar is indicated by a horizontal black line [yellow circles]
•
slide [25/26]
•](https://image.slidesharecdn.com/dopplerprinciples1-210517111539/85/Doppler-principles-1-23-320.jpg)
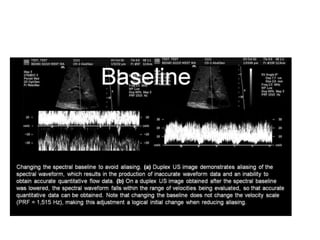
![@ Duplex US image in slide [25] LT image, demonstrates
•
aliasing of the spectral waveform which produced inaccurate
waveform & quantitative flow data.
•
@ same slide [25], RT image, spectral base line is lowered,
which resulted in a spectral waveform falling within the range
of velocities being evaluated, thus obtaining accurate
quantitative flow data.
•
@ changing the base line will not change the velocity scale
[same PRF 1515 Hz], making base line adjustment a logical
initial change when solving aliasing.](https://image.slidesharecdn.com/dopplerprinciples1-210517111539/85/Doppler-principles-1-24-320.jpg)
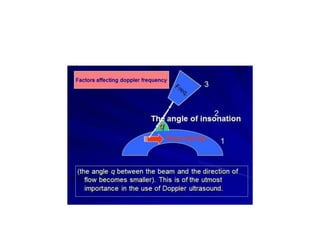
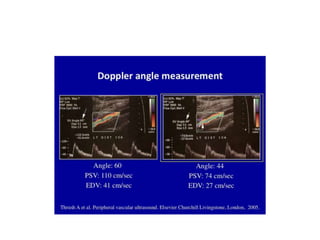
![Angle of insonation is b/w the TXR & vessel being studied.
Doppler angle is b/w US beam & blood flow being measured.
•
2] doppler angle
•
1- doppler Angle is the angle b/w the US beam & blood flow
being measured .
•
2- The angle of insonation [b/w TXR & vessel being studied]
should be b/w 45° & 60° .
•
3- the doppler angle corrects for the usual clinical situation
when an ultrasound beam is not parallel to the Doppler
signal
Slide [30/31]](https://image.slidesharecdn.com/dopplerprinciples1-210517111539/85/Doppler-principles-1-27-320.jpg)
![4- the Doppler angle of insonation has a significant effect on
spectral Doppler velocity measurements.
It is crucial that duplex criteria are standardised with a
fixed angle of insonation and that this angle is consistently
used during velocity estimations.
5- The strongest signal and best waveforms would be at zero
•
degrees. Zero degrees is not usually clinically feasible,
however, so instead the probe is at some angle between
•
0 (parallel) and 90 degrees (perpendicular), when evaluating
the vessel (usually between 30 and 60 degrees).
•
Slide [34/35]](https://image.slidesharecdn.com/dopplerprinciples1-210517111539/85/Doppler-principles-1-28-320.jpg)
![•
6- a higher-frequency doppler signal is obtained if the beam is
alligned more to the direction of flow.
•
7- if the beam flow angle is almost 90^ there is a very poor
doppler signal.
•
8- if the flow is away from the beam, there is a negative
signal
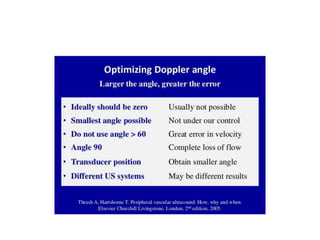
9- the larger the angle, the greater the
error.
•
10- donot use angle > 60^, great error in velocity.
•
11- angle 90^ [perpedicular], complete loss of flow.
•
Slide [35/36]](https://image.slidesharecdn.com/dopplerprinciples1-210517111539/85/Doppler-principles-1-29-320.jpg)
![[A] is more alligned than [B] & produces higher-frquency doppler signals.
[C] is almost 90^ with very poor doppler signal.
[D] is away from the beam & there is a negative shift.](https://image.slidesharecdn.com/dopplerprinciples1-210517111539/85/Doppler-principles-1-30-320.jpg)
![•
•
12- The US machine can correct a Doppler signal appropriately
if the TXR is angled less than 60 degrees from a vessel.
•
It does not, however, know what angle you are using, so you
have to provide this information to the machine, usually via a
knob on the control panel.
•
13- Cosine angle 90^ is zero [0], Cosine angle 0^ is one [1].
Slide [33]](https://image.slidesharecdn.com/dopplerprinciples1-210517111539/85/Doppler-principles-1-32-320.jpg)
![Cosine angle 90^ is zero [0].
Cosine angle 0^ is one [1].](https://image.slidesharecdn.com/dopplerprinciples1-210517111539/85/Doppler-principles-1-33-320.jpg)
![•
Angle correction
•
[slides 36/38/40/41/42]
•
1- angle correction is that the doppler angle b/w the US beam
& the blood flow is being measured, & is used to calibrate the
velocity scale.
•
2- angle correction specifies the true doppler angle by placing
the cursor parallel to the direction of the blood flow.
•
3- the angle of insonation is the angle b/w the TXR & vessel
being studied.
•
4- angle < 60^, difference in speed is 10 – 15%, but
•
angle > 60^, the difference in PSV is 30 – 35%.
•](https://image.slidesharecdn.com/dopplerprinciples1-210517111539/85/Doppler-principles-1-34-320.jpg)
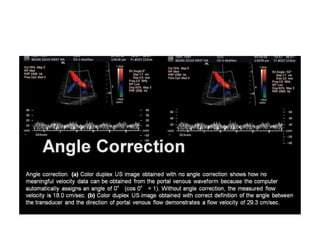
![•
5- in slide [36] LT duplex image : @ obtained with NO angle
correction, shows how NO meaningfull velocity data from
the portal venous waveform, because the computer
automatically assigns an angle of 0^ [cosine 0 = 1].
•
@ without angle corection, the measured flow velocity is
•
18 cm/s.
•
@ same slide [36] duplex RT image obtained with correct
definition of the angle b/w the TXR & direction of portal
venous flow, demonstrates a flow velocity of 29,3 cm/s.
•
Slide [36]
•](https://image.slidesharecdn.com/dopplerprinciples1-210517111539/85/Doppler-principles-1-35-320.jpg)
![•
6- in slide [38]: @ LT duplex image obtained with a 30^
corrected angle, which is too low, demonstrates a flow
velocity of 21.3 cm/s in the portal vein.
•
@ same slide [39] RT image duplex obtained with a 70^
corrected angle, which is too high, demonstrates a flow
velocity of 52.8 m/s in the portal vein, which represents an
overestimation of flow velocity.
•
@ NOTE that, the measured flow velocity increases as the
corrected angle increases.
•
Slide [39]](https://image.slidesharecdn.com/dopplerprinciples1-210517111539/85/Doppler-principles-1-37-320.jpg)

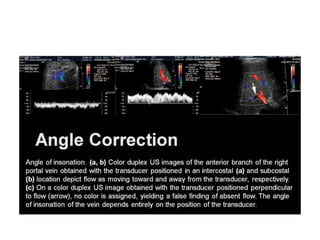
![•
7- in slide [40] LT & middle duplex images of the anterior
branch of the RT portal vein : @ obtained with TXR positioned
in an intercostal location [LT image], & subcostaln [middle
image].
•
@ LT & middle images, depict flow as moving toward & away
from the TXR respectively.
•
@ RT duplex image same slide [41], TXR positioned
perpendicular to flow [arrow], NO color is assigned, yielding
a false finding of absent flow. The angle of insonation of the
vein depends entirely on the position of the TXR.
•
Slide [41]
•](https://image.slidesharecdn.com/dopplerprinciples1-210517111539/85/Doppler-principles-1-39-320.jpg)
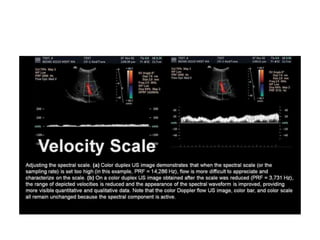
![•
3] velocity scale [PRF]
•
1- velocity scale is the range of flow velocities that are
depicted with either the color or spectral component.
•
2- if the measured flow velocity falls outside the selected
scale, aliasing of the currently active scanning mode will
occur.
•
3- Spectral Doppler echocardiography uses US to record
the velocity, direction, and type of blood flow in the
cardiovascular system.
•](https://image.slidesharecdn.com/dopplerprinciples1-210517111539/85/Doppler-principles-1-43-320.jpg)
![•
4- in a color duplex US image, setting the spectral scale
[sampling rate] too high : e.g PRF 14,286 Hz, flow is more
difficult to appreciate & characterize on the scale.
•
5- in the same duplex image, when the scale [PRF] is reduced
to 3,731 Hz, the appearance of the spectral wave is
improved, providing more visible quantitative & qualititative
data.
•
6- NOTE that the CFD US image, color bar, & color scale, all
remain unchanged because the spectral component is active.
•
Slide [45]](https://image.slidesharecdn.com/dopplerprinciples1-210517111539/85/Doppler-principles-1-44-320.jpg)
![•
7- the spectral waveform typically makes use of 265 pulse
cycles per scan line, & contains qualitative & quantitative
diagnostic information for interpretation.
•
8- on the other hand, the color map contains only 8 pulse
cycles per scan line, thereby providing considerably less
information.
•
slide [47]](https://image.slidesharecdn.com/dopplerprinciples1-210517111539/85/Doppler-principles-1-46-320.jpg)
![Doppler principles [1]](https://image.slidesharecdn.com/dopplerprinciples1-210517111539/85/Doppler-principles-1-47-320.jpg)
![Doppler principles [1]](https://image.slidesharecdn.com/dopplerprinciples1-210517111539/85/Doppler-principles-1-48-320.jpg)


![Doppler principles [2]](https://cdn.slidesharecdn.com/ss_thumbnails/dopplerprinciples2-210517111747-thumbnail.jpg?width=640&height=640&fit=bounds)


![Hepatic doppler us [2]](https://cdn.slidesharecdn.com/ss_thumbnails/hepaticdopplerus2-210813103451-thumbnail.jpg?width=640&height=640&fit=bounds)
![Hepatic doppler us [3]](https://cdn.slidesharecdn.com/ss_thumbnails/hepaticdopplerus3-210813102908-thumbnail.jpg?width=640&height=640&fit=bounds)
![Hepatic dopp us [1]](https://cdn.slidesharecdn.com/ss_thumbnails/hepaticdoppus1-210813101656-thumbnail.jpg?width=640&height=640&fit=bounds)


![Umbilical artery doppler [1]](https://cdn.slidesharecdn.com/ss_thumbnails/umbilicalarterydoppler1-210517112207-thumbnail.jpg?width=640&height=640&fit=bounds)
![Hepatic doppler us [3]](https://cdn.slidesharecdn.com/ss_thumbnails/hepaticdopplerus3-210517111042-thumbnail.jpg?width=640&height=640&fit=bounds)
![Hepatic doppler us [2]](https://cdn.slidesharecdn.com/ss_thumbnails/hepaticdopplerus2-210517110832-thumbnail.jpg?width=640&height=640&fit=bounds)
![Hepatic dopp us [1]](https://cdn.slidesharecdn.com/ss_thumbnails/hepaticdoppus1-210517110108-thumbnail.jpg?width=640&height=640&fit=bounds)


![CASE_PRESENTATION_ON_subdural_hematoma(SDH)[1 FINAL PPT]-1.pptx](https://cdn.slidesharecdn.com/ss_thumbnails/casepresentationonsubduralhematomasdh1finalppt-1-260129172522-d405d375-thumbnail.jpg?width=640&height=640&fit=bounds)

