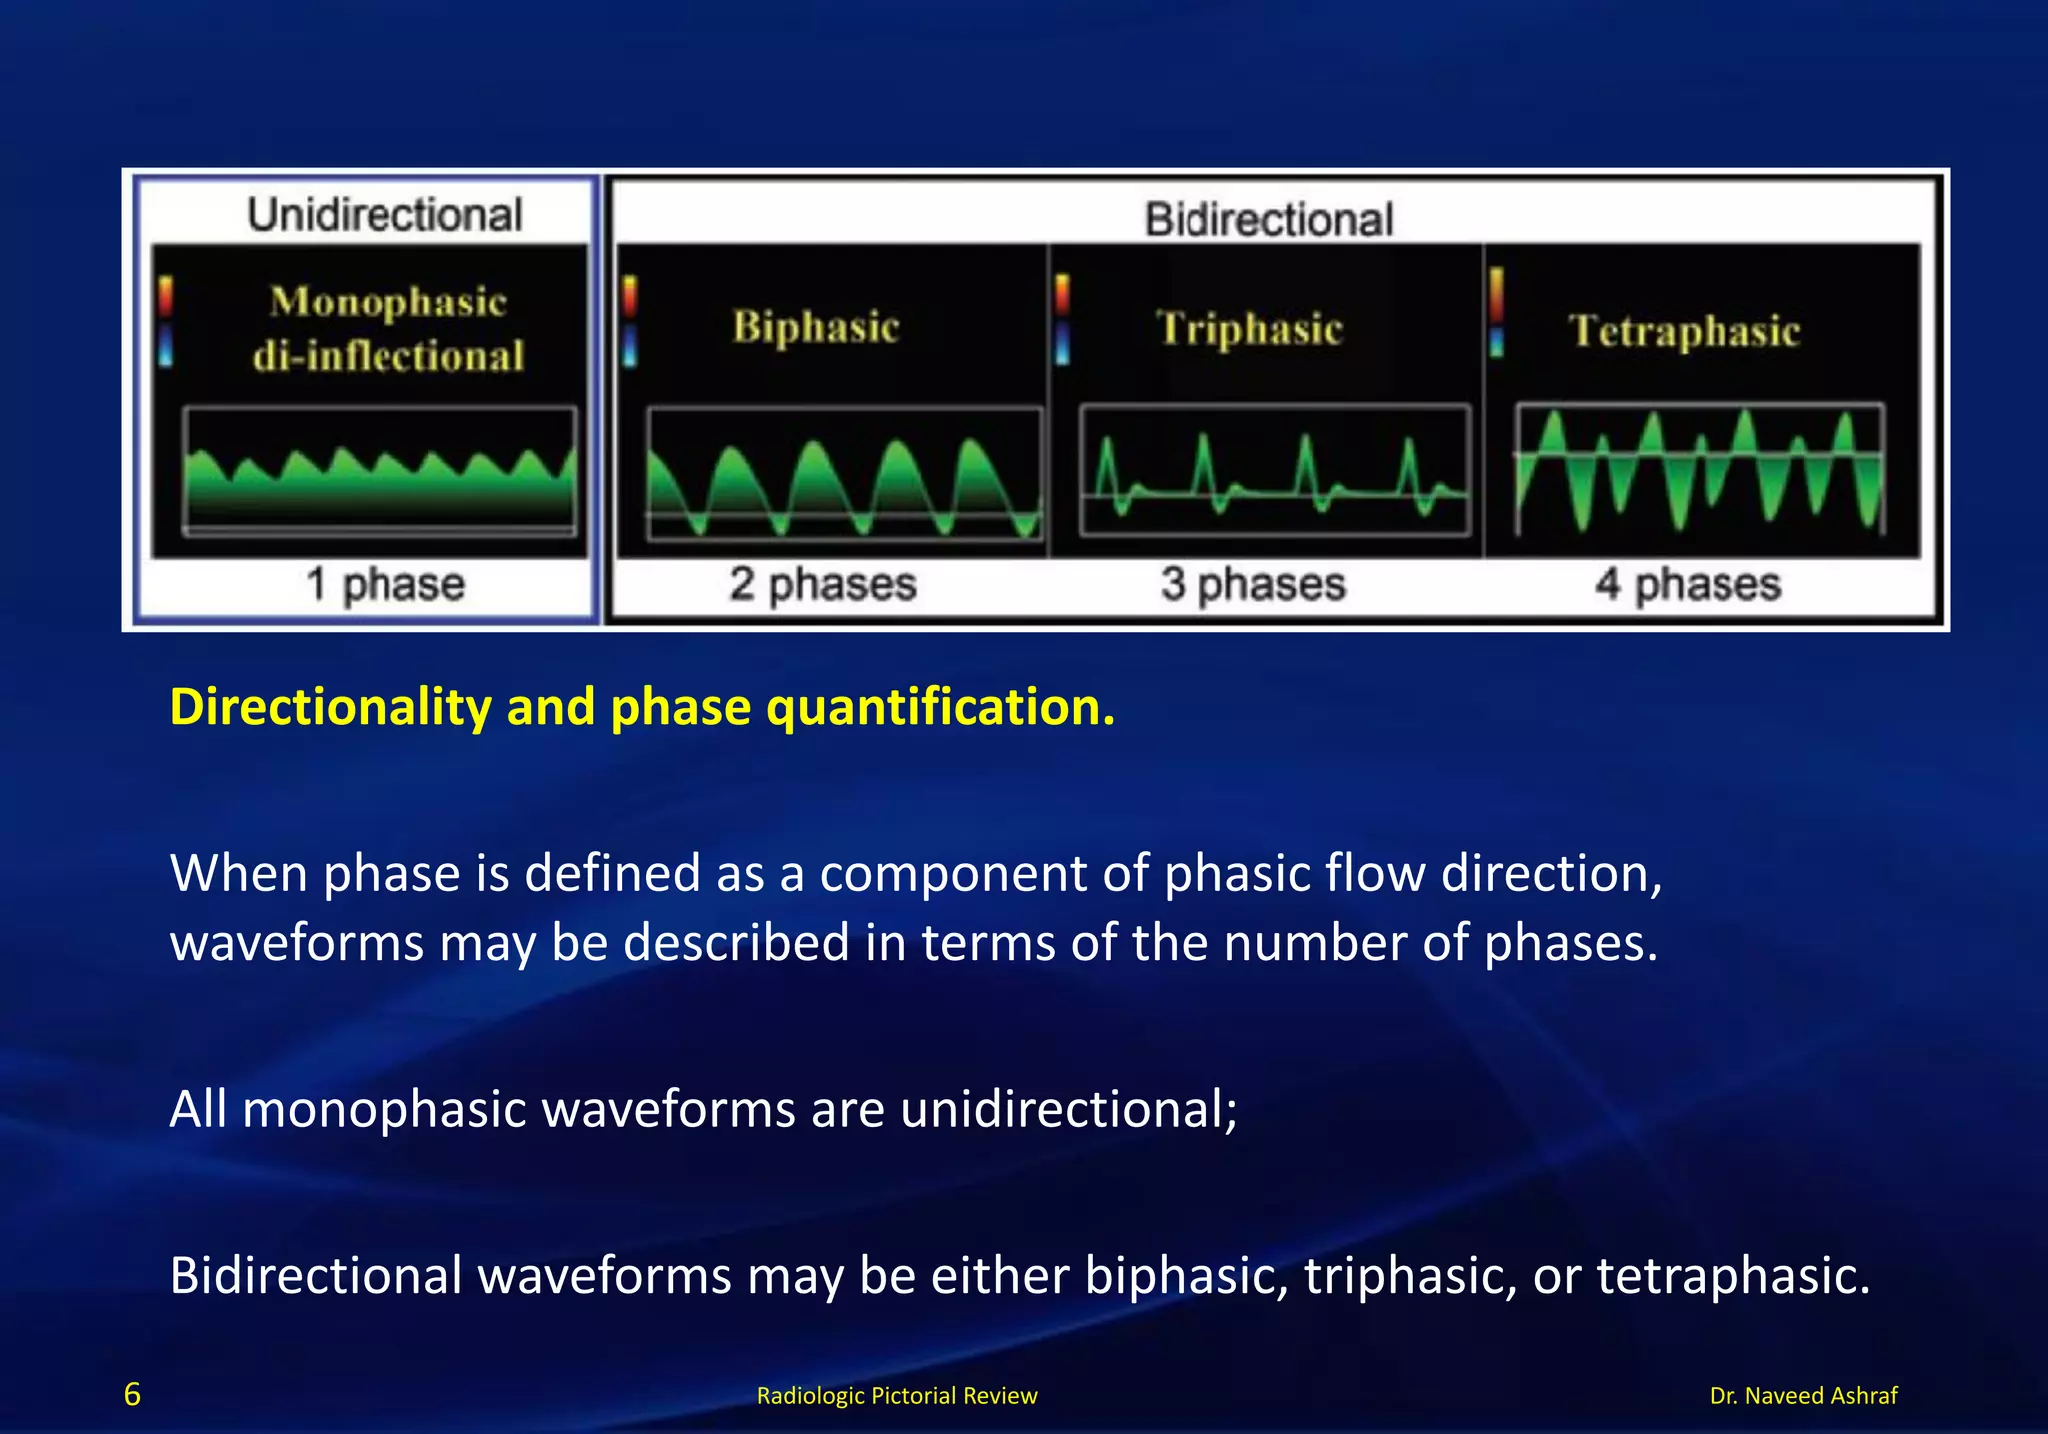
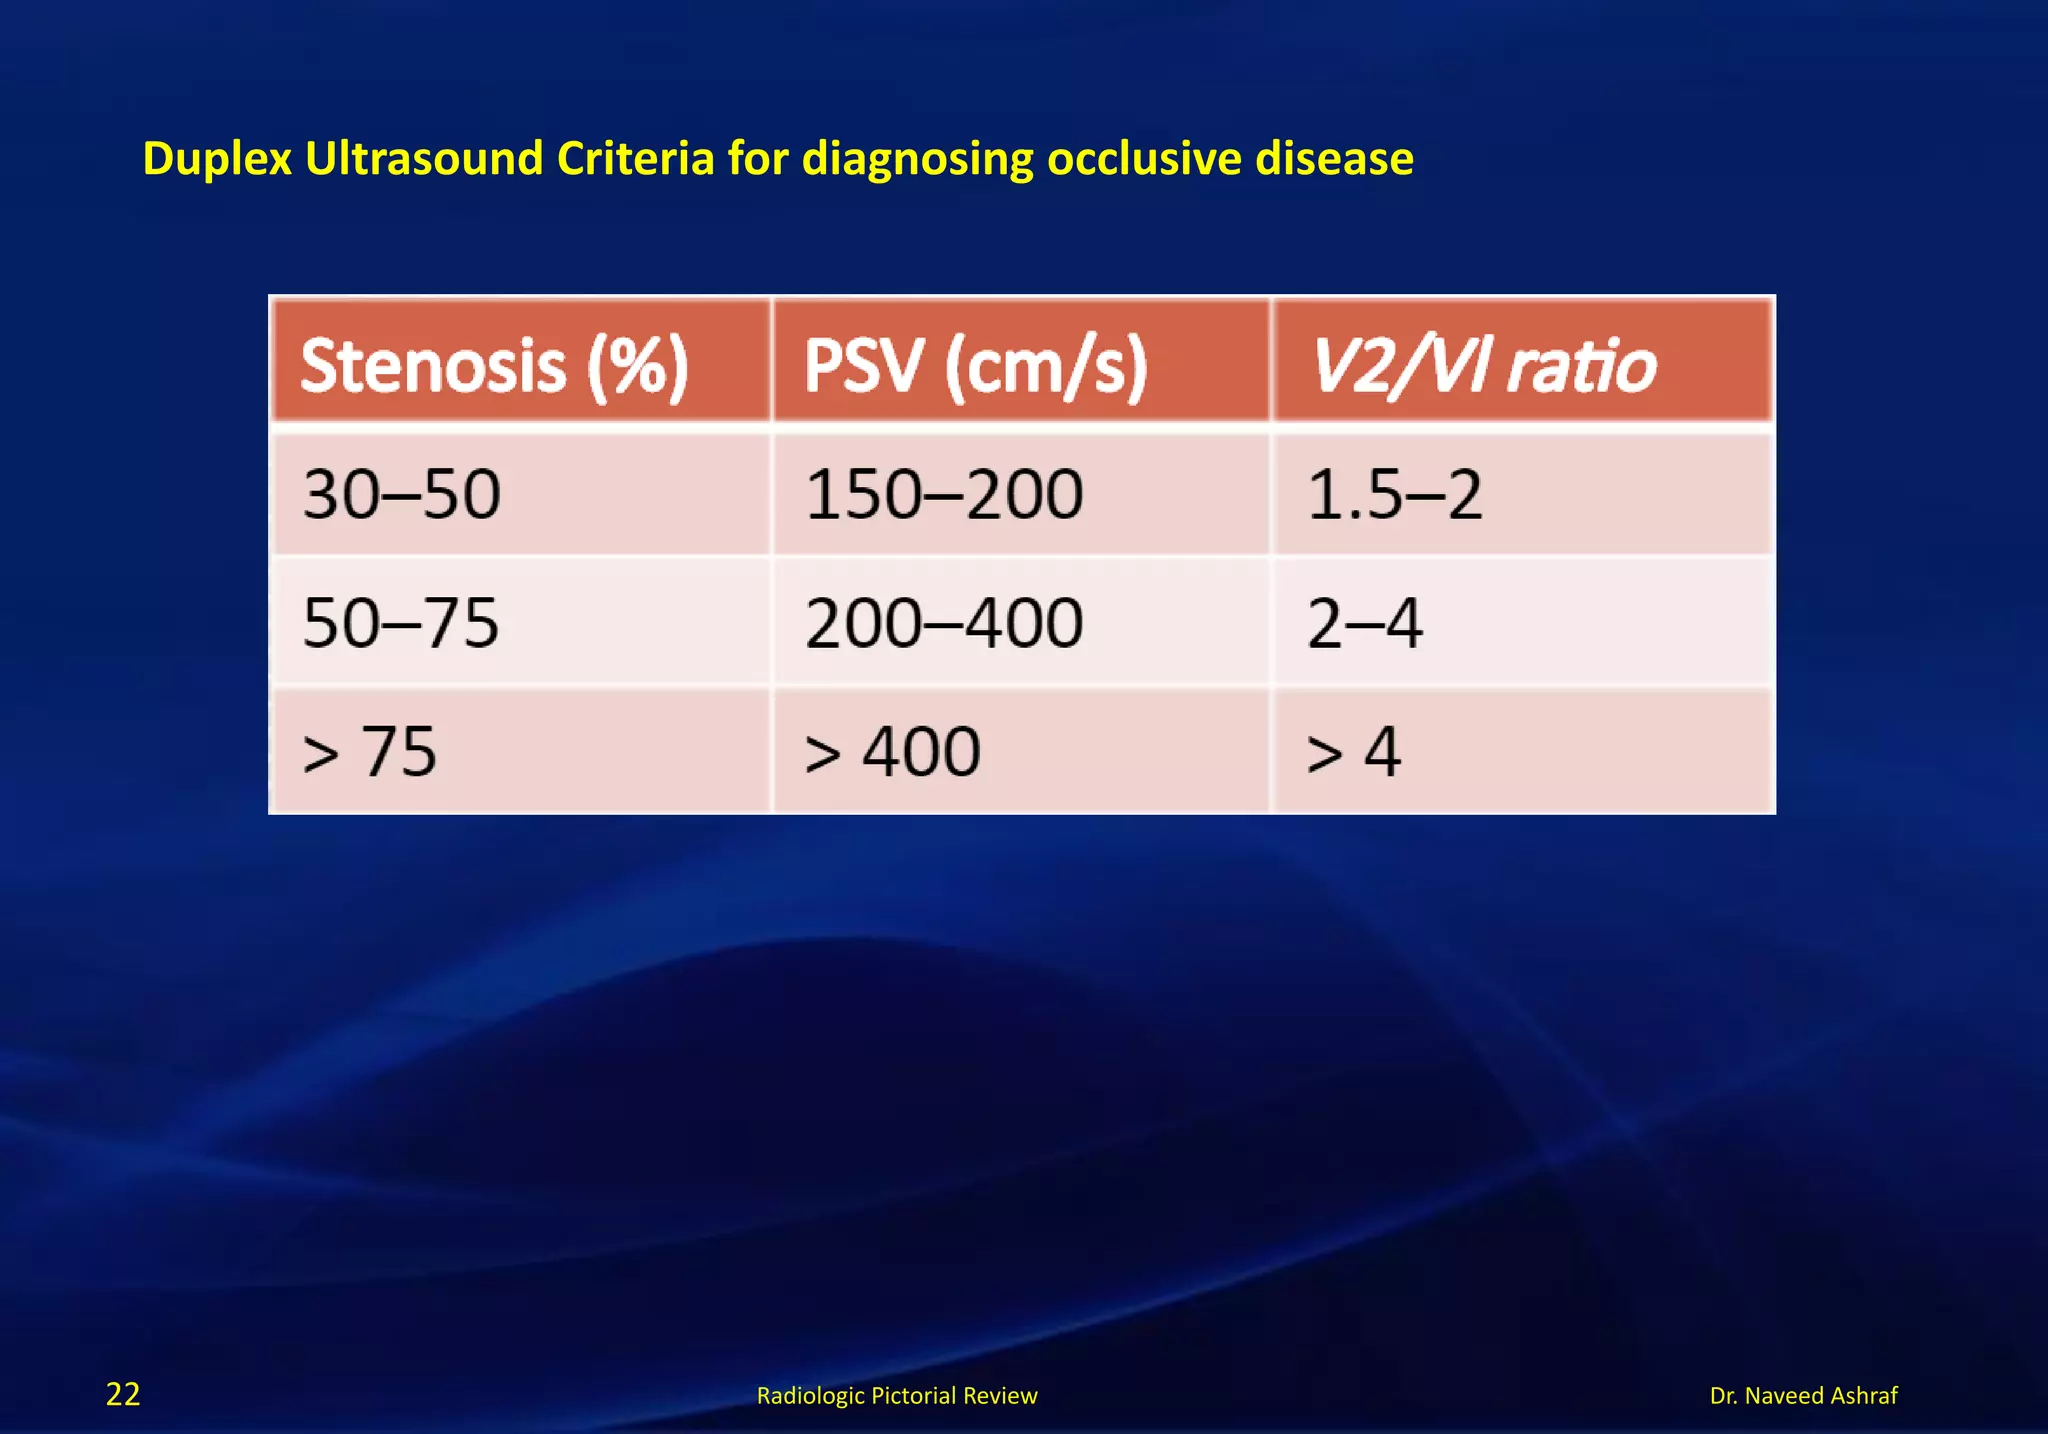
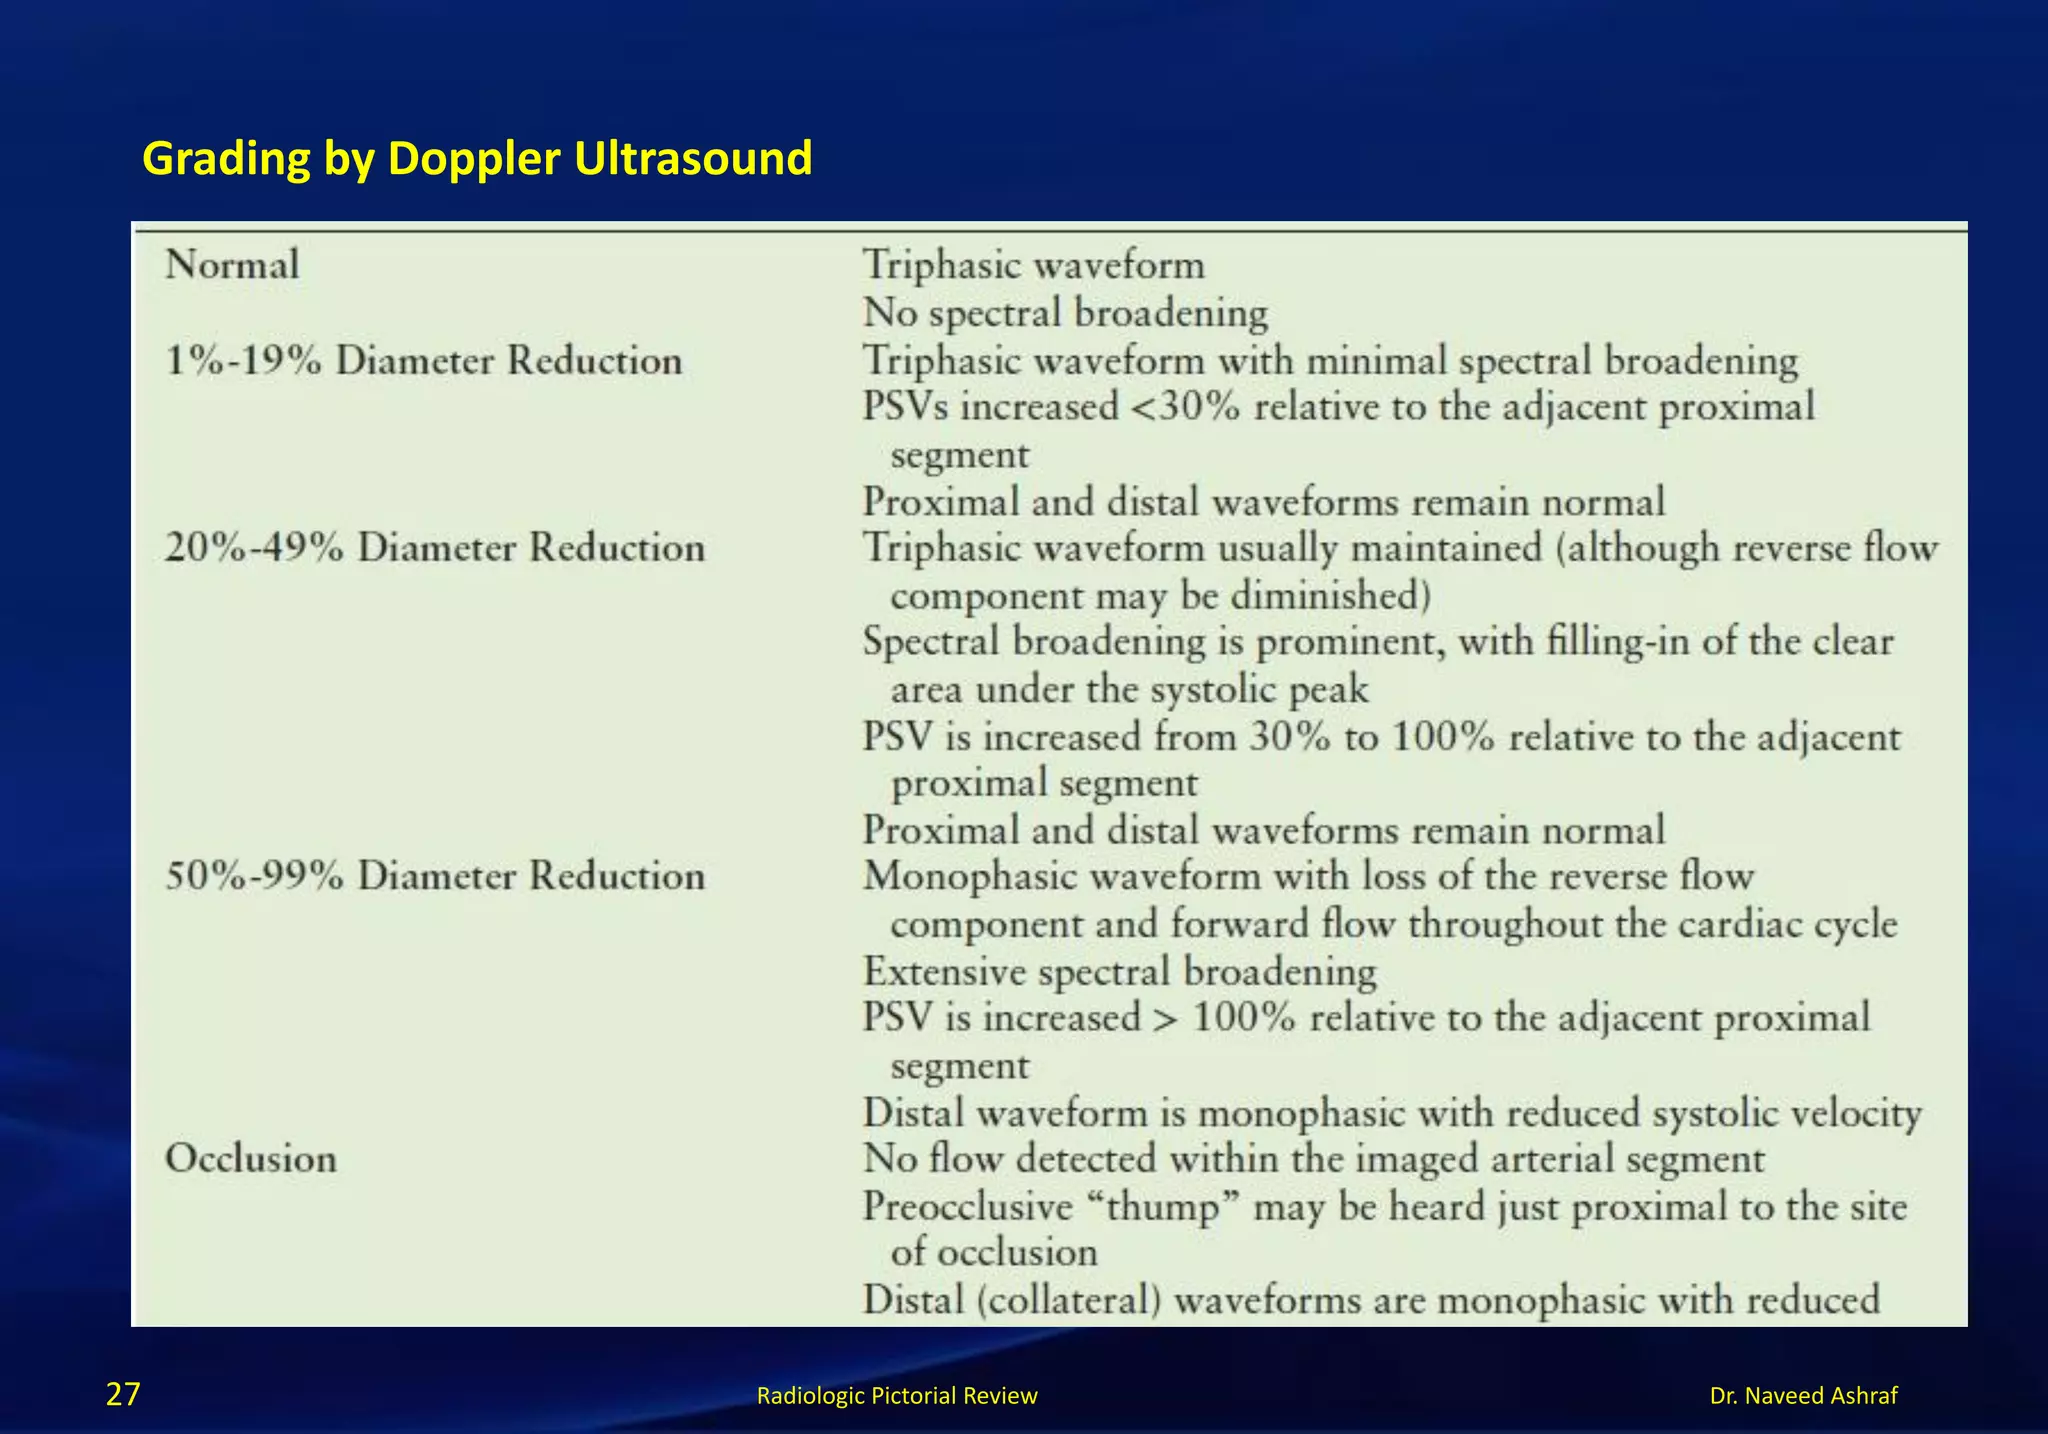
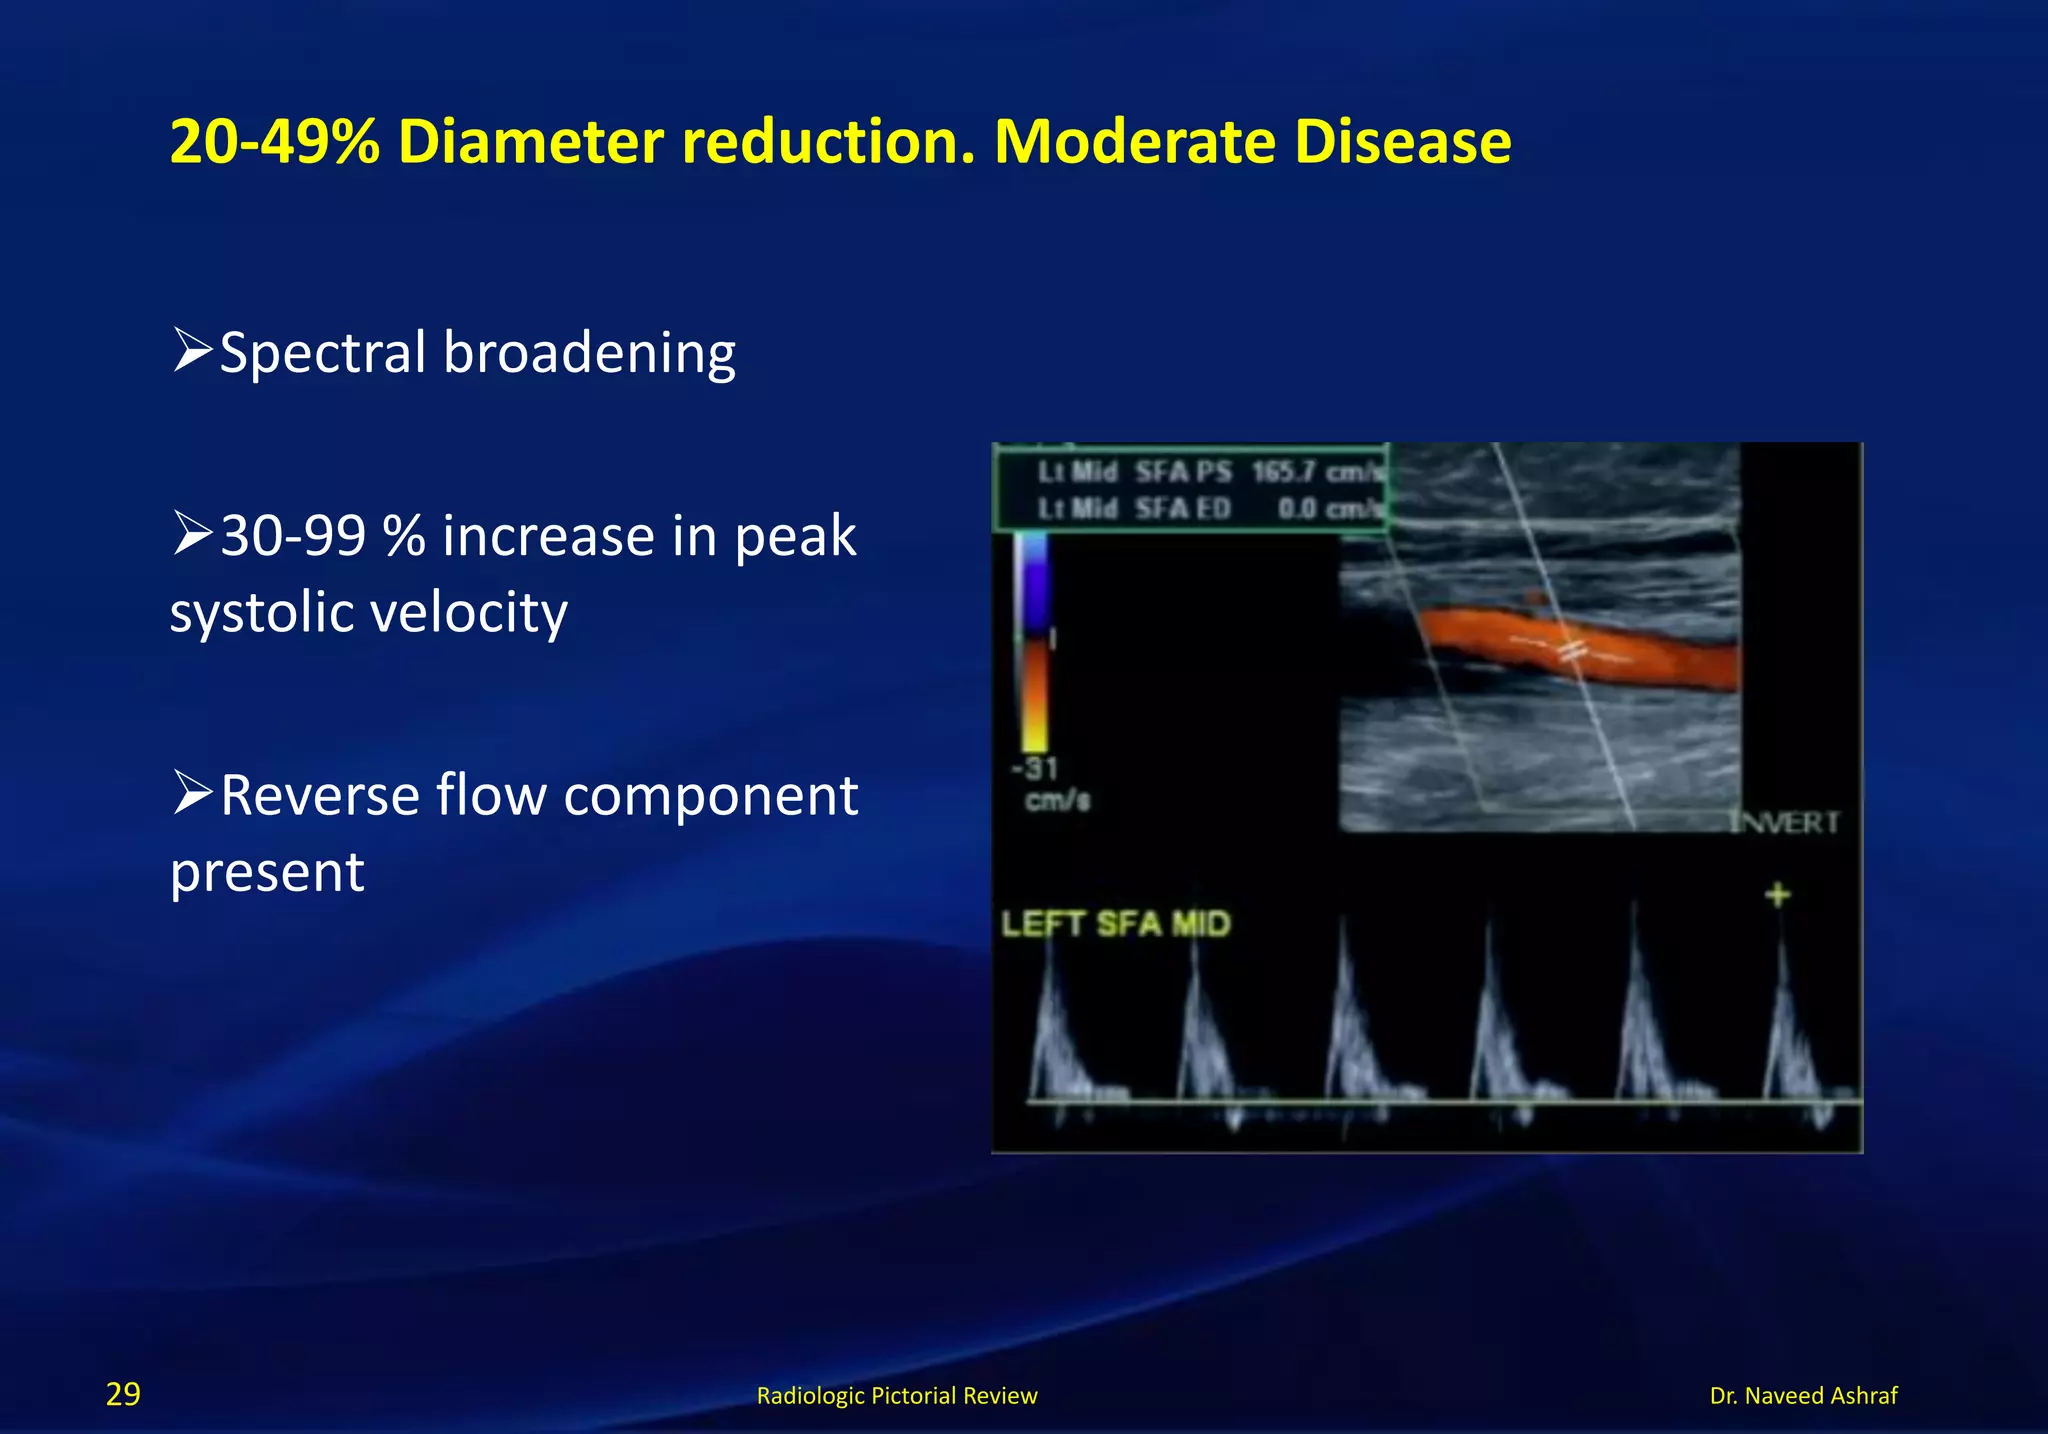
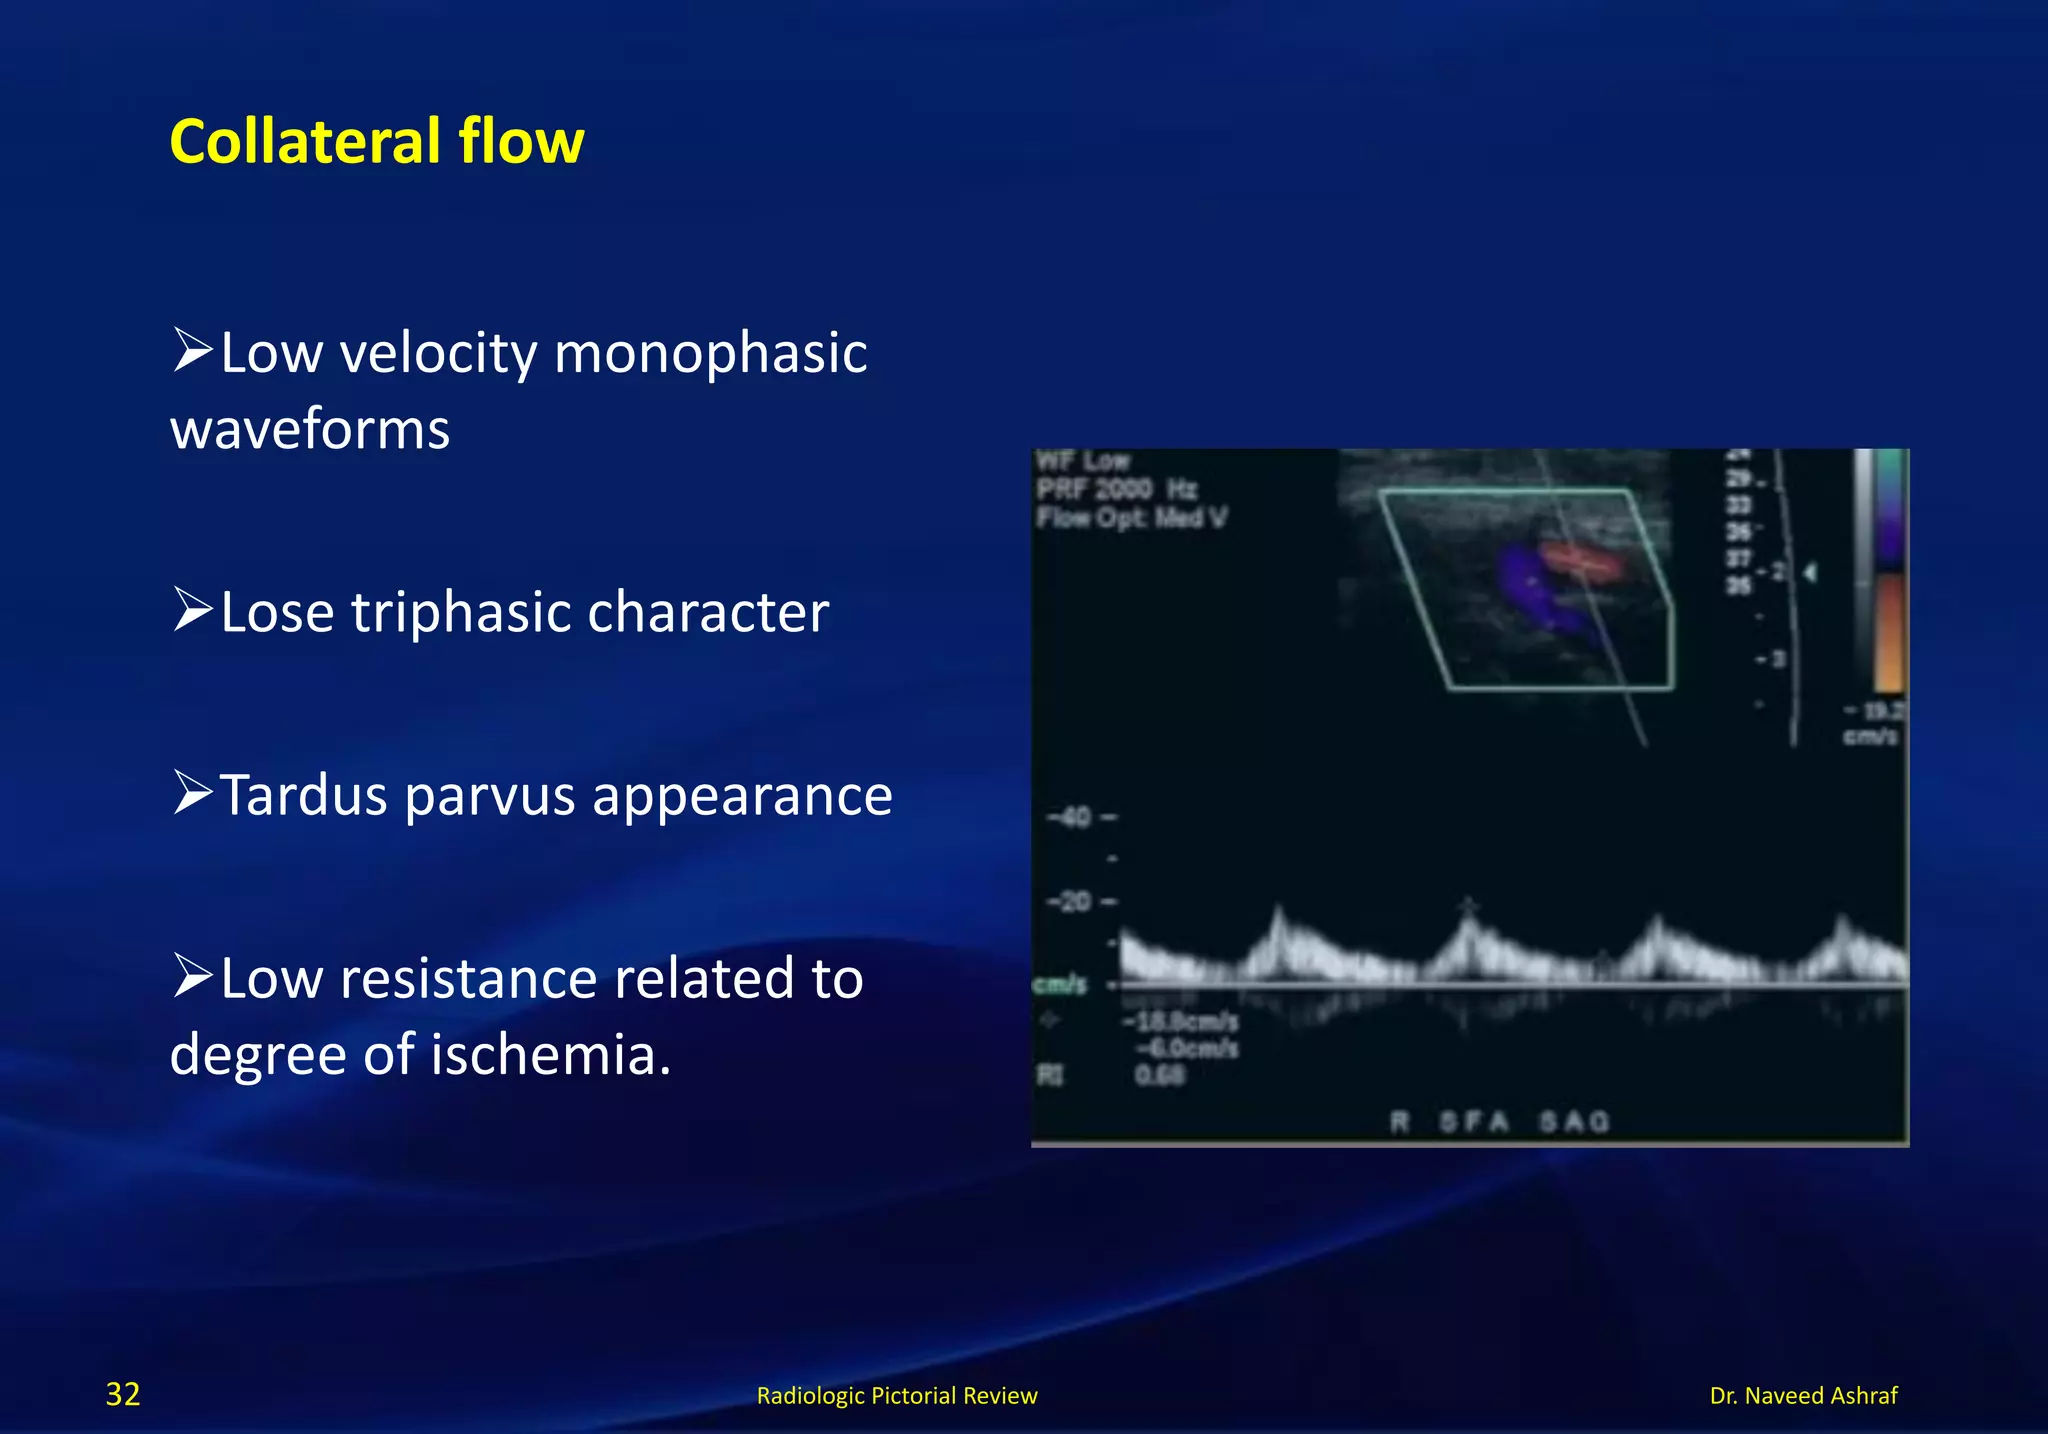
Dr. Naveed AshrafRadiologic Pictorial Review
Doppler Ultrasound In
Peripheral Arterial Disease
Dr. Naveed Ashraf
1
Dr. Naveed AshrafRadiologic Pictorial Review
Understanding Various Waveforms
2
Dr. Naveed AshrafRadiologic Pictorial Review
Cardiac phasicity creates a phasic cycle, which is composed of phases as determined by the
number of times blood flows in each direction at the baseline. The baseline (x = 0) separates
one direction from another.
Moving from left to right along the x-axis corresponds to moving forward in time. Moving
away from the baseline vertically along the y-axis in either direction corresponds to increasing
velocities.
Any given point on the waveform corresponds to a specific velocity. The slope of the curve
corresponds to acceleration (ie, a change in velocity per unit time).
A bend in the curve, or inflection point, corresponds to a change in acceleration. When these
turns are abrupt, they generate audible sounds at Doppler US.
3
Dr. Naveed AshrafRadiologic Pictorial Review
Antegrade versus retrograde flow.
Flow towards the transducer is displayed above the baseline and flow away
from the transducer is displayed below the base line.
Antegrade flow may be either toward the transducer ( as in hepatic artery) or
away from the transducer (as in hepatic vein).
Thus antegrade and retorgrade flow correspond to the vessel of interrogation
and not to the transducer.
4
Dr. Naveed AshrafRadiologic Pictorial Review
Phasicity.
Note that pulsatile, phasic, and nonphasic flow waveforms all have phasicity.
Pulsatile flow is exaggerated phasicity, which is normally seen in arteries but
can also be seen in diseased veins.
Nonphasic flow does in fact have a phase (of 1); however, the phase has no
velocity variation (nonphasic could be thought of as meaning “nonvariation”).
The term aphasic literally means “without phase,” which is the case when
there is no flow.
5
Dr. Naveed AshrafRadiologic Pictorial Review
Directionality and phase quantification.
When phase is defined as a component of phasic flow direction,
waveforms may be described in terms of the number of phases.
All monophasic waveforms are unidirectional;
Bidirectional waveforms may be either biphasic, triphasic, or tetraphasic.
6
Dr. Naveed AshrafRadiologic Pictorial Review
High- versus low-resistance arteries.
Schematics illustrate that a high-resistance artery (left) allows less blood flow
during end diastole (the trough is lower) than does a low-resistance artery
(right).
These visual findings are confirmed by calculating an RI. High-resistance
arteries normally have RIs over 0.7, whereas low-resistance arteries have RIs
ranging from 0.55 to 0.7.
7
Dr. Naveed AshrafRadiologic Pictorial Review8
Dr. Naveed AshrafRadiologic Pictorial Review
In the proximal aorta, plug flow results in a thin waveform and a clear
spectral window. Note the actual windows (yellow) superimposed on the
first two spectral windows.
9
“Spectral window” and spectral broadening.
Dr. Naveed AshrafRadiologic Pictorial Review
In vessels smaller than the aorta, blood flow is laminar. In large and
medium-sized vessel, the waveform is thick, but there is still a spectral
window (middle right).
10
“Spectral window” and spectral broadening.
Dr. Naveed AshrafRadiologic Pictorial Review
In small or compressed vessels, there is significant spectral broadening,
which obscures the spectral window. Diseased vessels with turbulent
flow (bottom left) also cause spectral broadening (bottom right).
11
“Spectral window” and spectral broadening.
Dr. Naveed AshrafRadiologic Pictorial Review12
“Spectral window” and spectral broadening.
Dr. Naveed AshrafRadiologic Pictorial Review
Diagram illustrates how the direction of a “stream” is determined by
the direction of flow.
Upstream refers to blood that has not yet passed a reference point,
whereas downstream refers to blood that has already passed the
reference point.
Transducer A is located upstream of the stenosis and transducer B is
located downstream.
13
Dr. Naveed AshrafRadiologic Pictorial Review
Flow dynamics in high-grade stenosis.
Note that velocities are increased within a stenotic portion of a vessel, and
that the RI is increased when the stenosis is downstream but decreased when
the stenosis is upstream.
A waveform whose contour is affected by an upstream stenosis is often
described as a tardus-parvus waveform.
14
Dr. Naveed AshrafRadiologic Pictorial Review
Diagram illustrates upstream stenosis (tardus-parvus waveform).
When it is apparent that the peak is too late (tardus) and too low
(parvus), use of the term is appropriate. This finding occurs only
downstream from a stenosis (ie, due to upstream stenosis).
15
Dr. Naveed AshrafRadiologic Pictorial Review
Initial assessment is done with ABI
16
Dr. Naveed Ashraf
Teaching Points
Radiologic Pictorial Review17
The ankle brachial index is important way to diagnose peripheral vascular disease. The
index compares the systolic blood pressures of the arms and legs to give a ratio that can
suggest various severity of peripheral vascular disease.
An ABI less than 0.90 is diagnostic for PAD in patients with claudication or other signs of
ischemia, with 95% sensitivity and 100% specificity.
•A proximal-to-distal decrease in sequential pressures greater than 20 mm Hg or a
decrease in segmental-brachial index greater than 0.15 indicates occlusive disease and
correlates with the level of the lesion. •
A normal lower extremity arterial Doppler velocity tracing is triphasic, with a sharp
upstroke and peaked systolic component, an early diastolic component with reversal of
flow, and a late diastolic component with forward flow. A biphasic signal is considered
abnormal if there is a clear transition from triphasic signal along the vascular tree.
Monophasic waveforms are always considered abnormal. •
Dr. Naveed AshrafRadiologic Pictorial Review
ABI > 1, Normal
ABI > 0.5, Single segment
disease
ABI < 0.5, Multi-segment
disease
ABI <0.35, Concern about
tissue loss.
18
Ankle Bracheal Index is high indicator of PVD
Dr. Naveed AshrafRadiologic Pictorial Review
Classification of chronic limb ischemia
19
Dr. Naveed AshrafRadiologic Pictorial Review20
Normal diameters of lower limb vessels.
Dr. Naveed AshrafRadiologic Pictorial Review21
Normal velocites in lower limb arteries
Dr. Naveed AshrafRadiologic Pictorial Review22
Duplex Ultrasound Criteria for diagnosing occlusive disease
Dr. Naveed AshrafRadiologic Pictorial Review
Bifurcation Points.
Aortic bifurcation
Common femoral
bifurcation
Popliteal trifurcation
Distal superficial femoral
artery
Tibial arteries.
23
Common sites for atherosclerotic disease
Dr. Naveed AshrafRadiologic Pictorial Review
Triphasic Waveform.
Initial high velocity forward flow
component indicating systole.
Early diastolic reverse flow
component due to peripheral
resistance.
Late diastolic forward component
due to elastic recoil.
Narrow systolic window
Normal velocity range.
24
Normal Peripheral Arterial Waveform
Dr. Naveed AshrafRadiologic Pictorial Review
Waveform Shape
Peak systolic velocity
Spectral window
25
Components to look for in stenosis
Dr. Naveed AshrafRadiologic Pictorial Review
Criteria for the classification of peripheral arterial stenosis
1-19% diameter reduction minimal disease
20-49% diameter reduction moderate disease
50-99% diameter reduction significant disease
Occlusion
26
Dr. Naveed AshrafRadiologic Pictorial Review27
Grading by Doppler Ultrasound
Dr. Naveed AshrafRadiologic Pictorial Review
Mild spectral broadening
1-29 % increase in peak
systolic velocity
Normal waveform.
28
1-19% Diameter reduction. Minimal Disease
Dr. Naveed AshrafRadiologic Pictorial Review
Spectral broadening
30-99 % increase in peak
systolic velocity
Reverse flow component
present
29
20-49% Diameter reduction. Moderate Disease
Dr. Naveed AshrafRadiologic Pictorial Review
Loss of reverse flow
component (Mono-phasic flow)
Marked spectral broadening
100% increase in systolic
velocity
Monophasic waveform
Post-stenotic turbulence.
30
50-99% Diameter reduction. Significant Disease
Dr. Naveed AshrafRadiologic Pictorial Review
Absence of flow in occlusion
Proximal flow is high
resistance
Distal flow is low resistance
with tardus pattern
Collateral flow
31
Occlusion
Dr. Naveed AshrafRadiologic Pictorial Review
Low velocity monophasic
waveforms
Lose triphasic character
Tardus parvus appearance
Low resistance related to
degree of ischemia.
32
Collateral flow
Dr. Naveed AshrafRadiologic Pictorial Review
Focal color flow change at the
side of stenosis (Aliasing).
Color bruit due to peri-vascular
tissue vibration
Color mosaic pattern due to post
stenotic turbulence.
33
Color flow findings in peripheral arterial disease
Dr. Naveed AshrafRadiologic Pictorial Review
Focal color flow change at the
side of stenosis (Aliasing).
Color bruit due to peri-vascular
tissue vibration
Color mosaic pattern due to post
stenotic turbulence.
34
Color flow findings in peripheral arterial disease
Dr. Naveed AshrafRadiologic Pictorial Review
Focal color flow change at the
side of stenosis (Aliasing).
Color bruit due to peri-vascular
tissue vibration
Color mosaic pattern due to post
stenotic turbulence in collateral
vessel.
35
Color flow findings in peripheral arterial disease
Dr. Naveed AshrafRadiologic Pictorial Review
Elevated peak systolic
velocites in stenosis
Loss of diastolic reversal in
stenosis
Bruit
Tardus parvus waveforms
distal to high grade stenosis.
36
Pulse Doppler findings in peripheral arterial disease
Dr. Naveed AshrafRadiologic Pictorial Review37
Spectrum at and below the level of stenosis
High peak systolic velicity
Tardus Parvus waveform

Doppler ultrasound in peripheral arterial disease

  • 1.
    Dr. Naveed AshrafRadiologicPictorial Review Doppler Ultrasound In Peripheral Arterial Disease Dr. Naveed Ashraf 1
  • 2.
    Dr. Naveed AshrafRadiologicPictorial Review Understanding Various Waveforms 2
  • 3.
    Dr. Naveed AshrafRadiologicPictorial Review Cardiac phasicity creates a phasic cycle, which is composed of phases as determined by the number of times blood flows in each direction at the baseline. The baseline (x = 0) separates one direction from another. Moving from left to right along the x-axis corresponds to moving forward in time. Moving away from the baseline vertically along the y-axis in either direction corresponds to increasing velocities. Any given point on the waveform corresponds to a specific velocity. The slope of the curve corresponds to acceleration (ie, a change in velocity per unit time). A bend in the curve, or inflection point, corresponds to a change in acceleration. When these turns are abrupt, they generate audible sounds at Doppler US. 3
  • 4.
    Dr. Naveed AshrafRadiologicPictorial Review Antegrade versus retrograde flow. Flow towards the transducer is displayed above the baseline and flow away from the transducer is displayed below the base line. Antegrade flow may be either toward the transducer ( as in hepatic artery) or away from the transducer (as in hepatic vein). Thus antegrade and retorgrade flow correspond to the vessel of interrogation and not to the transducer. 4
  • 5.
    Dr. Naveed AshrafRadiologicPictorial Review Phasicity. Note that pulsatile, phasic, and nonphasic flow waveforms all have phasicity. Pulsatile flow is exaggerated phasicity, which is normally seen in arteries but can also be seen in diseased veins. Nonphasic flow does in fact have a phase (of 1); however, the phase has no velocity variation (nonphasic could be thought of as meaning “nonvariation”). The term aphasic literally means “without phase,” which is the case when there is no flow. 5
  • 6.
    Dr. Naveed AshrafRadiologicPictorial Review Directionality and phase quantification. When phase is defined as a component of phasic flow direction, waveforms may be described in terms of the number of phases. All monophasic waveforms are unidirectional; Bidirectional waveforms may be either biphasic, triphasic, or tetraphasic. 6
  • 7.
    Dr. Naveed AshrafRadiologicPictorial Review High- versus low-resistance arteries. Schematics illustrate that a high-resistance artery (left) allows less blood flow during end diastole (the trough is lower) than does a low-resistance artery (right). These visual findings are confirmed by calculating an RI. High-resistance arteries normally have RIs over 0.7, whereas low-resistance arteries have RIs ranging from 0.55 to 0.7. 7
  • 8.
    Dr. Naveed AshrafRadiologicPictorial Review8
  • 9.
    Dr. Naveed AshrafRadiologicPictorial Review In the proximal aorta, plug flow results in a thin waveform and a clear spectral window. Note the actual windows (yellow) superimposed on the first two spectral windows. 9 “Spectral window” and spectral broadening.
  • 10.
    Dr. Naveed AshrafRadiologicPictorial Review In vessels smaller than the aorta, blood flow is laminar. In large and medium-sized vessel, the waveform is thick, but there is still a spectral window (middle right). 10 “Spectral window” and spectral broadening.
  • 11.
    Dr. Naveed AshrafRadiologicPictorial Review In small or compressed vessels, there is significant spectral broadening, which obscures the spectral window. Diseased vessels with turbulent flow (bottom left) also cause spectral broadening (bottom right). 11 “Spectral window” and spectral broadening.
  • 12.
    Dr. Naveed AshrafRadiologicPictorial Review12 “Spectral window” and spectral broadening.
  • 13.
    Dr. Naveed AshrafRadiologicPictorial Review Diagram illustrates how the direction of a “stream” is determined by the direction of flow. Upstream refers to blood that has not yet passed a reference point, whereas downstream refers to blood that has already passed the reference point. Transducer A is located upstream of the stenosis and transducer B is located downstream. 13
  • 14.
    Dr. Naveed AshrafRadiologicPictorial Review Flow dynamics in high-grade stenosis. Note that velocities are increased within a stenotic portion of a vessel, and that the RI is increased when the stenosis is downstream but decreased when the stenosis is upstream. A waveform whose contour is affected by an upstream stenosis is often described as a tardus-parvus waveform. 14
  • 15.
    Dr. Naveed AshrafRadiologicPictorial Review Diagram illustrates upstream stenosis (tardus-parvus waveform). When it is apparent that the peak is too late (tardus) and too low (parvus), use of the term is appropriate. This finding occurs only downstream from a stenosis (ie, due to upstream stenosis). 15
  • 16.
    Dr. Naveed AshrafRadiologicPictorial Review Initial assessment is done with ABI 16
  • 17.
    Dr. Naveed Ashraf TeachingPoints Radiologic Pictorial Review17 The ankle brachial index is important way to diagnose peripheral vascular disease. The index compares the systolic blood pressures of the arms and legs to give a ratio that can suggest various severity of peripheral vascular disease. An ABI less than 0.90 is diagnostic for PAD in patients with claudication or other signs of ischemia, with 95% sensitivity and 100% specificity. •A proximal-to-distal decrease in sequential pressures greater than 20 mm Hg or a decrease in segmental-brachial index greater than 0.15 indicates occlusive disease and correlates with the level of the lesion. • A normal lower extremity arterial Doppler velocity tracing is triphasic, with a sharp upstroke and peaked systolic component, an early diastolic component with reversal of flow, and a late diastolic component with forward flow. A biphasic signal is considered abnormal if there is a clear transition from triphasic signal along the vascular tree. Monophasic waveforms are always considered abnormal. •
  • 18.
    Dr. Naveed AshrafRadiologicPictorial Review ABI > 1, Normal ABI > 0.5, Single segment disease ABI < 0.5, Multi-segment disease ABI <0.35, Concern about tissue loss. 18 Ankle Bracheal Index is high indicator of PVD
  • 19.
    Dr. Naveed AshrafRadiologicPictorial Review Classification of chronic limb ischemia 19
  • 20.
    Dr. Naveed AshrafRadiologicPictorial Review20 Normal diameters of lower limb vessels.
  • 21.
    Dr. Naveed AshrafRadiologicPictorial Review21 Normal velocites in lower limb arteries
  • 22.
    Dr. Naveed AshrafRadiologicPictorial Review22 Duplex Ultrasound Criteria for diagnosing occlusive disease
  • 23.
    Dr. Naveed AshrafRadiologicPictorial Review Bifurcation Points. Aortic bifurcation Common femoral bifurcation Popliteal trifurcation Distal superficial femoral artery Tibial arteries. 23 Common sites for atherosclerotic disease
  • 24.
    Dr. Naveed AshrafRadiologicPictorial Review Triphasic Waveform. Initial high velocity forward flow component indicating systole. Early diastolic reverse flow component due to peripheral resistance. Late diastolic forward component due to elastic recoil. Narrow systolic window Normal velocity range. 24 Normal Peripheral Arterial Waveform
  • 25.
    Dr. Naveed AshrafRadiologicPictorial Review Waveform Shape Peak systolic velocity Spectral window 25 Components to look for in stenosis
  • 26.
    Dr. Naveed AshrafRadiologicPictorial Review Criteria for the classification of peripheral arterial stenosis 1-19% diameter reduction minimal disease 20-49% diameter reduction moderate disease 50-99% diameter reduction significant disease Occlusion 26
  • 27.
    Dr. Naveed AshrafRadiologicPictorial Review27 Grading by Doppler Ultrasound
  • 28.
    Dr. Naveed AshrafRadiologicPictorial Review Mild spectral broadening 1-29 % increase in peak systolic velocity Normal waveform. 28 1-19% Diameter reduction. Minimal Disease
  • 29.
    Dr. Naveed AshrafRadiologicPictorial Review Spectral broadening 30-99 % increase in peak systolic velocity Reverse flow component present 29 20-49% Diameter reduction. Moderate Disease
  • 30.
    Dr. Naveed AshrafRadiologicPictorial Review Loss of reverse flow component (Mono-phasic flow) Marked spectral broadening 100% increase in systolic velocity Monophasic waveform Post-stenotic turbulence. 30 50-99% Diameter reduction. Significant Disease
  • 31.
    Dr. Naveed AshrafRadiologicPictorial Review Absence of flow in occlusion Proximal flow is high resistance Distal flow is low resistance with tardus pattern Collateral flow 31 Occlusion
  • 32.
    Dr. Naveed AshrafRadiologicPictorial Review Low velocity monophasic waveforms Lose triphasic character Tardus parvus appearance Low resistance related to degree of ischemia. 32 Collateral flow
  • 33.
    Dr. Naveed AshrafRadiologicPictorial Review Focal color flow change at the side of stenosis (Aliasing). Color bruit due to peri-vascular tissue vibration Color mosaic pattern due to post stenotic turbulence. 33 Color flow findings in peripheral arterial disease
  • 34.
    Dr. Naveed AshrafRadiologicPictorial Review Focal color flow change at the side of stenosis (Aliasing). Color bruit due to peri-vascular tissue vibration Color mosaic pattern due to post stenotic turbulence. 34 Color flow findings in peripheral arterial disease
  • 35.
    Dr. Naveed AshrafRadiologicPictorial Review Focal color flow change at the side of stenosis (Aliasing). Color bruit due to peri-vascular tissue vibration Color mosaic pattern due to post stenotic turbulence in collateral vessel. 35 Color flow findings in peripheral arterial disease
  • 36.
    Dr. Naveed AshrafRadiologicPictorial Review Elevated peak systolic velocites in stenosis Loss of diastolic reversal in stenosis Bruit Tardus parvus waveforms distal to high grade stenosis. 36 Pulse Doppler findings in peripheral arterial disease
  • 37.
    Dr. Naveed AshrafRadiologicPictorial Review37 Spectrum at and below the level of stenosis High peak systolic velicity Tardus Parvus waveform