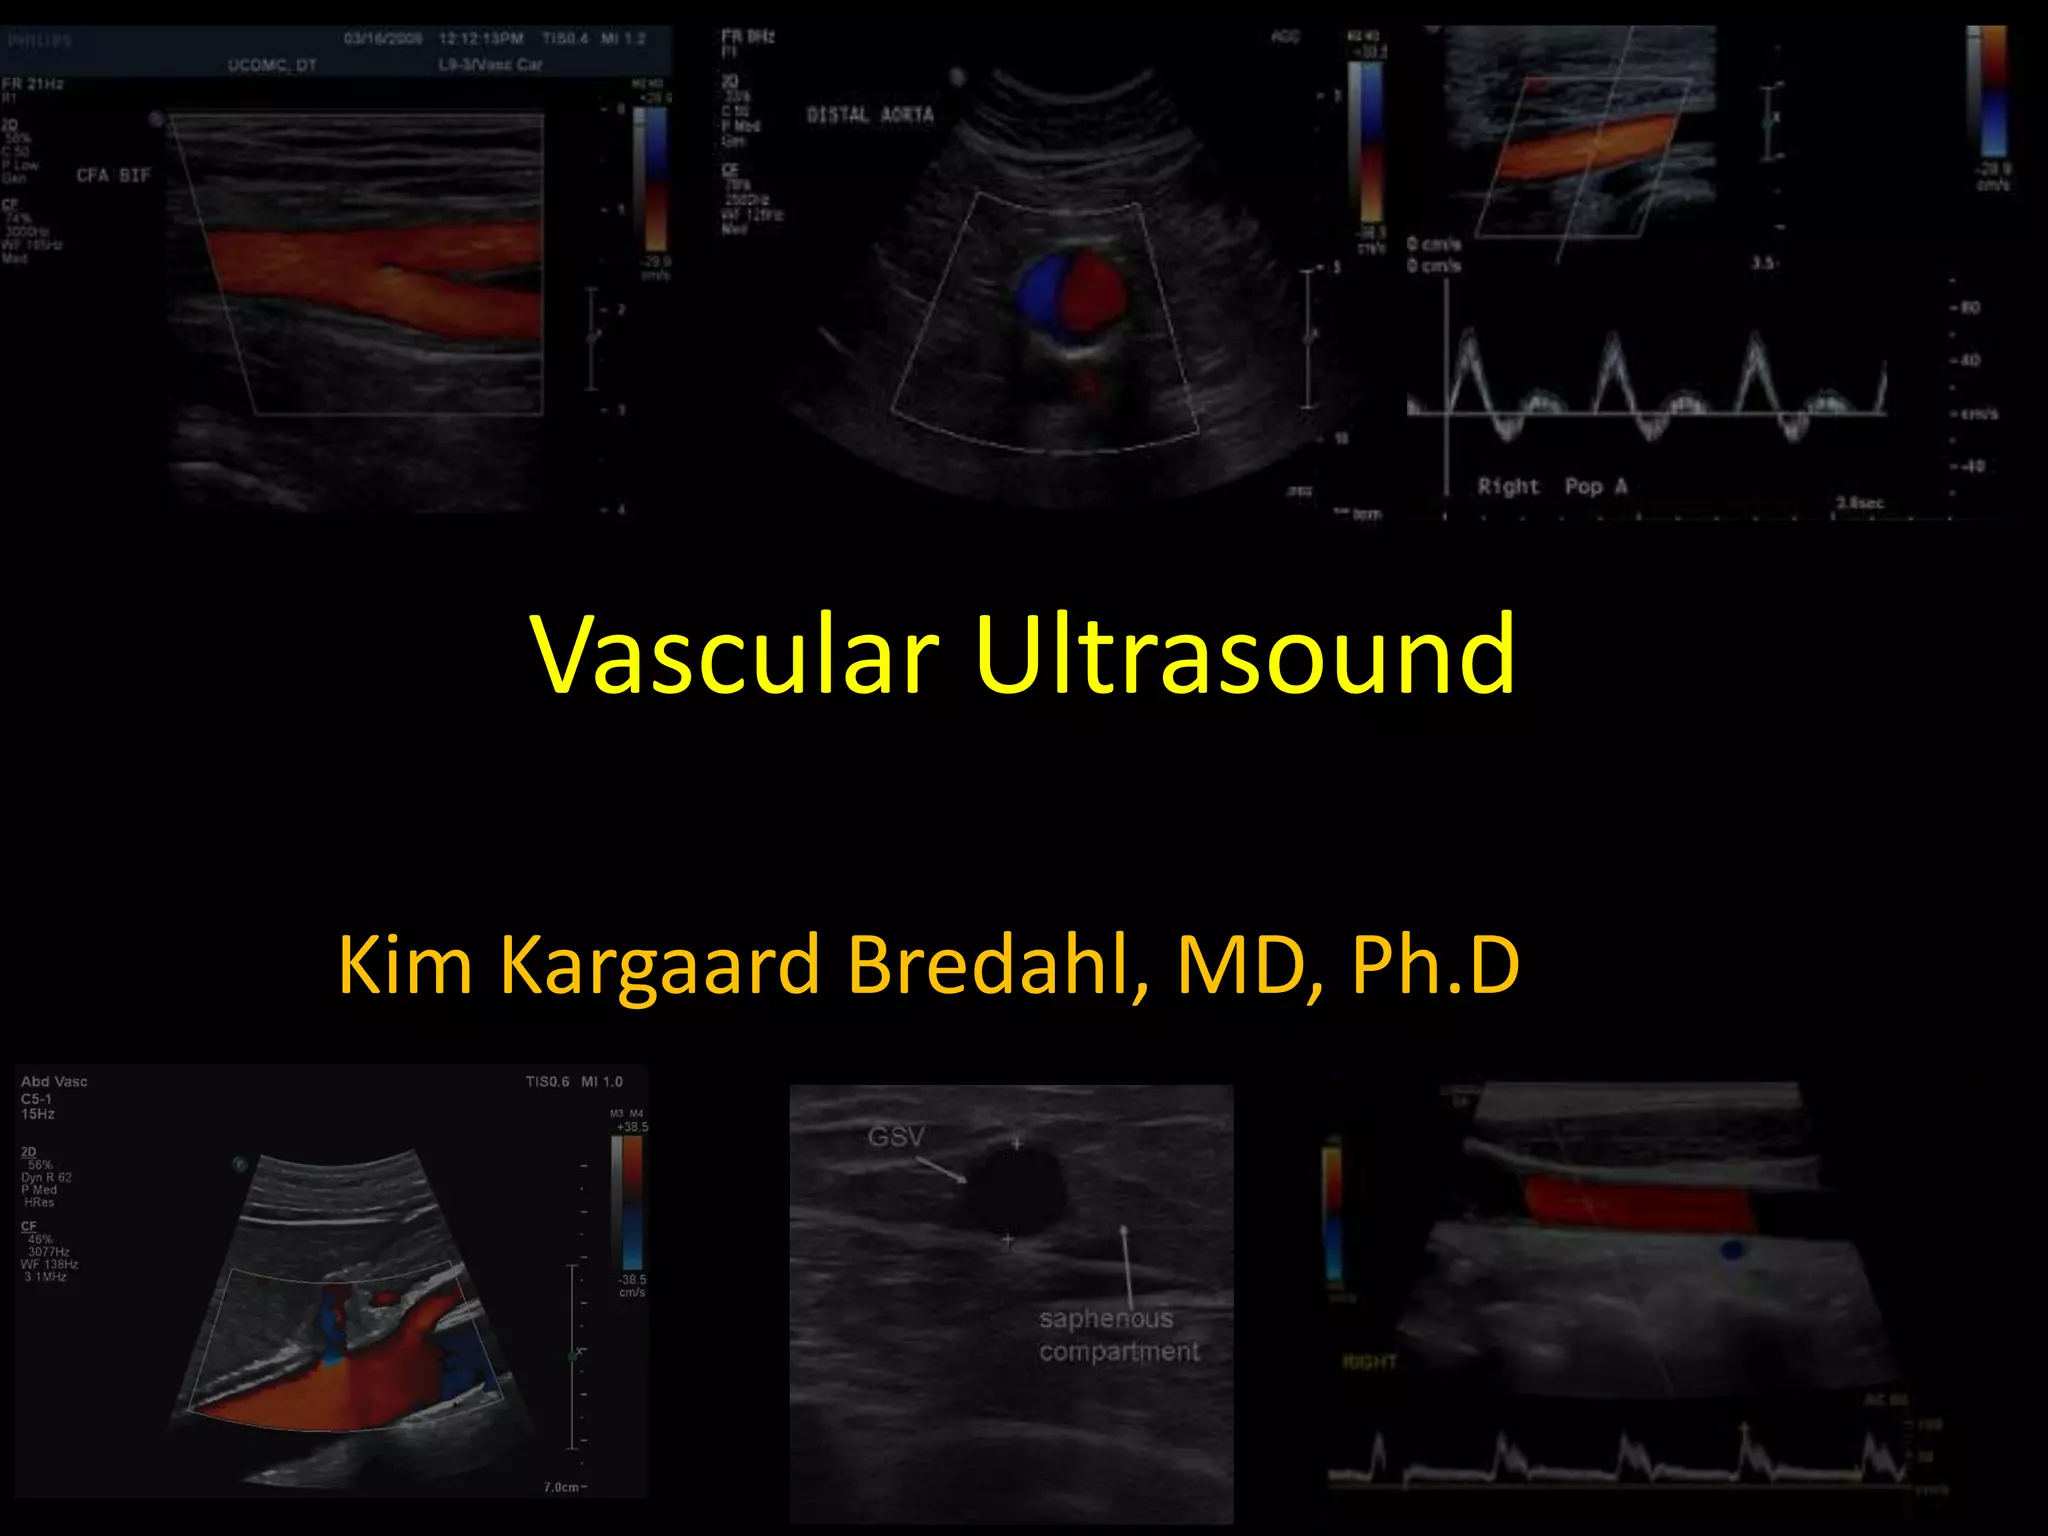
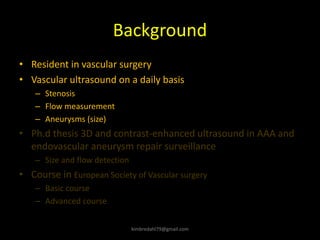
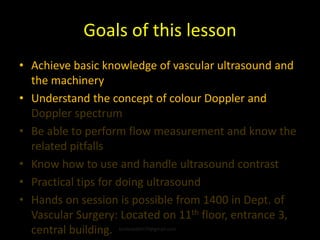
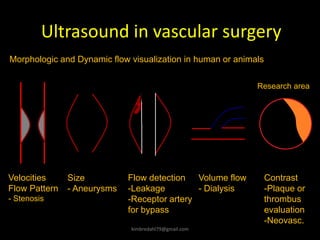
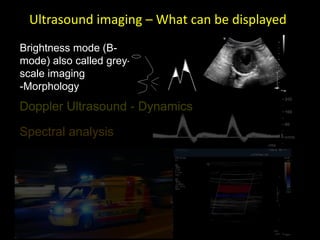
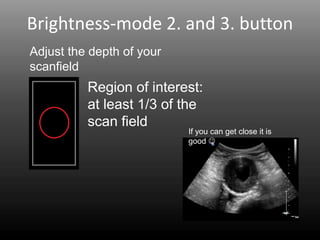
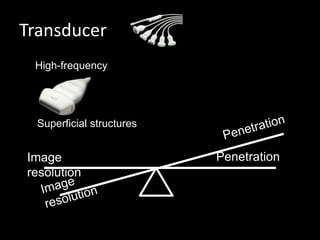
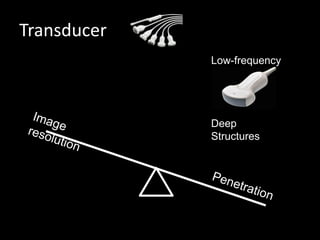
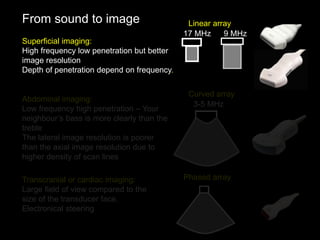
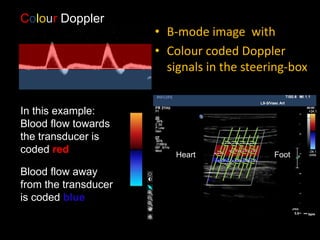
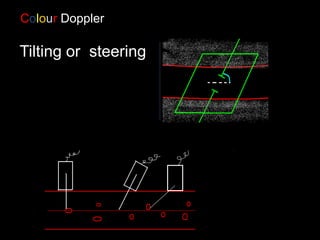
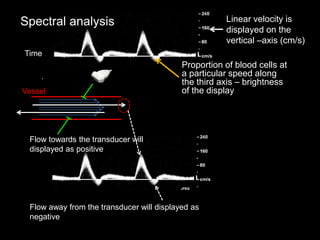
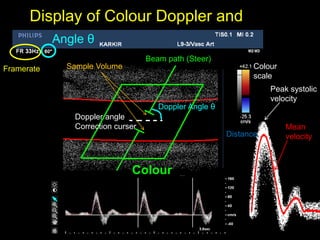
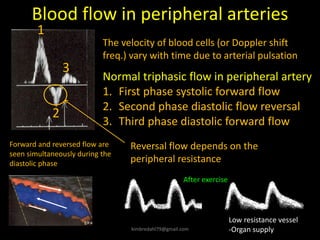
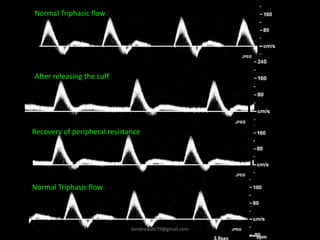
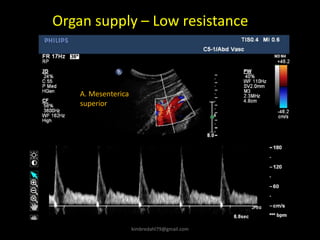
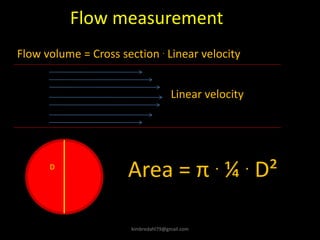
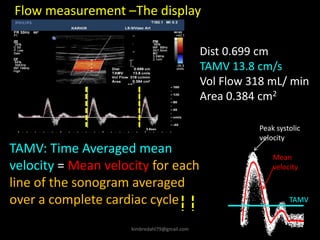
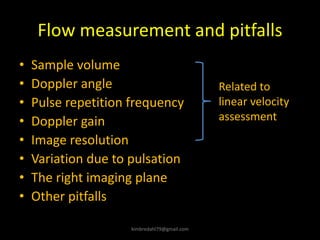
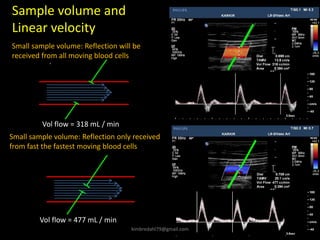
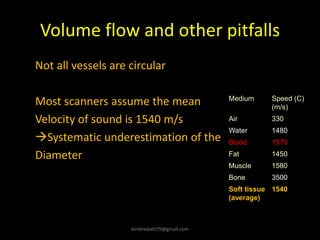
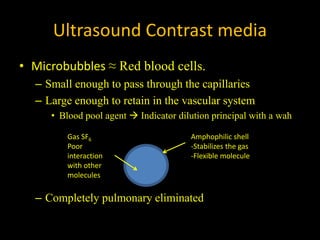
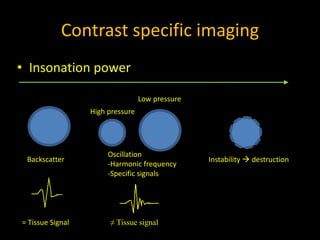
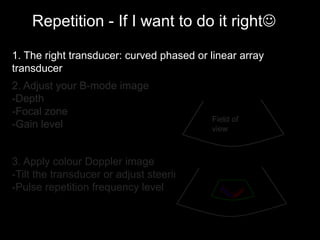
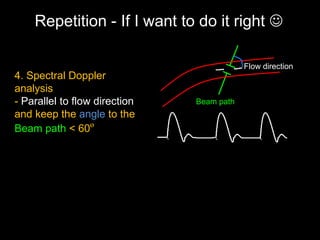
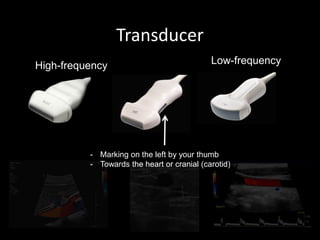
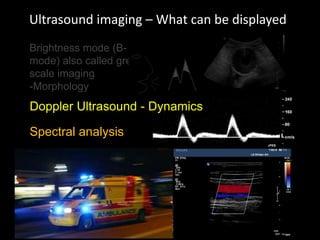
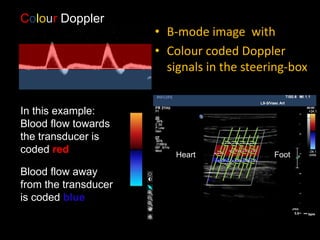
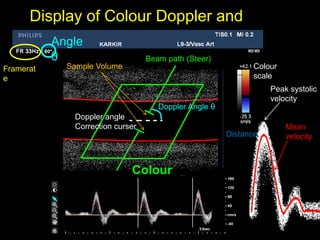
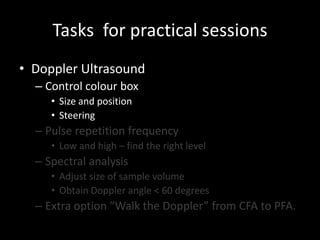
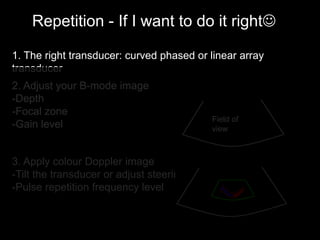
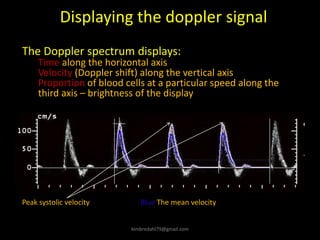
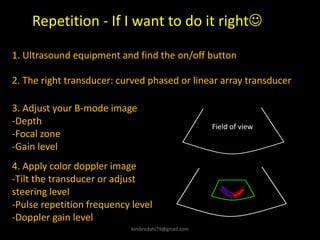
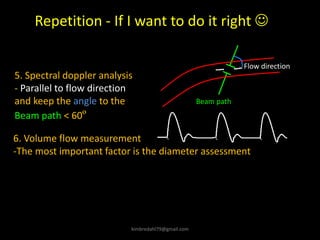
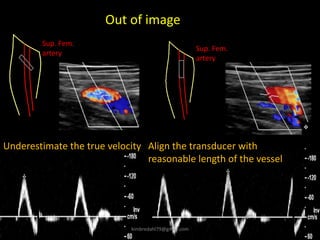
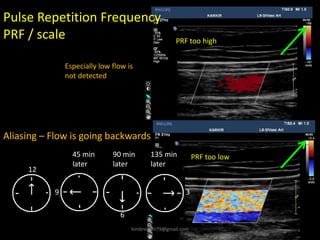
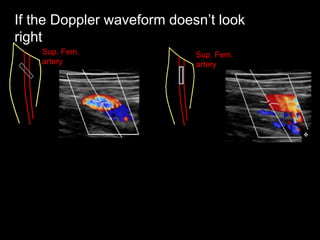
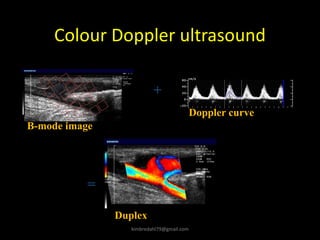
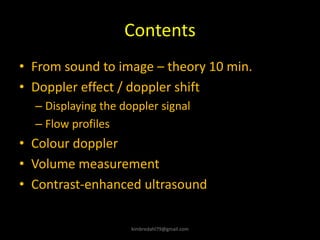
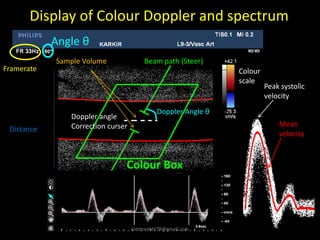
SlideShare a Scribd company logo
1 of 119
Download to read offline
Vascular Ultrasound
Kim Kargaard Bredahl, MD, Ph.D
Background
• Resident in vascular surgery
• Vascular ultrasound on a daily basis
– Stenosis
– Flow measurement
– Aneurysms (size)
• Ph.d thesis 3D and contrast-enhanced ultrasound in AAA and
endovascular aneurysm repair surveillance
– Size and flow detection
• Course in European Society of Vascular surgery
– Basic course
– Advanced course
kimbredahl79@gmail.com
Goals of this lesson
• Achieve basic knowledge of vascular ultrasound and
the machinery
• Understand the concept of colour Doppler and
Doppler spectrum
• Be able to perform flow measurement and know the
related pitfalls
• Know how to use and handle ultrasound contrast
• Practical tips for doing ultrasound
• Hands on session is possible from 1400 in Dept. of
Vascular Surgery: Located on 11th floor, entrance 3,
central building. kimbredahl79@gmail.com
Ultrasound in vascular surgery
kimbredahl79@gmail.com
Size
- Aneurysms
Flow detection
-Leakage
-Receptor artery
for bypass
Morphologic and Dynamic flow visualization in human or animals
Volume flow
- Dialysis
Contrast
-Plaque or
thrombus
evaluation
-Neovasc.
Research area
Velocities
Flow Pattern
- Stenosis
Vascular ultrasound
• Real time imaging
– Can be repeated and is harmless
– Dynamic information
– Morphology
• Pitfalls
– Operator dependent
• Demonstrate and report your variabilty
– Bland Altman plots
kimbredahl79@gmail.com
Ultrasound imaging – What can be displayed
Brightness mode (B-
mode) also called grey-
scale imaging
-Morphology
Colour
Spectral analysis
Doppler Ultrasound - Dynamics
Brightness-mode
Machinery
CD Player – do you
remember it? Receiver Loudspeaker
Amplification
Raw data
Ultrasound equipment in short – two unit
model
Transducer
Mechanical
energy
Filtered and amplified
Received
information
Displayed
Tissue
Brightness depends on
-Output power
-Attenuation
-Scattering
-Acoustic impedance
-Amplification of the
returning signal called
gain
Skin
Depth
B-mode
Two ways to increase signal intensity
1. Increase output power, which for safety
reasons is fixed.
2. Increase amplification, which is the gain
level (2D)
Amplifier
Filter
Screen
Mechanical
energy
Receiving
element
Transmitting
element
Output power
Electric
energy
Tissue
Tissue
related
Brightness mode (B-mode)
Small adjustments to increase the image quality – focal zone
Superficial focal zone
• Worst images:
ultrasound beam is
parallel to the interface
•
Best images: ultrasound
beam is perpendicular
to the interface
• interface
From sound to image Operator dependent
factors B-mode
Clear definition of the arterial walls is a good indication of perpendicular position.
kimbredahl79@gmail.com
Heavily calcified arterial Aortic anterior wall
Don’t blame the operator
Brightness-mode – 3 buttons!!!
Raw data
Volume = gain →2D button
Optimal gain level = some
echo signal insight the
vessel
Brightness-mode 2. and 3. button
Adjust the depth of your
scanfield
Region of interest:
at least 1/3 of the
scan field
If you can get close it is
good ☺
Transducer
Image
resolution
Penetration
High-frequency
Superficial structures
Transducer
Low-frequency
Deep
Structures
From sound to image
Superficial imaging:
High frequency low penetration but better
image resolution
Depth of penetration depend on frequency.
Abdominal imaging:
Low frequency high penetration – Your
neighbour’s bass is more clearly than the
treble
The lateral image resolution is poorer
than the axial image resolution due to
higher density of scan lines
Linear array
9 MHz
17 MHz
3-5 MHz
Curved array
Transcranial or cardiac imaging:
Large field of view compared to the
size of the transducer face.
Electronical steering
Phased array
3-D transducer Real time biplane imaging
Pixels total: Scan field
Dimensions are known
Pixels outside the
segmentation
Pixels inside = AAA
kimbredahl79@gmail.com
Transducer
High-frequency Low-frequency
- Marking on the left by your thumb
- Towards the heart or cranial (carotid)
Transducer
Handheld Fingercontrol
Transducer
Transducer
Tasks for practical session later today
• B-mode optimization –
– Gain
• A little echo-signal inside the vessel
– Depth
• The region of interest should occupy 1/3 of the display
– Focus
• On the far wall.
Ultrasound imaging – What can be displayed
Brightness mode (B-
mode) also called grey-
scale imaging
-Morphology
Colour
Spectral analysis
Doppler Ultrasound - Dynamics
Doppler effect
”the Doppler shift”
kimbredahl79@gmail.com
Spectral analysis
Flow towards the transducer will
displayed as positive
Flow away from the transducer will displayed as
negative
Tim
e
Linear velocity is
displayed on the
vertical –axis (cm/s)
Proportion of blood cells at
a particular speed along
the third axis – brightness
of the display
Vessel
Heart Foot
In this example:
Blood flow towards
the transducer is
coded red
Blood flow away
from the transducer
is coded blue
Colour Doppler
• B-mode image with
• Colour coded Doppler
signals in the steering-box
θ
Tilting or steering
Colour Doppler
Spectral analysis
Flow towards the transducer will
displayed as positive
Flow away from the transducer will displayed as
negative
Time
Linear velocity is
displayed on the
vertical –axis (cm/s)
Proportion of blood cells at
a particular speed along
the third axis – brightness
of the display
Vessel
Heart Foot
In this example:
Blood flow towards
the transducer is
coded red
Blood flow away
from the transducer
is coded blue
Colour Doppler
• B-mode image with
• Colour coded Doppler
signals in the steering-box
B-mode image
+
Doppler curve
=
Velocity
is
coded
Duplex
Colour Doppler
θ
Tilting or steering
Colour Doppler
SFA
External
Iliac artery
Remember! The Doppler shift is based on Doppler
equation where cosinus function is included, and
cosinus to 90 degree is zero
Colour Doppler
1
Cos
(θ)
Sin
(θ)
0
Scan positions
kimbredahl79@gmail.com
Groin or SFA Poplitea
Colour Doppler
Remember! The pulse repetition frequency is important in
order to visualize blood-flow.
Growth of a tree cannot
be observed by
watching every second!
If the speed is high – you have to watch every
second
Low
flow
PRF too high PRF too low
Display of Colour Doppler and
spectrum
Peak systolic
velocity
Mean
velocity
Framerate
Angle θ
Distance
Colour
scale
Beam path (Steer)
Colour
Box
Doppler angle
Correction curser
Doppler Angle θ
Sample Volume
Normal triphasic flow in peripheral artery
1. First phase systolic forward flow
2. Second phase diastolic flow reversal
3. Third phase diastolic forward flow
2
1
3
Blood flow in peripheral arteries
Forward and reversed flow are
seen simultaneously during the
diastolic phase
Reversal flow depends on the
peripheral resistance
After exercise
The velocity of blood cells (or Doppler shift
freq.) vary with time due to arterial pulsation
Low resistance vessel
-Organ supply
kimbredahl79@gmail.com
Normal Triphasic flow
After releasing the cuff
Normal Triphasic flow
Recovery of peripheral resistance
kimbredahl79@gmail.com
Organ supply – Low resistance
A. Mesenterica
superior
kimbredahl79@gmail.com
Transition from laminar to turbulent flow
Blood cells with
multiple velocities Spectral
broadening
Laminar or Parabolic flow
Disturbed flow
Turbulent flow
kimbredahl79@gmail.com
Triphasic signal → Disturbed flow showing
spectral broadening → Finally monophasic flow
kimbredahl79@gmail.com
Flow profiles in stenoses
• Velocity increase
– fluid travels faster
through the
narrow section
• Turbulence
x3
Velocity profile in arterial stenosis
Stenotic signal
Post-stenotic signal
Monofasic signal
Tri-phasic signal
Blood flow
Velocity
Decrease in diameter
50%
At 70% reduction of diameter a pressure drop
occur - and the stenosis are limiting the flow
This correspond to a 2-3 fold increase in
systolic velocity
kimbredahl79@gmail.com
Linear velocity
Area = π . ¼ . D²
D
Flow volume = Cross section . Linear velocity
Flow measurement
kimbredahl79@gmail.com
Dist 0.699 cm
TAMV 13.8 cm/s
Vol Flow 318 mL/ min
Area 0.384 cm2
Flow measurement –The display
TAMV: Time Averaged mean
velocity = Mean velocity for each
line of the sonogram averaged
over a complete cardiac cycle
Peak systolic
velocity
Mean
velocity
TAMV
kimbredahl79@gmail.com
Flow measurement and pitfalls
• Sample volume
• Doppler angle
• Pulse repetition frequency
• Doppler gain
• Image resolution
• Variation due to pulsation
• The right imaging plane
• Other pitfalls
Related to
linear velocity
assessment
kimbredahl79@gmail.com
Small sample volume: Reflection only received
from fast the fastest moving blood cells
Small sample volume: Reflection will be
received from all moving blood cells
Vol flow = 477 mL / min
Vol flow = 318 mL / min
Sample volume and
Linear velocity
kimbredahl79@gmail.com
fd = f0 – f1 = (2 x V x f0 x cos) / C
When calculating the velocity (V)
the angle estimation is very
important – especially when  > 60.
Example:
Overestimating the angle by 5
• at 40  leads to an error of 7%.
• at 75  leads to an error of 47% !
Conclusion: Keep the angel < 60  !
30 60 80
0
10
100
Error in velocity %
Degrees
Doppler angle θ
kimbredahl79@gmail.com
Volume measurement - Doppler gain
High gain → overloading of the
instrument → poor direction
discrimination
Mirror image
PSV and TAMV increase
Ideal image
PSV and TAMV decrease
Too low gain → flow
may not be detected The ideal gain level
kimbredahl79@gmail.com
Cross section
The error is 0.084 cm or
less than 1 mm. or 11 %
Area = π . ¼ . D²
The corresponding failure in
vol flow is 21 % going from
459 mL to 362 mL
kimbredahl79@gmail.com
Diameter assessment and Image resolution
L9-3 MHz L17-5 MHz
Intima
No intima
For superficial structures take the transducer with the highest frequency available
kimbredahl79@gmail.com
Diameter assessment – when to measure
Cardiac cycle
kimbredahl79@gmail.com
Cardiac cycle
Upper LoA =4.7 mm
Average 1, 94 mm
kimbredahl79@gmail.com
Challenges in systoly
Diameter
forskel
Tid
1 sekund
Frame rate = 18
By Henrik Sillesen
kimbredahl79@gmail.com
Cursor position
2-6 mm. Difference!
kimbredahl79@gmail.com
Diameter assessment – where to measure
Taken the concept of acoustic
impedance into account the ideal
measurement would be from the
most reproducible measurement
is from leading edge adventitia
ant. wall to leading edge
adventitia posterior wall
The most reproducible
measurement
The true volume flow
From intima to intima
kimbredahl79@gmail.com
Karvæggen
Leading edge
of intima
Tunica media
Leading edge of adventitia –
anterior wall
Lumen
Grænsen mellem
tunica media og
tunica adventitia
kimbredahl79@gmail.com
Cursor position
Leading edge of intima
Leading edge of adventitia
kimbredahl79@gmail.com
Cursor position
kimbredahl79@gmail.com
Volume flow and other pitfalls
Not all vessels are circular
Most scanners assume the mean
Velocity of sound is 1540 m/s
→Systematic underestimation of the
Diameter
Medium Speed (C)
(m/s)
Air 330
Water 1480
Blood 1570
Fat 1450
Muscle 1580
Bone 3500
Soft tissue
(average)
1540
kimbredahl79@gmail.com
Ultrasound Contrast media
• Microbubbles ≈ Red blood cells.
– Small enough to pass through the capillaries
– Large enough to retain in the vascular system
• Blood pool agent → Indicator dilution principal with a wah
– Completely pulmonary eliminated
Gas SF6
Poor
interaction
with other
molecules
Amphophilic shell
-Stabilizes the gas
-Flexible molecule
Contrast specific imaging
• Insonation power
Instability → destruction
Backscatter
= Tissue Signal
Low pressure
High pressure
Oscillation
-Harmonic frequency
-Specific signals
≠ Tissue signal
Contrast specific imaging
• In summary
– Specific echo signal different from tissue
• No tissue signals
• No movement artifacts and blooming effects
– Independent from blood flow velocity
• No angle dependent color display
• Better spatial resolution
• Detect low flow
– Good safety profile
• No burden for the liver or kidneys
• Allergic reactions are rare
In practice
• High end scanner with a contrast specific
application
• SonoVue
– 20 gauge cannula
– Forward injection in a cubital vein.
– 1-2 ml.
– Last 6 hours after mixture.
– Anti-histamin and adrenalin.
Contrast-enhanced ultrasound
• If microvascular perfusion is important.
– Diabetic patients
• If luminal morphology is important
– Plaque size and neovascularization
– Thrombus size estimation
– Near occlusion / complete occlusion
– Flow detection
Microvasculature
C. Greis / Ultrasound contrast agents as markers of vascularity and microcirculation
Peripheral arterial disease
Healthy volunteer
Lindner JR, Portland, Oregon. JACC: Cardiovascular imaging 2008
Flow detection
kimbredahl79@gmail.com
Tasks for practical sessions
• Doppler Ultrasound
– Control colour box
• Size and position
• Steering
– Pulse repetition frequency
• Low and high – find the right level
– Spectral analysis
• Adjust size of sample volume
• Obtain Doppler angle < 60 degrees
– Extra option ”Walk the Doppler” from CFA to PFA.
Repetition - If I want to do it right☺
Field of
view
1. The right transducer: curved phased or linear array
transducer
2. Adjust your B-mode image
-Depth
-Focal zone
-Gain level
3. Apply colour Doppler image
-Tilt the transducer or adjust steering level
-Pulse repetition frequency level
Repetition - If I want to do it right ☺
4. Spectral Doppler
analysis
- Parallel to flow direction
and keep the angle to the
Beam path < 60º
Beam path
Flow direction
The practical sessions
5. Be correctly seated and your right should work
independently. Don’t look down! Keep eye on the road
(Keyboard).
And your left hand is as important as your right hand.
If you want to know more
• Vascular ultrasound How, why and when
– Edited by Abigail Thrush and Tim Hartshorne
• Quantitative evaluation of microvascular blood flow
by contrast-enhanced ultrasound by C. Greis. Clinical
Hemorheology and Microcirculation 49 (2011) 137-149
• Pubmed: Eiken FL et al. Diagnostic methods for
measurement of peripheral blood flow during
exercise in patients with type II diabetes and
peripheral artery disease: a systematic review
Practical stuff
kimbredahl79@gmail.com
Transducer
High-frequency Low-frequency
- Marking on the left by your thumb
- Towards the heart or cranial (carotid)
Transducer
Handheld Fingercontr
ol
Transducer
Transducer
Brightness-mode
Machinery
CD Player – do you
remember it? Receiver Loudspeake
r
Amplificatio
n
Raw
data
Ultrasound equipment in short – two unit
model
Transducer
Mechanica
l energy
Filtered and amplified
Received
informatio
n
Displaye
d
Tissue
Brightness-mode – 3 buttons!!!
Raw data
Volume = gain →2D button
Optimal gain level = some
echo signal insight the
vessel
Brightness-mode 2. and 3. button
Adjust the depth of your
scanfield
Region of interest:
at least 1/3 of the
scan field
If you can get close it is
good ☺
Ultrasound imaging – What can be displayed
Brightness mode (B-
mode) also called grey-
scale imaging
-Morphology
Colour
Spectral analysis
Doppler Ultrasound - Dynamics
Spectral analysis
Flow towards the transducer will
displayed as positive
Flow away from the transducer will displayed as
negative
Tim
e
Linear velocity is
displayed on the
vertical –axis (cm/s)
Proportion of blood cells at
a particular speed along
the third axis – brightness
of the display
Vessel
Heart Foot
In this example:
Blood flow towards
the transducer is
coded red
Blood flow away
from the transducer
is coded blue
Colour Doppler
• B-mode image with
• Colour coded Doppler
signals in the steering-box
θ
Tilting or steering
Colour Doppler
SFA
External
Iliac artery
Remember! The Doppler shift is based on Doppler
equation where cosinus function is included, and
cosinus to 90 degree is zero
Colour Doppler
1
Cos
(θ)
Sin
(θ)
0
Colour Doppler
Remember! The pulse repetition frequency is important in
order to visualize blood-flow.
Growth of a tree cannot
be observed by
watching every second!
If the speed is high – you have to watch every
second
Low
flow
PRF too high PRF too low
Display of Colour Doppler and
spectrum
Peak systolic
velocity
Mean
velocity
Framerat
e
Angle
θ
Distance
Colour
scale
Beam path (Steer)
Colour
Box
Doppler angle
Correction curser
Doppler Angle θ
Sample Volume
Sup. Fem.
artery
Sup. Fem.
artery
If the Doppler waveform doesn’t look
right
Tasks for practical sessions
• Doppler Ultrasound
– Control colour box
• Size and position
• Steering
– Pulse repetition frequency
• Low and high – find the right level
– Spectral analysis
• Adjust size of sample volume
• Obtain Doppler angle < 60 degrees
– Extra option ”Walk the Doppler” from CFA to PFA.
Repetition - If I want to do it right☺
Field of
view
1. The right transducer: curved phased or linear array
transducer
2. Adjust your B-mode image
-Depth
-Focal zone
-Gain level
3. Apply colour Doppler image
-Tilt the transducer or adjust steering level
-Pulse repetition frequency level
Repetition - If I want to do it right ☺
4. Spectral Doppler
analysis
- Parallel to flow direction
and keep the angle to the
Beam path < 60º
Beam path
Flow direction
The practical sessions
5. Be correctly seated and your right hand works
independently. Don’t look down! Keep eye on the road
(Keyboard).
And your left hand is as important as your right hand.
Contents
• The clinical use of ultrasound in vascular
surgery
• From sound to image – theory 10 min.
• Doppler effect / doppler shift
– Displaying the doppler signal
– Flow profiles
• Colour doppler
• Volume measurement
– Pitfalls
• Hands on session
kimbredahl79@gmail.com
Ischemic disease
• Patient’s complaint
• Objective
– Peripheral blood pressure
– Dynamic flow visualization
• Linear flow velocities
• Flow pattern
kimbredahl79@gmail.com
Aneurysm size or mophology
Accuracy is important
Standard protocol is pivotal
-Cardiac cycle
-Delineation of the vessel wall
-Image plan; 3D ultrasound
• Ultrasound contrast
– Morphology
• Thrombus or plaque size – delineates the
lumen/thrombus
kimbredahl79@gmail.com
Leakage
• Flow detection
• Ultrasound contrast
– Low flow
– Microperfusion
kimbredahl79@gmail.com
Ultrasound = High frequency sound that induces
local periodic displacement of particles in the medium
Transducer on
Transducer off
Displacement Depth
λ
Frequency (f) = 1/τ, number of cycles of displacements during 1 second (Hz).
Medical ultrasound scanner typically use frequencies between 2 – 15 MHz
kimbredahl79@gmail.com
Transducer
Piezo-electro
elements
Gel
fd = fr – ft = ( 2 x V x ft x Cos θ) / C
Receiving element
Red cells = moving source,
Transducer = stationary observer
Doppler-effect
Transmitting
element
Transducer = stationary source
Red cells = Moving observer.
θ
: Angle of insonation
C: Speed of sound in tissue (1540 m/s)
V: Velocity of blood
fr: Receiving frequency
ft: Transmitted frequency
kimbredahl79@gmail.com
The Doppler signal of flowing blood contains a range of
velocities (or Doppler shift frequencies)
Bloods cells near the vessel wall will move more slowly
Displaying the doppler signal
Velocity
time
kimbredahl79@gmail.com
Output power
Electric
energy
Transmitting
element
Receiving
element
Amplifier
Analyser
Screen
From sound to image
Transducer: Converts energy into another form of energy
Ultrasound machine interprets the receiving information
Mechanical
energy
Vibration
Tissue
High-End
Frame rate depends on
-Machine power
-Work load
Reduce field of view.
Steady patient!
Low-End
Two possibilities to
increase signal
intensity
-Increase output
power, which is
often locked
- Increase
amplification,
which is the gain
level (2D)
but at a certain
level signal ≠ noise
kimbredahl79@gmail.com
From sound to image:
Brightness mode (B-mode)
Skin
Brightness proportional to
amplitude of echoes – grey scale
We assume the speed of ultrasound through
the tissue is constant, and we know the
generated frequency then we can predict the
distance from the source to the reflective
boundary
Medium Speed (C)
(m/s)
Air 330
Water 1480
Blood 1570
Fat 1450
Muscle 1580
Bone 3500
Soft tissue
(average)
1540
Depth
Distance = (Time . C) / 2
kimbredahl79@gmail.com
Output power
Electric
energy
Transmitting
element
Receiving
element
Amplifier
Analyser
Screen
From sound to image
Transducer: Converts energy into another form of energy
Ultrasound machine interprets the receiving information
Two possibilities to
increase signal intensity
-Increase output power,
which is often locked
- Increase amplification,
which is the gain level
(2D)
but at a certain level
signal ≠ noise
kimbredahl79@gmail.com
From sound to image
Superficial imaging:
Depth of penetration depend on frequency.
High frequency low penetration but better image
resolution
Abdominal imaging:
Low frequency high penetration – Your neighbour’s bass
is more clearly than the treble
The lateral image resolution is poorer the axial image
resolution due to higher density of scan lines
Linear array
9 MHz
13 MHz
3-5 MHz
Curved array
Cardiac imaging:
Large field of view compared to the size of the
transducer face.
Electronical steering
Phased array
kimbredahl79@gmail.com
Difference in acoustic impedance
determines reflection rate
From sound to image – Acoustic impedance: resistance
against passage of the sound wave
Similar acoustic impedance
• Muscle/blood (ratio=0.03)
• Fat/muscle (0.10)
• Low/moderate reflection - ideal for US
Different acoustic impedance
• soft tissue/air (ratio=0.999)
• soft tissue/bone (0.65)
• High reflection – not ideal for US imaging
kimbredahl79@gmail.com
Colour Doppler
ultrasound
• B-mode grey-scale image +
• Colour coded Doppler signals
in the colour-box
Blood flow towards the
transducer is (probably) coded
red
Blood flow away from the
transducer is coded blue
Arterial flow
Venous flow
Primarily used for flow detection
θ
The doppler shift depends on the angle θ
Cos (θ)
Sin (θ)
Doppler angle θ = 90 then
Cos(90) = 0
1
0
kimbredahl79@gmail.com
Doppler angle θ
kimbredahl79@gmail.com
The Doppler spectrum displays:
Time along the horizontal axis
Velocity (Doppler shift) along the vertical axis
Proportion of blood cells at a particular speed along the
third axis – brightness of the display
Displaying the doppler signal
Blue The mean velocity
Peak systolic velocity
kimbredahl79@gmail.com
Repetition - If I want to do it right☺
Field of view
1. Ultrasound equipment and find the on/off button
2. The right transducer: curved phased or linear array transducer
3. Adjust your B-mode image
-Depth
-Focal zone
-Gain level
4. Apply color doppler image
-Tilt the transducer or adjust
steering level
-Pulse repetition frequency level
-Doppler gain level
kimbredahl79@gmail.com
Repetition - If I want to do it right ☺
5. Spectral doppler analysis
- Parallel to flow direction
and keep the angle to the
Beam path < 60º
Beam path
Flow direction
6. Volume flow measurement
-The most important factor is the diameter assessment
kimbredahl79@gmail.com
Sup. Fem.
artery
Sup. Fem.
artery
Underestimate the true velocity Align the transducer with
reasonable length of the vessel
Out of image
kimbredahl79@gmail.com
6
PRF too high
PRF too low
Aliasing – Flow is going backwards
12
9 3
45 min
later
90 min
later
135 min
later
Pulse Repetition Frequency
PRF / scale
Especially low flow is
not detected
kimbredahl79@gmail.com
Sup. Fem.
artery
Sup. Fem.
artery
If the Doppler waveform doesn’t look
right
Colour Doppler ultrasound
B-mode image
+
Doppler curve
=
Duplex
kimbredahl79@gmail.com
Contents
• From sound to image – theory 10 min.
• Doppler effect / doppler shift
– Displaying the doppler signal
– Flow profiles
• Colour doppler
• Volume measurement
• Contrast-enhanced ultrasound
kimbredahl79@gmail.com
Display of Colour Doppler and spectrum
Colour
scale
Framerate
Angle θ
Doppler Angle θ
Beam path (Steer)
Colour Box
Doppler angle
Correction curser
Sample Volume
Distance
Peak systolic
velocity
Mean
velocity
kimbredahl79@gmail.com
Karvæggens bestanddele
Små glatte
muskelceller og
elastisk fibre
Endothelceller
Adventitia består
mest af kollagen
Stor forskel i
akustisk
impedans fra lav
til høj →
Refleksion ↑
Måler aldrig IMT på forreste
væg
kimbredahl79@gmail.com

More Related Content

Similar to presentation-kim-bredahl-doppler-ultrasound.pdf

Flow measurement in Blood flow
Flow measurement in Blood flowFlow measurement in Blood flow
Flow measurement in Blood flowVinothini S
 
Principles of Doppler ultrasound
Principles of Doppler ultrasoundPrinciples of Doppler ultrasound
Principles of Doppler ultrasoundSamir Haffar
 
Pulse wave velocity ssid02688 03
Pulse wave velocity ssid02688 03Pulse wave velocity ssid02688 03
Pulse wave velocity ssid02688 03Nasos Papapostolou
 
carotid doppler u/s Radiology
carotid doppler u/s Radiologycarotid doppler u/s Radiology
carotid doppler u/s RadiologyHenock Negasi
 
Carotid doppler anamika
Carotid doppler anamikaCarotid doppler anamika
Carotid doppler anamikaaenagupta
 
Normal doppler spectral pattern of abdominal and limb vessels final
Normal doppler spectral pattern of abdominal and limb vessels finalNormal doppler spectral pattern of abdominal and limb vessels final
Normal doppler spectral pattern of abdominal and limb vessels finalNipun Gupta
 
Doppler study general bases
Doppler study general basesDoppler study general bases
Doppler study general basesRiyadhWaheed
 
Doppler Flow Velocity: Applications in Cardiovascular Research
Doppler Flow Velocity: Applications in Cardiovascular ResearchDoppler Flow Velocity: Applications in Cardiovascular Research
Doppler Flow Velocity: Applications in Cardiovascular ResearchScintica Instrumentation
 
Automatic meas in clinical daily practice bcu event
Automatic meas in clinical daily practice  bcu event Automatic meas in clinical daily practice  bcu event
Automatic meas in clinical daily practice bcu event Harry Ridwan
 
Aortic acceleration as a noninvasive index of left ventricular contractility ...
Aortic acceleration as a noninvasive index of left ventricular contractility ...Aortic acceleration as a noninvasive index of left ventricular contractility ...
Aortic acceleration as a noninvasive index of left ventricular contractility ...Scintica Instrumentation
 
The value of US versus angiography in carotid artery diseases.pptx
The value of US versus angiography in carotid artery diseases.pptxThe value of US versus angiography in carotid artery diseases.pptx
The value of US versus angiography in carotid artery diseases.pptxTalaat Khater
 
Doppler principles [2]
Doppler principles [2]Doppler principles [2]
Doppler principles [2]KamalEldirawi
 
echo evaluation of coronary arteries.pptx
echo evaluation of coronary arteries.pptxecho evaluation of coronary arteries.pptx
echo evaluation of coronary arteries.pptxAbhinay Reddy
 

Similar to presentation-kim-bredahl-doppler-ultrasound.pdf (20)

Flow measurement in Blood flow
Flow measurement in Blood flowFlow measurement in Blood flow
Flow measurement in Blood flow
 
Echocardiography
Echocardiography Echocardiography
Echocardiography
 
Doppler us (3)
Doppler us (3)Doppler us (3)
Doppler us (3)
 
Doppler us (2)
Doppler us (2)Doppler us (2)
Doppler us (2)
 
Principles of Doppler ultrasound
Principles of Doppler ultrasoundPrinciples of Doppler ultrasound
Principles of Doppler ultrasound
 
Carotid doppler study pk
Carotid doppler study pkCarotid doppler study pk
Carotid doppler study pk
 
Pulse wave velocity ssid02688 03
Pulse wave velocity ssid02688 03Pulse wave velocity ssid02688 03
Pulse wave velocity ssid02688 03
 
carotid doppler u/s Radiology
carotid doppler u/s Radiologycarotid doppler u/s Radiology
carotid doppler u/s Radiology
 
Carotid doppler anamika
Carotid doppler anamikaCarotid doppler anamika
Carotid doppler anamika
 
Doppler physics.pptx
Doppler physics.pptxDoppler physics.pptx
Doppler physics.pptx
 
Normal doppler spectral pattern of abdominal and limb vessels final
Normal doppler spectral pattern of abdominal and limb vessels finalNormal doppler spectral pattern of abdominal and limb vessels final
Normal doppler spectral pattern of abdominal and limb vessels final
 
Doppler study general bases
Doppler study general basesDoppler study general bases
Doppler study general bases
 
Doppler Flow Velocity: Applications in Cardiovascular Research
Doppler Flow Velocity: Applications in Cardiovascular ResearchDoppler Flow Velocity: Applications in Cardiovascular Research
Doppler Flow Velocity: Applications in Cardiovascular Research
 
Automatic meas in clinical daily practice bcu event
Automatic meas in clinical daily practice  bcu event Automatic meas in clinical daily practice  bcu event
Automatic meas in clinical daily practice bcu event
 
Aortic acceleration as a noninvasive index of left ventricular contractility ...
Aortic acceleration as a noninvasive index of left ventricular contractility ...Aortic acceleration as a noninvasive index of left ventricular contractility ...
Aortic acceleration as a noninvasive index of left ventricular contractility ...
 
The value of US versus angiography in carotid artery diseases.pptx
The value of US versus angiography in carotid artery diseases.pptxThe value of US versus angiography in carotid artery diseases.pptx
The value of US versus angiography in carotid artery diseases.pptx
 
Doppler principles [2]
Doppler principles [2]Doppler principles [2]
Doppler principles [2]
 
echo evaluation of coronary arteries.pptx
echo evaluation of coronary arteries.pptxecho evaluation of coronary arteries.pptx
echo evaluation of coronary arteries.pptx
 
Doppler transcranico. Dott. Mauro Zanocchi
Doppler transcranico. Dott. Mauro ZanocchiDoppler transcranico. Dott. Mauro Zanocchi
Doppler transcranico. Dott. Mauro Zanocchi
 
3rd qrt 10.cs.qa summit
3rd qrt 10.cs.qa summit3rd qrt 10.cs.qa summit
3rd qrt 10.cs.qa summit
 

Recently uploaded

Verification of thevenin's theorem for BEEE Lab (1).pptx
Verification of thevenin's theorem for BEEE Lab (1).pptxVerification of thevenin's theorem for BEEE Lab (1).pptx
Verification of thevenin's theorem for BEEE Lab (1).pptxchumtiyababu
 
Computer Networks Basics of Network Devices
Computer Networks  Basics of Network DevicesComputer Networks  Basics of Network Devices
Computer Networks Basics of Network DevicesChandrakantDivate1
 
A Study of Urban Area Plan for Pabna Municipality
A Study of Urban Area Plan for Pabna MunicipalityA Study of Urban Area Plan for Pabna Municipality
A Study of Urban Area Plan for Pabna MunicipalityMorshed Ahmed Rahath
 
Online food ordering system project report.pdf
Online food ordering system project report.pdfOnline food ordering system project report.pdf
Online food ordering system project report.pdfKamal Acharya
 
Generative AI or GenAI technology based PPT
Generative AI or GenAI technology based PPTGenerative AI or GenAI technology based PPT
Generative AI or GenAI technology based PPTbhaskargani46
 
HOA1&2 - Module 3 - PREHISTORCI ARCHITECTURE OF KERALA.pptx
HOA1&2 - Module 3 - PREHISTORCI ARCHITECTURE OF KERALA.pptxHOA1&2 - Module 3 - PREHISTORCI ARCHITECTURE OF KERALA.pptx
HOA1&2 - Module 3 - PREHISTORCI ARCHITECTURE OF KERALA.pptxSCMS School of Architecture
 
A CASE STUDY ON CERAMIC INDUSTRY OF BANGLADESH.pptx
A CASE STUDY ON CERAMIC INDUSTRY OF BANGLADESH.pptxA CASE STUDY ON CERAMIC INDUSTRY OF BANGLADESH.pptx
A CASE STUDY ON CERAMIC INDUSTRY OF BANGLADESH.pptxmaisarahman1
 
XXXXXXXXXXXXXXXXXXXXXXXXXXXXXXXXXXXXXXXXXXXXXXXXXXXX
XXXXXXXXXXXXXXXXXXXXXXXXXXXXXXXXXXXXXXXXXXXXXXXXXXXXXXXXXXXXXXXXXXXXXXXXXXXXXXXXXXXXXXXXXXXXXXXXXXXXXXXX
XXXXXXXXXXXXXXXXXXXXXXXXXXXXXXXXXXXXXXXXXXXXXXXXXXXXssuser89054b
 
PE 459 LECTURE 2- natural gas basic concepts and properties
PE 459 LECTURE 2- natural gas basic concepts and propertiesPE 459 LECTURE 2- natural gas basic concepts and properties
PE 459 LECTURE 2- natural gas basic concepts and propertiessarkmank1
 
Tamil Call Girls Bhayandar WhatsApp +91-9930687706, Best Service
Tamil Call Girls Bhayandar WhatsApp +91-9930687706, Best ServiceTamil Call Girls Bhayandar WhatsApp +91-9930687706, Best Service
Tamil Call Girls Bhayandar WhatsApp +91-9930687706, Best Servicemeghakumariji156
 
Employee leave management system project.
Employee leave management system project.Employee leave management system project.
Employee leave management system project.Kamal Acharya
 
S1S2 B.Arch MGU - HOA1&2 Module 3 -Temple Architecture of Kerala.pptx
S1S2 B.Arch MGU - HOA1&2 Module 3 -Temple Architecture of Kerala.pptxS1S2 B.Arch MGU - HOA1&2 Module 3 -Temple Architecture of Kerala.pptx
S1S2 B.Arch MGU - HOA1&2 Module 3 -Temple Architecture of Kerala.pptxSCMS School of Architecture
 
Engineering Drawing focus on projection of planes
Engineering Drawing focus on projection of planesEngineering Drawing focus on projection of planes
Engineering Drawing focus on projection of planesRAJNEESHKUMAR341697
 
Navigating Complexity: The Role of Trusted Partners and VIAS3D in Dassault Sy...
Navigating Complexity: The Role of Trusted Partners and VIAS3D in Dassault Sy...Navigating Complexity: The Role of Trusted Partners and VIAS3D in Dassault Sy...
Navigating Complexity: The Role of Trusted Partners and VIAS3D in Dassault Sy...Arindam Chakraborty, Ph.D., P.E. (CA, TX)
 
Orlando’s Arnold Palmer Hospital Layout Strategy-1.pptx
Orlando’s Arnold Palmer Hospital Layout Strategy-1.pptxOrlando’s Arnold Palmer Hospital Layout Strategy-1.pptx
Orlando’s Arnold Palmer Hospital Layout Strategy-1.pptxMuhammadAsimMuhammad6
 
NO1 Top No1 Amil Baba In Azad Kashmir, Kashmir Black Magic Specialist Expert ...
NO1 Top No1 Amil Baba In Azad Kashmir, Kashmir Black Magic Specialist Expert ...NO1 Top No1 Amil Baba In Azad Kashmir, Kashmir Black Magic Specialist Expert ...
NO1 Top No1 Amil Baba In Azad Kashmir, Kashmir Black Magic Specialist Expert ...Amil baba
 
Block diagram reduction techniques in control systems.ppt
Block diagram reduction techniques in control systems.pptBlock diagram reduction techniques in control systems.ppt
Block diagram reduction techniques in control systems.pptNANDHAKUMARA10
 
Thermal Engineering Unit - I & II . ppt
Thermal Engineering  Unit - I & II . pptThermal Engineering  Unit - I & II . ppt
Thermal Engineering Unit - I & II . pptDineshKumar4165
 
Moment Distribution Method For Btech Civil
Moment Distribution Method For Btech CivilMoment Distribution Method For Btech Civil
Moment Distribution Method For Btech CivilVinayVitekari
 
"Lesotho Leaps Forward: A Chronicle of Transformative Developments"
"Lesotho Leaps Forward: A Chronicle of Transformative Developments""Lesotho Leaps Forward: A Chronicle of Transformative Developments"
"Lesotho Leaps Forward: A Chronicle of Transformative Developments"mphochane1998
 

Recently uploaded (20)

Verification of thevenin's theorem for BEEE Lab (1).pptx
Verification of thevenin's theorem for BEEE Lab (1).pptxVerification of thevenin's theorem for BEEE Lab (1).pptx
Verification of thevenin's theorem for BEEE Lab (1).pptx
 
Computer Networks Basics of Network Devices
Computer Networks  Basics of Network DevicesComputer Networks  Basics of Network Devices
Computer Networks Basics of Network Devices
 
A Study of Urban Area Plan for Pabna Municipality
A Study of Urban Area Plan for Pabna MunicipalityA Study of Urban Area Plan for Pabna Municipality
A Study of Urban Area Plan for Pabna Municipality
 
Online food ordering system project report.pdf
Online food ordering system project report.pdfOnline food ordering system project report.pdf
Online food ordering system project report.pdf
 
Generative AI or GenAI technology based PPT
Generative AI or GenAI technology based PPTGenerative AI or GenAI technology based PPT
Generative AI or GenAI technology based PPT
 
HOA1&2 - Module 3 - PREHISTORCI ARCHITECTURE OF KERALA.pptx
HOA1&2 - Module 3 - PREHISTORCI ARCHITECTURE OF KERALA.pptxHOA1&2 - Module 3 - PREHISTORCI ARCHITECTURE OF KERALA.pptx
HOA1&2 - Module 3 - PREHISTORCI ARCHITECTURE OF KERALA.pptx
 
A CASE STUDY ON CERAMIC INDUSTRY OF BANGLADESH.pptx
A CASE STUDY ON CERAMIC INDUSTRY OF BANGLADESH.pptxA CASE STUDY ON CERAMIC INDUSTRY OF BANGLADESH.pptx
A CASE STUDY ON CERAMIC INDUSTRY OF BANGLADESH.pptx
 
XXXXXXXXXXXXXXXXXXXXXXXXXXXXXXXXXXXXXXXXXXXXXXXXXXXX
XXXXXXXXXXXXXXXXXXXXXXXXXXXXXXXXXXXXXXXXXXXXXXXXXXXXXXXXXXXXXXXXXXXXXXXXXXXXXXXXXXXXXXXXXXXXXXXXXXXXXXXX
XXXXXXXXXXXXXXXXXXXXXXXXXXXXXXXXXXXXXXXXXXXXXXXXXXXX
 
PE 459 LECTURE 2- natural gas basic concepts and properties
PE 459 LECTURE 2- natural gas basic concepts and propertiesPE 459 LECTURE 2- natural gas basic concepts and properties
PE 459 LECTURE 2- natural gas basic concepts and properties
 
Tamil Call Girls Bhayandar WhatsApp +91-9930687706, Best Service
Tamil Call Girls Bhayandar WhatsApp +91-9930687706, Best ServiceTamil Call Girls Bhayandar WhatsApp +91-9930687706, Best Service
Tamil Call Girls Bhayandar WhatsApp +91-9930687706, Best Service
 
Employee leave management system project.
Employee leave management system project.Employee leave management system project.
Employee leave management system project.
 
S1S2 B.Arch MGU - HOA1&2 Module 3 -Temple Architecture of Kerala.pptx
S1S2 B.Arch MGU - HOA1&2 Module 3 -Temple Architecture of Kerala.pptxS1S2 B.Arch MGU - HOA1&2 Module 3 -Temple Architecture of Kerala.pptx
S1S2 B.Arch MGU - HOA1&2 Module 3 -Temple Architecture of Kerala.pptx
 
Engineering Drawing focus on projection of planes
Engineering Drawing focus on projection of planesEngineering Drawing focus on projection of planes
Engineering Drawing focus on projection of planes
 
Navigating Complexity: The Role of Trusted Partners and VIAS3D in Dassault Sy...
Navigating Complexity: The Role of Trusted Partners and VIAS3D in Dassault Sy...Navigating Complexity: The Role of Trusted Partners and VIAS3D in Dassault Sy...
Navigating Complexity: The Role of Trusted Partners and VIAS3D in Dassault Sy...
 
Orlando’s Arnold Palmer Hospital Layout Strategy-1.pptx
Orlando’s Arnold Palmer Hospital Layout Strategy-1.pptxOrlando’s Arnold Palmer Hospital Layout Strategy-1.pptx
Orlando’s Arnold Palmer Hospital Layout Strategy-1.pptx
 
NO1 Top No1 Amil Baba In Azad Kashmir, Kashmir Black Magic Specialist Expert ...
NO1 Top No1 Amil Baba In Azad Kashmir, Kashmir Black Magic Specialist Expert ...NO1 Top No1 Amil Baba In Azad Kashmir, Kashmir Black Magic Specialist Expert ...
NO1 Top No1 Amil Baba In Azad Kashmir, Kashmir Black Magic Specialist Expert ...
 
Block diagram reduction techniques in control systems.ppt
Block diagram reduction techniques in control systems.pptBlock diagram reduction techniques in control systems.ppt
Block diagram reduction techniques in control systems.ppt
 
Thermal Engineering Unit - I & II . ppt
Thermal Engineering  Unit - I & II . pptThermal Engineering  Unit - I & II . ppt
Thermal Engineering Unit - I & II . ppt
 
Moment Distribution Method For Btech Civil
Moment Distribution Method For Btech CivilMoment Distribution Method For Btech Civil
Moment Distribution Method For Btech Civil
 
"Lesotho Leaps Forward: A Chronicle of Transformative Developments"
"Lesotho Leaps Forward: A Chronicle of Transformative Developments""Lesotho Leaps Forward: A Chronicle of Transformative Developments"
"Lesotho Leaps Forward: A Chronicle of Transformative Developments"
 

presentation-kim-bredahl-doppler-ultrasound.pdf

  • 2. Background • Resident in vascular surgery • Vascular ultrasound on a daily basis – Stenosis – Flow measurement – Aneurysms (size) • Ph.d thesis 3D and contrast-enhanced ultrasound in AAA and endovascular aneurysm repair surveillance – Size and flow detection • Course in European Society of Vascular surgery – Basic course – Advanced course kimbredahl79@gmail.com
  • 3. Goals of this lesson • Achieve basic knowledge of vascular ultrasound and the machinery • Understand the concept of colour Doppler and Doppler spectrum • Be able to perform flow measurement and know the related pitfalls • Know how to use and handle ultrasound contrast • Practical tips for doing ultrasound • Hands on session is possible from 1400 in Dept. of Vascular Surgery: Located on 11th floor, entrance 3, central building. kimbredahl79@gmail.com
  • 4. Ultrasound in vascular surgery kimbredahl79@gmail.com Size - Aneurysms Flow detection -Leakage -Receptor artery for bypass Morphologic and Dynamic flow visualization in human or animals Volume flow - Dialysis Contrast -Plaque or thrombus evaluation -Neovasc. Research area Velocities Flow Pattern - Stenosis
  • 5. Vascular ultrasound • Real time imaging – Can be repeated and is harmless – Dynamic information – Morphology • Pitfalls – Operator dependent • Demonstrate and report your variabilty – Bland Altman plots kimbredahl79@gmail.com
  • 6. Ultrasound imaging – What can be displayed Brightness mode (B- mode) also called grey- scale imaging -Morphology Colour Spectral analysis Doppler Ultrasound - Dynamics
  • 7. Brightness-mode Machinery CD Player – do you remember it? Receiver Loudspeaker Amplification Raw data
  • 8. Ultrasound equipment in short – two unit model Transducer Mechanical energy Filtered and amplified Received information Displayed Tissue
  • 9. Brightness depends on -Output power -Attenuation -Scattering -Acoustic impedance -Amplification of the returning signal called gain Skin Depth B-mode Two ways to increase signal intensity 1. Increase output power, which for safety reasons is fixed. 2. Increase amplification, which is the gain level (2D) Amplifier Filter Screen Mechanical energy Receiving element Transmitting element Output power Electric energy Tissue Tissue related Brightness mode (B-mode)
  • 10. Brightness mode (B-mode) Small adjustments to increase the image quality – focal zone Superficial focal zone
  • 11. • Worst images: ultrasound beam is parallel to the interface • Best images: ultrasound beam is perpendicular to the interface • interface From sound to image Operator dependent factors B-mode Clear definition of the arterial walls is a good indication of perpendicular position. kimbredahl79@gmail.com
  • 12. Heavily calcified arterial Aortic anterior wall Don’t blame the operator
  • 13. Brightness-mode – 3 buttons!!! Raw data Volume = gain →2D button Optimal gain level = some echo signal insight the vessel
  • 14. Brightness-mode 2. and 3. button Adjust the depth of your scanfield Region of interest: at least 1/3 of the scan field If you can get close it is good ☺
  • 17. From sound to image Superficial imaging: High frequency low penetration but better image resolution Depth of penetration depend on frequency. Abdominal imaging: Low frequency high penetration – Your neighbour’s bass is more clearly than the treble The lateral image resolution is poorer than the axial image resolution due to higher density of scan lines Linear array 9 MHz 17 MHz 3-5 MHz Curved array Transcranial or cardiac imaging: Large field of view compared to the size of the transducer face. Electronical steering Phased array
  • 18. 3-D transducer Real time biplane imaging Pixels total: Scan field Dimensions are known Pixels outside the segmentation Pixels inside = AAA kimbredahl79@gmail.com
  • 19. Transducer High-frequency Low-frequency - Marking on the left by your thumb - Towards the heart or cranial (carotid)
  • 23. Tasks for practical session later today • B-mode optimization – – Gain • A little echo-signal inside the vessel – Depth • The region of interest should occupy 1/3 of the display – Focus • On the far wall.
  • 24. Ultrasound imaging – What can be displayed Brightness mode (B- mode) also called grey- scale imaging -Morphology Colour Spectral analysis Doppler Ultrasound - Dynamics
  • 25. Doppler effect ”the Doppler shift” kimbredahl79@gmail.com
  • 26. Spectral analysis Flow towards the transducer will displayed as positive Flow away from the transducer will displayed as negative Tim e Linear velocity is displayed on the vertical –axis (cm/s) Proportion of blood cells at a particular speed along the third axis – brightness of the display Vessel
  • 27. Heart Foot In this example: Blood flow towards the transducer is coded red Blood flow away from the transducer is coded blue Colour Doppler • B-mode image with • Colour coded Doppler signals in the steering-box
  • 29. Spectral analysis Flow towards the transducer will displayed as positive Flow away from the transducer will displayed as negative Time Linear velocity is displayed on the vertical –axis (cm/s) Proportion of blood cells at a particular speed along the third axis – brightness of the display Vessel
  • 30. Heart Foot In this example: Blood flow towards the transducer is coded red Blood flow away from the transducer is coded blue Colour Doppler • B-mode image with • Colour coded Doppler signals in the steering-box
  • 33. SFA External Iliac artery Remember! The Doppler shift is based on Doppler equation where cosinus function is included, and cosinus to 90 degree is zero Colour Doppler 1 Cos (θ) Sin (θ) 0
  • 35. Colour Doppler Remember! The pulse repetition frequency is important in order to visualize blood-flow. Growth of a tree cannot be observed by watching every second! If the speed is high – you have to watch every second Low flow PRF too high PRF too low
  • 36. Display of Colour Doppler and spectrum Peak systolic velocity Mean velocity Framerate Angle θ Distance Colour scale Beam path (Steer) Colour Box Doppler angle Correction curser Doppler Angle θ Sample Volume
  • 37. Normal triphasic flow in peripheral artery 1. First phase systolic forward flow 2. Second phase diastolic flow reversal 3. Third phase diastolic forward flow 2 1 3 Blood flow in peripheral arteries Forward and reversed flow are seen simultaneously during the diastolic phase Reversal flow depends on the peripheral resistance After exercise The velocity of blood cells (or Doppler shift freq.) vary with time due to arterial pulsation Low resistance vessel -Organ supply kimbredahl79@gmail.com
  • 38. Normal Triphasic flow After releasing the cuff Normal Triphasic flow Recovery of peripheral resistance kimbredahl79@gmail.com
  • 39. Organ supply – Low resistance A. Mesenterica superior kimbredahl79@gmail.com
  • 40. Transition from laminar to turbulent flow Blood cells with multiple velocities Spectral broadening Laminar or Parabolic flow Disturbed flow Turbulent flow kimbredahl79@gmail.com
  • 41. Triphasic signal → Disturbed flow showing spectral broadening → Finally monophasic flow kimbredahl79@gmail.com
  • 42. kimbredahl79@gmail.com Flow profiles in stenoses • Velocity increase – fluid travels faster through the narrow section • Turbulence
  • 43. x3 Velocity profile in arterial stenosis Stenotic signal Post-stenotic signal Monofasic signal Tri-phasic signal Blood flow Velocity Decrease in diameter 50% At 70% reduction of diameter a pressure drop occur - and the stenosis are limiting the flow This correspond to a 2-3 fold increase in systolic velocity kimbredahl79@gmail.com
  • 44. Linear velocity Area = π . ¼ . D² D Flow volume = Cross section . Linear velocity Flow measurement kimbredahl79@gmail.com
  • 45. Dist 0.699 cm TAMV 13.8 cm/s Vol Flow 318 mL/ min Area 0.384 cm2 Flow measurement –The display TAMV: Time Averaged mean velocity = Mean velocity for each line of the sonogram averaged over a complete cardiac cycle Peak systolic velocity Mean velocity TAMV kimbredahl79@gmail.com
  • 46. Flow measurement and pitfalls • Sample volume • Doppler angle • Pulse repetition frequency • Doppler gain • Image resolution • Variation due to pulsation • The right imaging plane • Other pitfalls Related to linear velocity assessment kimbredahl79@gmail.com
  • 47. Small sample volume: Reflection only received from fast the fastest moving blood cells Small sample volume: Reflection will be received from all moving blood cells Vol flow = 477 mL / min Vol flow = 318 mL / min Sample volume and Linear velocity kimbredahl79@gmail.com
  • 48. fd = f0 – f1 = (2 x V x f0 x cos) / C When calculating the velocity (V) the angle estimation is very important – especially when  > 60. Example: Overestimating the angle by 5 • at 40  leads to an error of 7%. • at 75  leads to an error of 47% ! Conclusion: Keep the angel < 60  ! 30 60 80 0 10 100 Error in velocity % Degrees Doppler angle θ kimbredahl79@gmail.com
  • 49. Volume measurement - Doppler gain High gain → overloading of the instrument → poor direction discrimination Mirror image PSV and TAMV increase Ideal image PSV and TAMV decrease Too low gain → flow may not be detected The ideal gain level kimbredahl79@gmail.com
  • 50. Cross section The error is 0.084 cm or less than 1 mm. or 11 % Area = π . ¼ . D² The corresponding failure in vol flow is 21 % going from 459 mL to 362 mL kimbredahl79@gmail.com
  • 51. Diameter assessment and Image resolution L9-3 MHz L17-5 MHz Intima No intima For superficial structures take the transducer with the highest frequency available kimbredahl79@gmail.com
  • 52. Diameter assessment – when to measure Cardiac cycle kimbredahl79@gmail.com
  • 53. Cardiac cycle Upper LoA =4.7 mm Average 1, 94 mm kimbredahl79@gmail.com
  • 54. Challenges in systoly Diameter forskel Tid 1 sekund Frame rate = 18 By Henrik Sillesen kimbredahl79@gmail.com
  • 55. Cursor position 2-6 mm. Difference! kimbredahl79@gmail.com
  • 56. Diameter assessment – where to measure Taken the concept of acoustic impedance into account the ideal measurement would be from the most reproducible measurement is from leading edge adventitia ant. wall to leading edge adventitia posterior wall The most reproducible measurement The true volume flow From intima to intima kimbredahl79@gmail.com
  • 57. Karvæggen Leading edge of intima Tunica media Leading edge of adventitia – anterior wall Lumen Grænsen mellem tunica media og tunica adventitia kimbredahl79@gmail.com
  • 58. Cursor position Leading edge of intima Leading edge of adventitia kimbredahl79@gmail.com
  • 60. Volume flow and other pitfalls Not all vessels are circular Most scanners assume the mean Velocity of sound is 1540 m/s →Systematic underestimation of the Diameter Medium Speed (C) (m/s) Air 330 Water 1480 Blood 1570 Fat 1450 Muscle 1580 Bone 3500 Soft tissue (average) 1540 kimbredahl79@gmail.com
  • 61. Ultrasound Contrast media • Microbubbles ≈ Red blood cells. – Small enough to pass through the capillaries – Large enough to retain in the vascular system • Blood pool agent → Indicator dilution principal with a wah – Completely pulmonary eliminated Gas SF6 Poor interaction with other molecules Amphophilic shell -Stabilizes the gas -Flexible molecule
  • 62. Contrast specific imaging • Insonation power Instability → destruction Backscatter = Tissue Signal Low pressure High pressure Oscillation -Harmonic frequency -Specific signals ≠ Tissue signal
  • 63. Contrast specific imaging • In summary – Specific echo signal different from tissue • No tissue signals • No movement artifacts and blooming effects – Independent from blood flow velocity • No angle dependent color display • Better spatial resolution • Detect low flow – Good safety profile • No burden for the liver or kidneys • Allergic reactions are rare
  • 64. In practice • High end scanner with a contrast specific application • SonoVue – 20 gauge cannula – Forward injection in a cubital vein. – 1-2 ml. – Last 6 hours after mixture. – Anti-histamin and adrenalin.
  • 65. Contrast-enhanced ultrasound • If microvascular perfusion is important. – Diabetic patients • If luminal morphology is important – Plaque size and neovascularization – Thrombus size estimation – Near occlusion / complete occlusion – Flow detection
  • 66. Microvasculature C. Greis / Ultrasound contrast agents as markers of vascularity and microcirculation
  • 67. Peripheral arterial disease Healthy volunteer Lindner JR, Portland, Oregon. JACC: Cardiovascular imaging 2008
  • 69. Tasks for practical sessions • Doppler Ultrasound – Control colour box • Size and position • Steering – Pulse repetition frequency • Low and high – find the right level – Spectral analysis • Adjust size of sample volume • Obtain Doppler angle < 60 degrees – Extra option ”Walk the Doppler” from CFA to PFA.
  • 70. Repetition - If I want to do it right☺ Field of view 1. The right transducer: curved phased or linear array transducer 2. Adjust your B-mode image -Depth -Focal zone -Gain level 3. Apply colour Doppler image -Tilt the transducer or adjust steering level -Pulse repetition frequency level
  • 71. Repetition - If I want to do it right ☺ 4. Spectral Doppler analysis - Parallel to flow direction and keep the angle to the Beam path < 60º Beam path Flow direction
  • 72. The practical sessions 5. Be correctly seated and your right should work independently. Don’t look down! Keep eye on the road (Keyboard). And your left hand is as important as your right hand.
  • 73. If you want to know more • Vascular ultrasound How, why and when – Edited by Abigail Thrush and Tim Hartshorne • Quantitative evaluation of microvascular blood flow by contrast-enhanced ultrasound by C. Greis. Clinical Hemorheology and Microcirculation 49 (2011) 137-149 • Pubmed: Eiken FL et al. Diagnostic methods for measurement of peripheral blood flow during exercise in patients with type II diabetes and peripheral artery disease: a systematic review
  • 75. Transducer High-frequency Low-frequency - Marking on the left by your thumb - Towards the heart or cranial (carotid)
  • 79. Brightness-mode Machinery CD Player – do you remember it? Receiver Loudspeake r Amplificatio n Raw data
  • 80. Ultrasound equipment in short – two unit model Transducer Mechanica l energy Filtered and amplified Received informatio n Displaye d Tissue
  • 81. Brightness-mode – 3 buttons!!! Raw data Volume = gain →2D button Optimal gain level = some echo signal insight the vessel
  • 82. Brightness-mode 2. and 3. button Adjust the depth of your scanfield Region of interest: at least 1/3 of the scan field If you can get close it is good ☺
  • 83. Ultrasound imaging – What can be displayed Brightness mode (B- mode) also called grey- scale imaging -Morphology Colour Spectral analysis Doppler Ultrasound - Dynamics
  • 84. Spectral analysis Flow towards the transducer will displayed as positive Flow away from the transducer will displayed as negative Tim e Linear velocity is displayed on the vertical –axis (cm/s) Proportion of blood cells at a particular speed along the third axis – brightness of the display Vessel
  • 85. Heart Foot In this example: Blood flow towards the transducer is coded red Blood flow away from the transducer is coded blue Colour Doppler • B-mode image with • Colour coded Doppler signals in the steering-box
  • 87. SFA External Iliac artery Remember! The Doppler shift is based on Doppler equation where cosinus function is included, and cosinus to 90 degree is zero Colour Doppler 1 Cos (θ) Sin (θ) 0
  • 88. Colour Doppler Remember! The pulse repetition frequency is important in order to visualize blood-flow. Growth of a tree cannot be observed by watching every second! If the speed is high – you have to watch every second Low flow PRF too high PRF too low
  • 89. Display of Colour Doppler and spectrum Peak systolic velocity Mean velocity Framerat e Angle θ Distance Colour scale Beam path (Steer) Colour Box Doppler angle Correction curser Doppler Angle θ Sample Volume
  • 90. Sup. Fem. artery Sup. Fem. artery If the Doppler waveform doesn’t look right
  • 91. Tasks for practical sessions • Doppler Ultrasound – Control colour box • Size and position • Steering – Pulse repetition frequency • Low and high – find the right level – Spectral analysis • Adjust size of sample volume • Obtain Doppler angle < 60 degrees – Extra option ”Walk the Doppler” from CFA to PFA.
  • 92. Repetition - If I want to do it right☺ Field of view 1. The right transducer: curved phased or linear array transducer 2. Adjust your B-mode image -Depth -Focal zone -Gain level 3. Apply colour Doppler image -Tilt the transducer or adjust steering level -Pulse repetition frequency level
  • 93. Repetition - If I want to do it right ☺ 4. Spectral Doppler analysis - Parallel to flow direction and keep the angle to the Beam path < 60º Beam path Flow direction
  • 94. The practical sessions 5. Be correctly seated and your right hand works independently. Don’t look down! Keep eye on the road (Keyboard). And your left hand is as important as your right hand.
  • 95. Contents • The clinical use of ultrasound in vascular surgery • From sound to image – theory 10 min. • Doppler effect / doppler shift – Displaying the doppler signal – Flow profiles • Colour doppler • Volume measurement – Pitfalls • Hands on session kimbredahl79@gmail.com
  • 96. Ischemic disease • Patient’s complaint • Objective – Peripheral blood pressure – Dynamic flow visualization • Linear flow velocities • Flow pattern kimbredahl79@gmail.com
  • 97. Aneurysm size or mophology Accuracy is important Standard protocol is pivotal -Cardiac cycle -Delineation of the vessel wall -Image plan; 3D ultrasound • Ultrasound contrast – Morphology • Thrombus or plaque size – delineates the lumen/thrombus kimbredahl79@gmail.com
  • 98. Leakage • Flow detection • Ultrasound contrast – Low flow – Microperfusion kimbredahl79@gmail.com
  • 99. Ultrasound = High frequency sound that induces local periodic displacement of particles in the medium Transducer on Transducer off Displacement Depth λ Frequency (f) = 1/τ, number of cycles of displacements during 1 second (Hz). Medical ultrasound scanner typically use frequencies between 2 – 15 MHz kimbredahl79@gmail.com
  • 100. Transducer Piezo-electro elements Gel fd = fr – ft = ( 2 x V x ft x Cos θ) / C Receiving element Red cells = moving source, Transducer = stationary observer Doppler-effect Transmitting element Transducer = stationary source Red cells = Moving observer. θ : Angle of insonation C: Speed of sound in tissue (1540 m/s) V: Velocity of blood fr: Receiving frequency ft: Transmitted frequency kimbredahl79@gmail.com
  • 101. The Doppler signal of flowing blood contains a range of velocities (or Doppler shift frequencies) Bloods cells near the vessel wall will move more slowly Displaying the doppler signal Velocity time kimbredahl79@gmail.com
  • 102. Output power Electric energy Transmitting element Receiving element Amplifier Analyser Screen From sound to image Transducer: Converts energy into another form of energy Ultrasound machine interprets the receiving information Mechanical energy Vibration Tissue High-End Frame rate depends on -Machine power -Work load Reduce field of view. Steady patient! Low-End Two possibilities to increase signal intensity -Increase output power, which is often locked - Increase amplification, which is the gain level (2D) but at a certain level signal ≠ noise kimbredahl79@gmail.com
  • 103. From sound to image: Brightness mode (B-mode) Skin Brightness proportional to amplitude of echoes – grey scale We assume the speed of ultrasound through the tissue is constant, and we know the generated frequency then we can predict the distance from the source to the reflective boundary Medium Speed (C) (m/s) Air 330 Water 1480 Blood 1570 Fat 1450 Muscle 1580 Bone 3500 Soft tissue (average) 1540 Depth Distance = (Time . C) / 2 kimbredahl79@gmail.com
  • 104. Output power Electric energy Transmitting element Receiving element Amplifier Analyser Screen From sound to image Transducer: Converts energy into another form of energy Ultrasound machine interprets the receiving information Two possibilities to increase signal intensity -Increase output power, which is often locked - Increase amplification, which is the gain level (2D) but at a certain level signal ≠ noise kimbredahl79@gmail.com
  • 105. From sound to image Superficial imaging: Depth of penetration depend on frequency. High frequency low penetration but better image resolution Abdominal imaging: Low frequency high penetration – Your neighbour’s bass is more clearly than the treble The lateral image resolution is poorer the axial image resolution due to higher density of scan lines Linear array 9 MHz 13 MHz 3-5 MHz Curved array Cardiac imaging: Large field of view compared to the size of the transducer face. Electronical steering Phased array kimbredahl79@gmail.com
  • 106. Difference in acoustic impedance determines reflection rate From sound to image – Acoustic impedance: resistance against passage of the sound wave Similar acoustic impedance • Muscle/blood (ratio=0.03) • Fat/muscle (0.10) • Low/moderate reflection - ideal for US Different acoustic impedance • soft tissue/air (ratio=0.999) • soft tissue/bone (0.65) • High reflection – not ideal for US imaging kimbredahl79@gmail.com
  • 107. Colour Doppler ultrasound • B-mode grey-scale image + • Colour coded Doppler signals in the colour-box Blood flow towards the transducer is (probably) coded red Blood flow away from the transducer is coded blue Arterial flow Venous flow Primarily used for flow detection
  • 108. θ The doppler shift depends on the angle θ Cos (θ) Sin (θ) Doppler angle θ = 90 then Cos(90) = 0 1 0 kimbredahl79@gmail.com
  • 110. The Doppler spectrum displays: Time along the horizontal axis Velocity (Doppler shift) along the vertical axis Proportion of blood cells at a particular speed along the third axis – brightness of the display Displaying the doppler signal Blue The mean velocity Peak systolic velocity kimbredahl79@gmail.com
  • 111. Repetition - If I want to do it right☺ Field of view 1. Ultrasound equipment and find the on/off button 2. The right transducer: curved phased or linear array transducer 3. Adjust your B-mode image -Depth -Focal zone -Gain level 4. Apply color doppler image -Tilt the transducer or adjust steering level -Pulse repetition frequency level -Doppler gain level kimbredahl79@gmail.com
  • 112. Repetition - If I want to do it right ☺ 5. Spectral doppler analysis - Parallel to flow direction and keep the angle to the Beam path < 60º Beam path Flow direction 6. Volume flow measurement -The most important factor is the diameter assessment kimbredahl79@gmail.com
  • 113. Sup. Fem. artery Sup. Fem. artery Underestimate the true velocity Align the transducer with reasonable length of the vessel Out of image kimbredahl79@gmail.com
  • 114. 6 PRF too high PRF too low Aliasing – Flow is going backwards 12 9 3 45 min later 90 min later 135 min later Pulse Repetition Frequency PRF / scale Especially low flow is not detected kimbredahl79@gmail.com
  • 115. Sup. Fem. artery Sup. Fem. artery If the Doppler waveform doesn’t look right
  • 116. Colour Doppler ultrasound B-mode image + Doppler curve = Duplex kimbredahl79@gmail.com
  • 117. Contents • From sound to image – theory 10 min. • Doppler effect / doppler shift – Displaying the doppler signal – Flow profiles • Colour doppler • Volume measurement • Contrast-enhanced ultrasound kimbredahl79@gmail.com
  • 118. Display of Colour Doppler and spectrum Colour scale Framerate Angle θ Doppler Angle θ Beam path (Steer) Colour Box Doppler angle Correction curser Sample Volume Distance Peak systolic velocity Mean velocity kimbredahl79@gmail.com
  • 119. Karvæggens bestanddele Små glatte muskelceller og elastisk fibre Endothelceller Adventitia består mest af kollagen Stor forskel i akustisk impedans fra lav til høj → Refleksion ↑ Måler aldrig IMT på forreste væg kimbredahl79@gmail.com