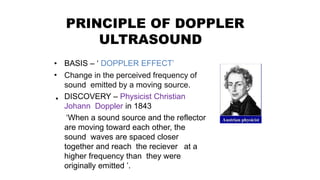
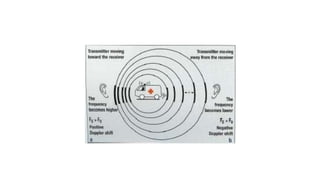
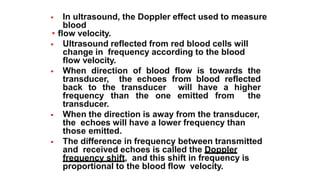
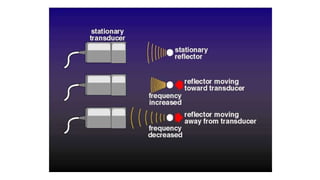
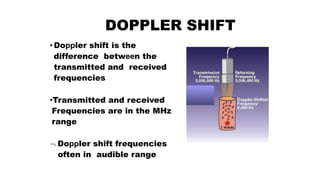
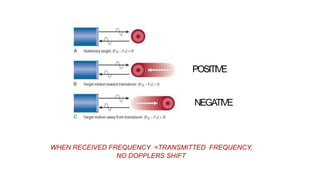
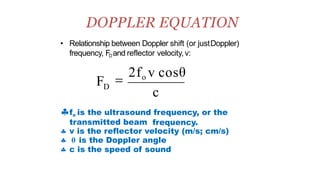
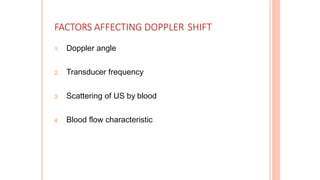
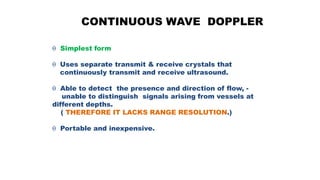
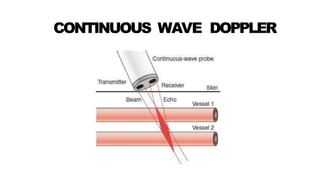
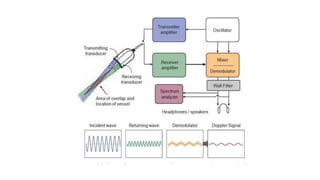
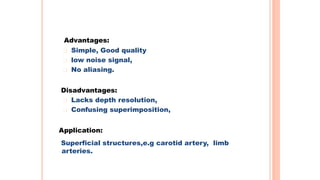
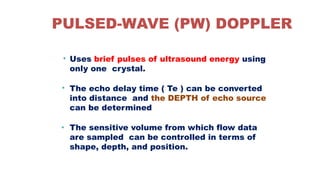
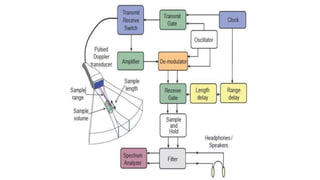
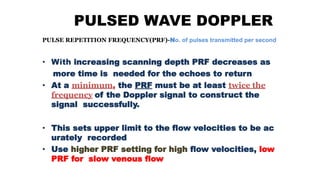
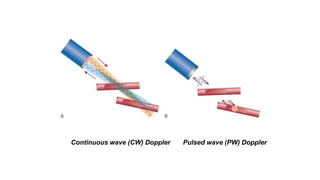
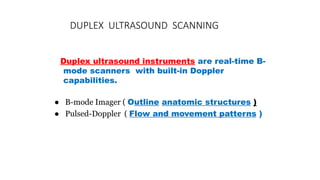
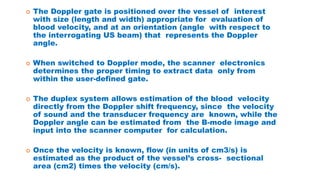
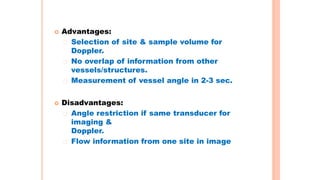
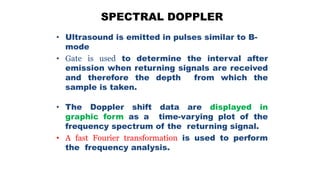
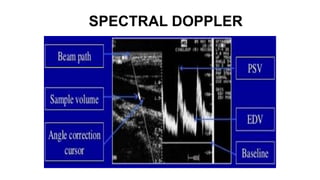
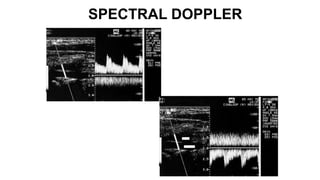
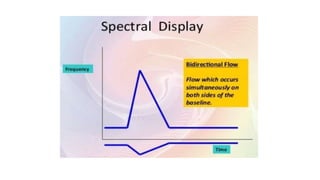
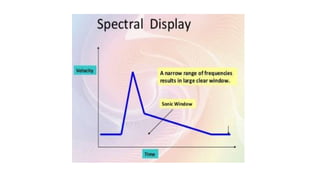
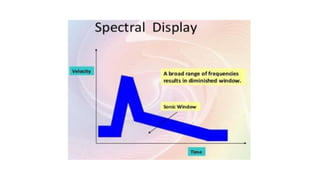
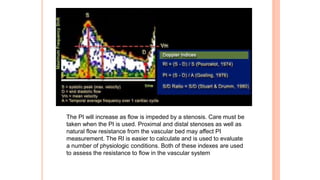
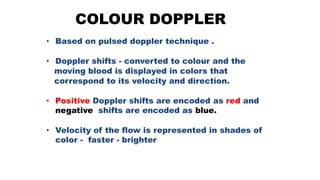
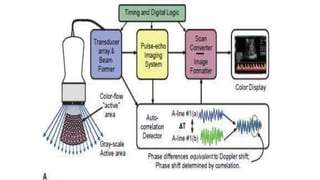
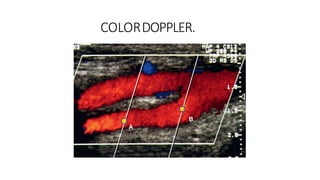
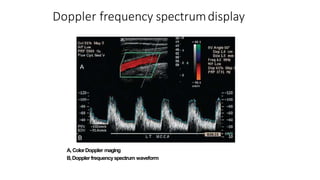
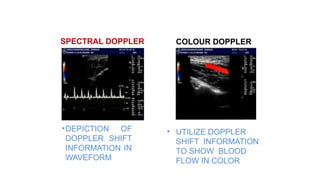
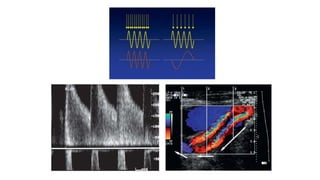
Doppler ultrasound uses the Doppler effect to measure blood flow velocity. It works by transmitting ultrasound pulses that reflect off moving red blood cells, with the frequency of the returning echoes shifted based on the velocity of flow. Continuous wave Doppler lacks depth resolution while pulsed wave Doppler can determine depth but has limitations on maximum detectable velocity. Duplex scanning combines B-mode imaging with pulsed Doppler to allow visualization of anatomy and measurement of flow velocities within vessels. Spectral Doppler analysis displays the distribution of velocities over time as a spectrum, providing quantitative flow information. Proper Doppler technique requires optimizing factors like transducer frequency, Doppler angle, and sample volume placement.
2. PRINCIPLE OF DOPPLER
ULTRASOUND
•
•
•
BASIS – ‘ DOPPLER EFFECT’
Change in the perceived frequency of
sound emitted by a moving source.
DISCOVERY – Physicist Christian
Johann Doppler in 1843
‘When a sound source and the reflector
are moving toward each other, the
sound waves are spaced closer
together and reach the reciever at a
higher frequency than they were
originally emitted ’.
3.
4. In ultrasound, the Doppler effect used to measure
blood
• flow velocity.
Ultrasound reflected from red blood cells will
change in frequency according to the blood
flow velocity.
When direction of blood flow is towards the
transducer, the echoes from blood reflected
back to the transducer will have a higher
frequency than the one emitted from the
transducer.
When the direction is away from the transducer,
the echoes will have a lower frequency than
those emitted.
The difference in frequency between transmitted
and received echoes is called the Doppler
frequency shift, and this shift in frequency is
proportional to the blood flow velocity.
5.
6. •Doppler shift is the
difference between the
transmitted and received
frequencies
•Transmitted and received
Frequencies are in the MHz
range
Doppler shift frequencies
often in audible range
DOPPLER SHIFT
8. • Relationship between Doppler shift (or justDoppler)
frequency, FDand reflector velocity,v:
fo is the ultrasound frequency, or the
transmitted beam frequency.
v is the reflector velocity (m/s; cm/s)
θ is the Doppler angle
c is the speed of sound
DOPPLER EQUATION
c
FD
2fo v cosθ
9. FACTORS AFFECTING DOPPLER SHIFT
1. Doppler angle
2. Transducer frequency
3. Scattering of US by blood
4. Blood flow characteristic
10. 1. DOPPLER ANGLE
Also known as the angle of insonation.
Estimated by a process known as angle correction,
which involves aligning an indicator on the duplex
image along the longitudinal axis of the vessel.
Few considerations that affect the performance of a
Doppler examination:
The cosine of 90° is zero, so if the ultrasound beam is
perpendicular to the direction of blood flow, there will be no
Doppler shift and it will appear as if there is no flow in the
vessel
The angle of insonation should also be less than 60° at all
times, since the cosine function has a steeper curve above
this angle, and errors in angle correction will be magnified
12. ANGLE EFFECTS
Maximum Doppler shift at 0 degrees minimum at 90
degrees – proportional to the Cosine of the angle
between the beam and direction of travel.
Direction of movement
13. Effect of the Doppler angle in the sonogram. Higher-frequency Doppler signal is
obtained if the beam is aligned more to the direction of flow. In the diagram, beam
(A) is more aligned than (B) and produces higher-frequency Doppler signals. The
beam/flow angle at (C) is almost 90° and there is a very poor Doppler signal. The
flow at (D) is away from the beam and there is a negative signal.
14. 11
If the beam direction is perpendicular to the
direction of flow, the Doppler frequency is ZERO!
15. 2. TRANSDUCER FREQUENCY
Increase in transducer frequency causes increased
doppler frequency shift.
At frequencies between 2-10 MHz, doppler shift
comparatively small & in audible range (shift from 0-
10 KHz) for most physiological motion (for velocity
range from 0-100 cm/s).
Change of frequency → measurable → movement of
reflector towards/away from transducer.
Depending on ↑ or ↓ in frequency → direction of
movement.
17. 3. SCATTERING OF US BY BLOOD
Smooth wall of blood vessel → specular reflection
→ strong echoes.
Us wavelength > size of RBCs → scattering of
wave in all directions (Rayleigh-Tyndall scattering).
Size of echo from blood → ↓.
Intensity of scattered us ↑ with 4th power of
frequency as images of vessel lumen differ
significantly with instruments of different frequency.
18. 4. CHARACTERISTICS OF BLOOD FLOW
Blood (viscous medium) → wall exerts drag effect on
moving blood → slow movement near the wall than center.
Non pulsatile flow with low velocity → parabolic velocity
profile → laminar flow.
Fast /accelerated flow → same velocity all over → plug
flow.
Major artery → plug flow during systole & laminar flow
during diastole. Venous flow → laminar.
19. FLOW PATTERNS
Laminar flow
Highest in center
Zero at wall
Turbulent flow
Larger distribution of
velocities
16
21. CONTINUOUS WAVE DOPPLER
Simplest form
Uses separate transmit & receive crystals that
continuously transmit and receive ultrasound.
Able to detect the presence and direction of flow, -
unable to distinguish signals arising from vessels at
different depths.
( THEREFORE IT LACKS RANGE RESOLUTION.)
Portable and inexpensive.
25. •
•
Uses brief pulses of ultrasound energy using
only one crystal.
The echo delay time ( Te ) can be converted
into distance and the DEPTH of echo source
can be determined
The sensitive volume from which flow data
are sampled can be controlled in terms of
shape, depth, and position.
•
PULSED-WAVE (PW) DOPPLER
26.
27. PULSED WAVE DOPPLER
PULSE REPETITION FREQUENCY(PRF)-No. of pulses transmitted per second
• With increasing scanning depth PRF decreases as
more time is needed for the echoes to return
• At a minimum, the PRF must be at least twice the
frequency of the Doppler signal to construct the
signal successfully.
• This sets upper limit to the flow velocities to be ac
urately recorded
• Use higher PRF setting for high flow velocities, low
PRF for slow venous flow
29. Aliasing of the spectral Doppler display is characterized by "wraparound“
of the highest velocities to the opposite direction when the sampling (PRF)
is inadequate. Right: Without changing the overall velocity range, the
spectral baseline is shifted to incorporate higher forward velocity and less
reverse velocity to avoid aliasing. The maximum, average, and minimum
spectral Doppler display values allow quantitative determination of
clinically relevant information such as pulsatility index and resistive index.
31. DUPLEX ULTRASOUND SCANNING
Duplex ultrasound instruments are real-time B-
mode scanners with built-in Doppler
capabilities.
● B-mode Imager ( Outline anatomic structures )
● Pulsed-Doppler ( Flow and movement patterns )
32. The Doppler gate is positioned over the vessel of interest
with size (length and width) appropriate for evaluation of
blood velocity, and at an orientation (angle with respect to
the interrogating US beam) that represents the Doppler
angle.
When switched to Doppler mode, the scanner electronics
determines the proper timing to extract data only from
within the user-defined gate.
The duplex system allows estimation of the blood velocity
directly from the Doppler shift frequency, since the velocity
of sound and the transducer frequency are known, while the
Doppler angle can be estimated from the B-mode image and
input into the scanner computer for calculation.
Once the velocity is known, flow (in units of cm3/s) is
estimated as the product of the vessel’s cross- sectional
area (cm2) times the velocity (cm/s).
33. Advantages:
Selection of site & sample volume for
Doppler.
No overlap of information from other
vessels/structures.
Measurement of vessel angle in 2-3 sec.
Disadvantages:
Angle restriction if same transducer for
imaging &
Doppler.
Flow information from one site in image
35. SPECTRAL DOPPLER
• Ultrasound is emitted in pulses similar to B-
mode
• Gate is used to determine the interval after
emission when returning signals are received
and therefore the depth from which the
sample is taken.
• The Doppler shift data are displayed in
graphic form as a time-varying plot of the
frequency spectrum of the returning signal.
• A fast Fourier transformation is used to perform
the frequency analysis.
36. • SPECTRAL ANALYSIS shows the Doppler
shift spectrum and direction ,usually
displayed as the maximum velocity rather
than frequency
Provides QUANTITATIVE INFORMATION•
37. The resulting Doppler frequency
spectrum displays the following :
Variation with time of the Doppler
frequencies present in the volume
sampled.
The envelope of the spectrum, representing the
maximum frequencies present at any given
point in time.
The width of the spectrum at any point, indicating
the range of frequencies present.
43. 2.DIRECTION OF FLOW
• Pulsed doppler use quadrature phase
detection to provide bidirectional doppler
information
FLOWCAN EITHER BE
• Mono-phasic
• Bi-phasic
• Tri-phasic
• Bidirectional
44.
45.
46.
47.
48. • The spectrum displays echo amplitude by
varying the brightnes of the display
The amplitude of the echoes are determined
by
•
•
•
•
Echo intensity
Power
Gain
Dynamic range
3 . AMPLITUDE
49.
Recieved doppler shift consists of a range of
frequencies
Narrow range of frequencies will result in a
narrow display line.
The clear underneath the spectrum is called the
window
4. WINDOW
50.
51.
52. SPECTRUM BROADENING :
• Refers to presence of a large range of flow velocities
at a given point in the pulse cycle and, by indicating
turbulance,is an important criterion of high grade vessel
narrowing
• Loss of spectral window is called SPECTRAL
BROADENING
OCCURS-
• As the blood decelerates in diastole
• SV placed close to the vessel wall
• In small vessels ( parabolic velocity profile )
53. • Tortous vessels
• Low flow states
• Excessive gain/power/dynamic range
IT IS HALLMARK OF DISTURBED AND/OR
TURBULENT FLOW
54.
55. 5 . PULSATILITY
• Measures the difference between the maximum
and minimum velocities within the cardiac cycle
• Indices are unit less
• All increase in value as flow pulsatility increases
• Can be measured without knowledge of the
doppler angle
56.
57. Pulsed-wave US spectrum displays the maximum, minimum,
and average calculated blood flow velocities. The pulsatility
index, resistivity index, and systolic-to-diastolic ratio are
calculated from these values
DOPPLER INDICES
58. DOPPLER INDICES
•
•
•
•
•
PI = S-D/Vm ( GOSLING )
RI = S-D/S ( POURCELOT )
S /D Ratio
Acceleration time ( AT) & Acceleration Index ( AI)
SPECTRAL BROADENING
Changes in doppler indices from normal may help
in early identification of rejection of transplanted
organs,parenchymal dysfunction, and malignancy.
59. The PI will increase as flow is impeded by a stenosis. Care must be
taken when the PI is used. Proximal and distal stenoses as well as
natural flow resistance from the vascular bed may affect PI
measurement. The RI is easier to calculate and is used to evaluate
a number of physiologic conditions. Both of these indexes are used
to assess the resistance to flow in the vascular system
61. COLOUR DOPPLER
• Based on pulsed doppler technique .
• Doppler shifts - converted to colour and the
moving blood is displayed in colors that
correspond to its velocity and direction.
• Positive Doppler shifts are encoded as red and
negative shifts are encoded as blue.
• Velocity of the flow is represented in shades of
color - faster - brighter
64. •
•
•
•
COLOR BOX
Operator adjustable area within
the US image
Affects Image resolution & quality
( change in box size )- Frame rate
decreases with increasing box
size
As small & superficial as possible
Deep color box – slower PRF
results aliasing
66. COLOUR DOPPLER
Advantages
It provides an overall view of flow in
organ or structure
Provides directional information about
flow,
Provides velocity information about
flow and shows turbulent type flow
67. • Limitations :
• SEMI QUANTITATIVE
• Angle dependence
• Aliasing
• Artifacts caused by the noise
• Inability to display entire doppler spectrum in the
image
• Poor temporal resolution
70. SPECTRAL DOPPLER
ADVANTAGES
• depicts quantitaive flow
at one site
• allows calculations
of velocity and
indices
• good temporal resolution
COLOR DOPPLER
ADVANTAGES
• Overall view of flow
• Directional information
about flow
• Averaged velocity
information about flow
72. POWER DOPPLER
• Also known as Energy Doppler / Amplitude
Doppler.
• In this mode, colour is assigned to the power
/strength/ energy of the Doppler signal rather
than the Doppler frequency shift.
• Flow is usually displayed with one colour
USES
1. To detect very slow flow, flow in small
vessels, or where transducer angling is
awkward.
2. Power Doppler can be used in conjunction
with contrast agents of varying brightness
74. POWERDOPPLER
• Advantages
Angle independent
No aliasing
Improved signal to
noise ratio
More sensitive to
detect low flow
Better able to
define
boundaries
Limitations
No directional
information
Poor temporal resolution
(due to relatively low
PRF ).
Due to the low PRF,
power Doppler is
particularly sensitive
to flash artefact
75. OPTIMISATION OF COLORFLOW
DOPPLER EXAMINATION
1. TransducerFrequency.
• For superficial structures 7-10MHZ is
used. For deep abdominal structures –
3MHZ – 5MHZ is optimal.
• Choice of transducer frequency is paramount
because the intensity of the scattered sound
varies in proportion to the 4th power of the
Doppler frequency.
76. 2.Doppler Angle.
• Strongest signals of Doppler
results when the motion is
parallel to beam.
• A Doppler angle of 900 does
not display flow because no
doppler shift detected.
77. 3. Sample Volume.
•
•
• Ideal sample volume – 2/3rd of
the vessel width positioned in
the center of the vessel.
If sample volume is more: -
Spectral broadening
If sample volume is less: Measured
velocity is too low.
78. 4. Wall Filters.
• Cut off of the low frequency
noises, a cleaner high
velocity blood flow signal is
displayed.
• If set too high the blood flow
is discarded, if set low noise
will be more.
5. Doppler Gain.
• Controls the amplitude of the
colour display in colour or
power Doppler mode & the
spectral display in pulse
Doppler mode.
Excess gain
PSV = 75 cm/sec
Proper gain
60 cm/sec
Insufficent gain
50 cm/sec
79. 6. Velocity scale.
• Controls the range of frequencies
displayed
• Too high scale- dynamic range is too
large and low velocity signals are
missed simulating an area of
thrombosis
• If scale is too low the dynamic range is
too small to display the high velocity
signals accurately resulting in
aliasing.
81. 1 . ALIASING
An inaccurate display of colour or spectral
Doppler velocity when the velocity range
exceeds the scale available to display it.
Nyquist sampling rate-
PRF = 2 x fD
82.
83. How to reduce ALIASING ?
• Drop the base line
• Increase the available velocity
range.
• Decrease the Doppler
frequency shift by using a
lower insolating frequency or
• Increasing the Doppler angle.
84. • Power Doppler has no aliasing because it has
no directional or velocity component.
Advantage: -
• 1. useful for localizing the highest velocity
region.
• 2. It is used in identifying the abnormal area
in TIPSS & in localizing AV fistulae.
Disadvantage:- high velocity may not be accurately
measured.
85. • Caused by abnormally high
gain settings.
• Causes the obscuration of
thrombus or plaques in the
vessel.
- Also seen with
ultrasound contrast
agents
2 . Blooming Artifact ( Colour Bleed )
86. 3 . Flash Artifact
• Manifests as a color signal due
to transducer or patient motion
It is seen in left lobe of liver due
to cardiac pulsation and in
hypoechoic areas such as cysts
and fluid collections.
•
87. 4.Mirror Image artifact :
•
•
• Displays objects on both sides of a
strong reflector,
Thereflectors (diaphragm, pleural
surface and aortic wall) directs some of
the echoes to asecond reflector before
it returns them to the transducer
resulting multipath reflection.
Eg .Duplication of sub clavian
artery (pleura reflector)
88. 5 . Twinkling artifact
• Appears as descrete focus of
alternating colors behind
echogenic object
e.g: Renal Calculi, bladder
calcification and cholesterol
crystals in the gall bladder
• FB like iron fillings, aneurysm
coil produce this artifact.
89. GUIDELINES FOR AN OPTIMAL
COLOUR FLOW DOPPLER
EXAMINATION.
• The colour flow box should be kept as small
& superficial as possible
Adjust the gain and filter settings
Adjust the velocity scale (PRF) and baseline
according to the flow conditions.
•
•
90. • Obtain an optimal Doppler angle by adjusting
the beam steering and probe position. ( 600
or less )
• Adjust the pulsed Doppler sample volume
size (gate) appropriately (2/3rd of the vessel
diameter)
• AVOID TRANSDUCER MOTION.