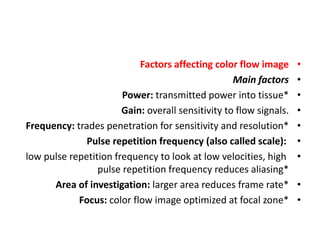
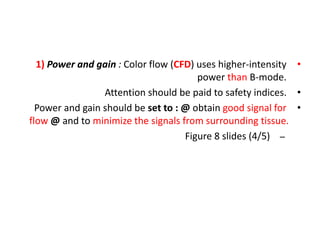
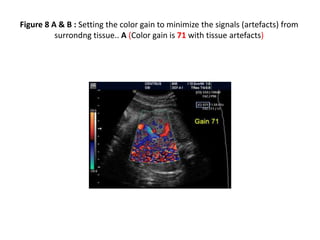
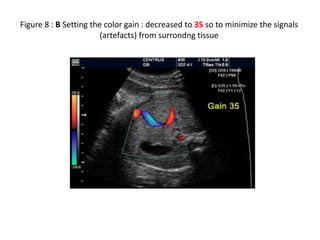
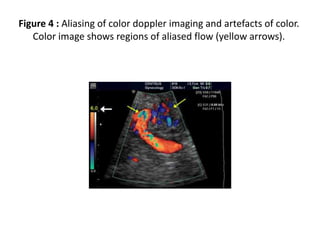
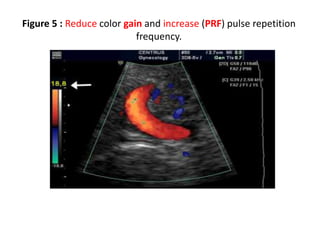
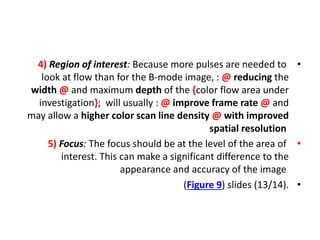
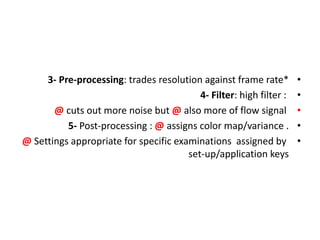
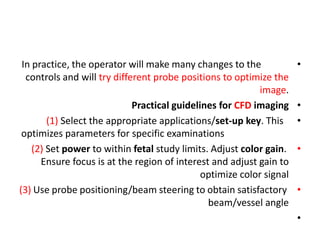
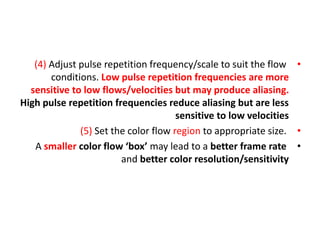
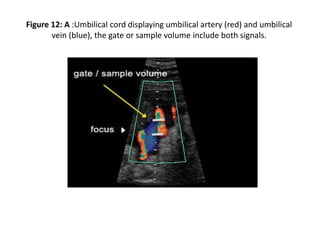
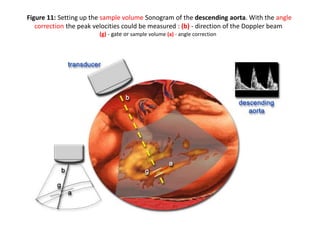
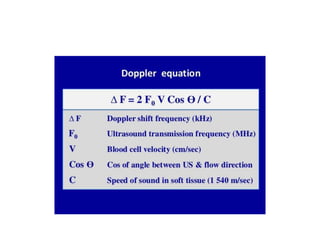
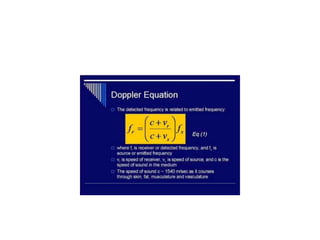
1) Doppler ultrasound uses various settings and factors to optimize color flow images of blood flow, including power, gain, frequency, pulse repetition frequency, region of interest, and focus.
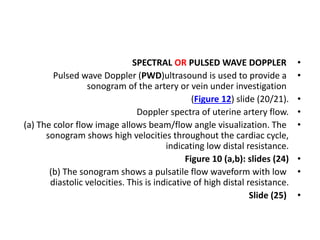
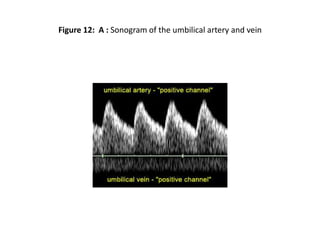
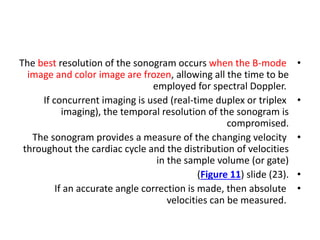
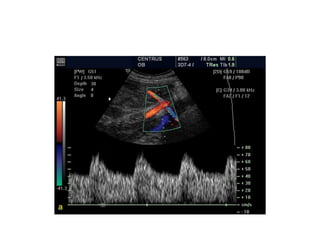
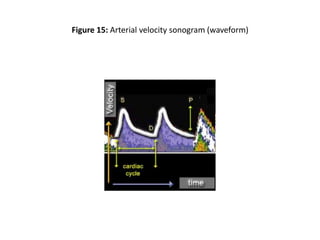
2) Spectral Doppler provides pulsed wave Doppler sonograms of blood flow velocities throughout the cardiac cycle but can be compromised if used with concurrent imaging.
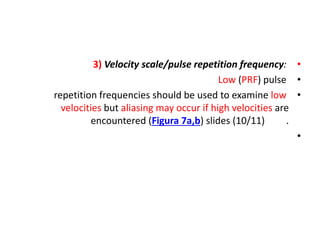
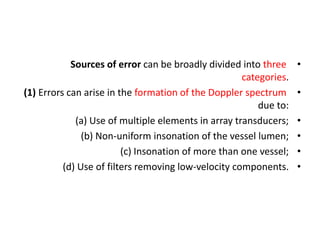
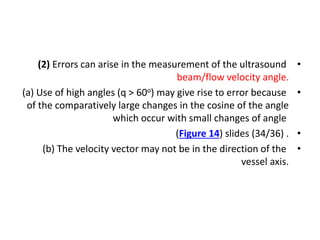
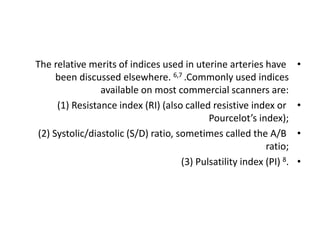
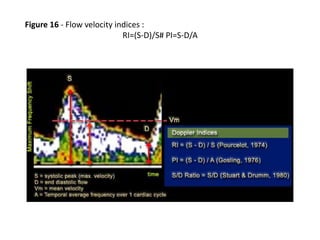
3) Measuring blood flow velocities can involve errors from spectral analysis, angle measurement above 60 degrees, and calculating absolute flow, so non-dimensional waveform analysis is often used instead.


![Doppler principles [2]](https://cdn.slidesharecdn.com/ss_thumbnails/dopplerprinciples2-210517111747-thumbnail.jpg?width=640&height=640&fit=bounds)


![Hepatic doppler us [2]](https://cdn.slidesharecdn.com/ss_thumbnails/hepaticdopplerus2-210813103451-thumbnail.jpg?width=640&height=640&fit=bounds)
![Hepatic doppler us [3]](https://cdn.slidesharecdn.com/ss_thumbnails/hepaticdopplerus3-210813102908-thumbnail.jpg?width=640&height=640&fit=bounds)
![Hepatic dopp us [1]](https://cdn.slidesharecdn.com/ss_thumbnails/hepaticdoppus1-210813101656-thumbnail.jpg?width=640&height=640&fit=bounds)


![Umbilical artery doppler [1]](https://cdn.slidesharecdn.com/ss_thumbnails/umbilicalarterydoppler1-210517112207-thumbnail.jpg?width=640&height=640&fit=bounds)
![Doppler principles [1]](https://cdn.slidesharecdn.com/ss_thumbnails/dopplerprinciples1-210517111539-thumbnail.jpg?width=640&height=640&fit=bounds)
![Hepatic doppler us [3]](https://cdn.slidesharecdn.com/ss_thumbnails/hepaticdopplerus3-210517111042-thumbnail.jpg?width=640&height=640&fit=bounds)
![Hepatic doppler us [2]](https://cdn.slidesharecdn.com/ss_thumbnails/hepaticdopplerus2-210517110832-thumbnail.jpg?width=640&height=640&fit=bounds)
![Hepatic dopp us [1]](https://cdn.slidesharecdn.com/ss_thumbnails/hepaticdoppus1-210517110108-thumbnail.jpg?width=640&height=640&fit=bounds)


![PERI-PROSTHETIC FRACTURE NAIL-PLATE CONSTRUCT [NPC].pptx](https://cdn.slidesharecdn.com/ss_thumbnails/drarunkumardrmohamedashrafperiprostheticfrasturenail-plateconstructnpc-260209164459-7e9d15a1-thumbnail.jpg?width=640&height=640&fit=bounds)


