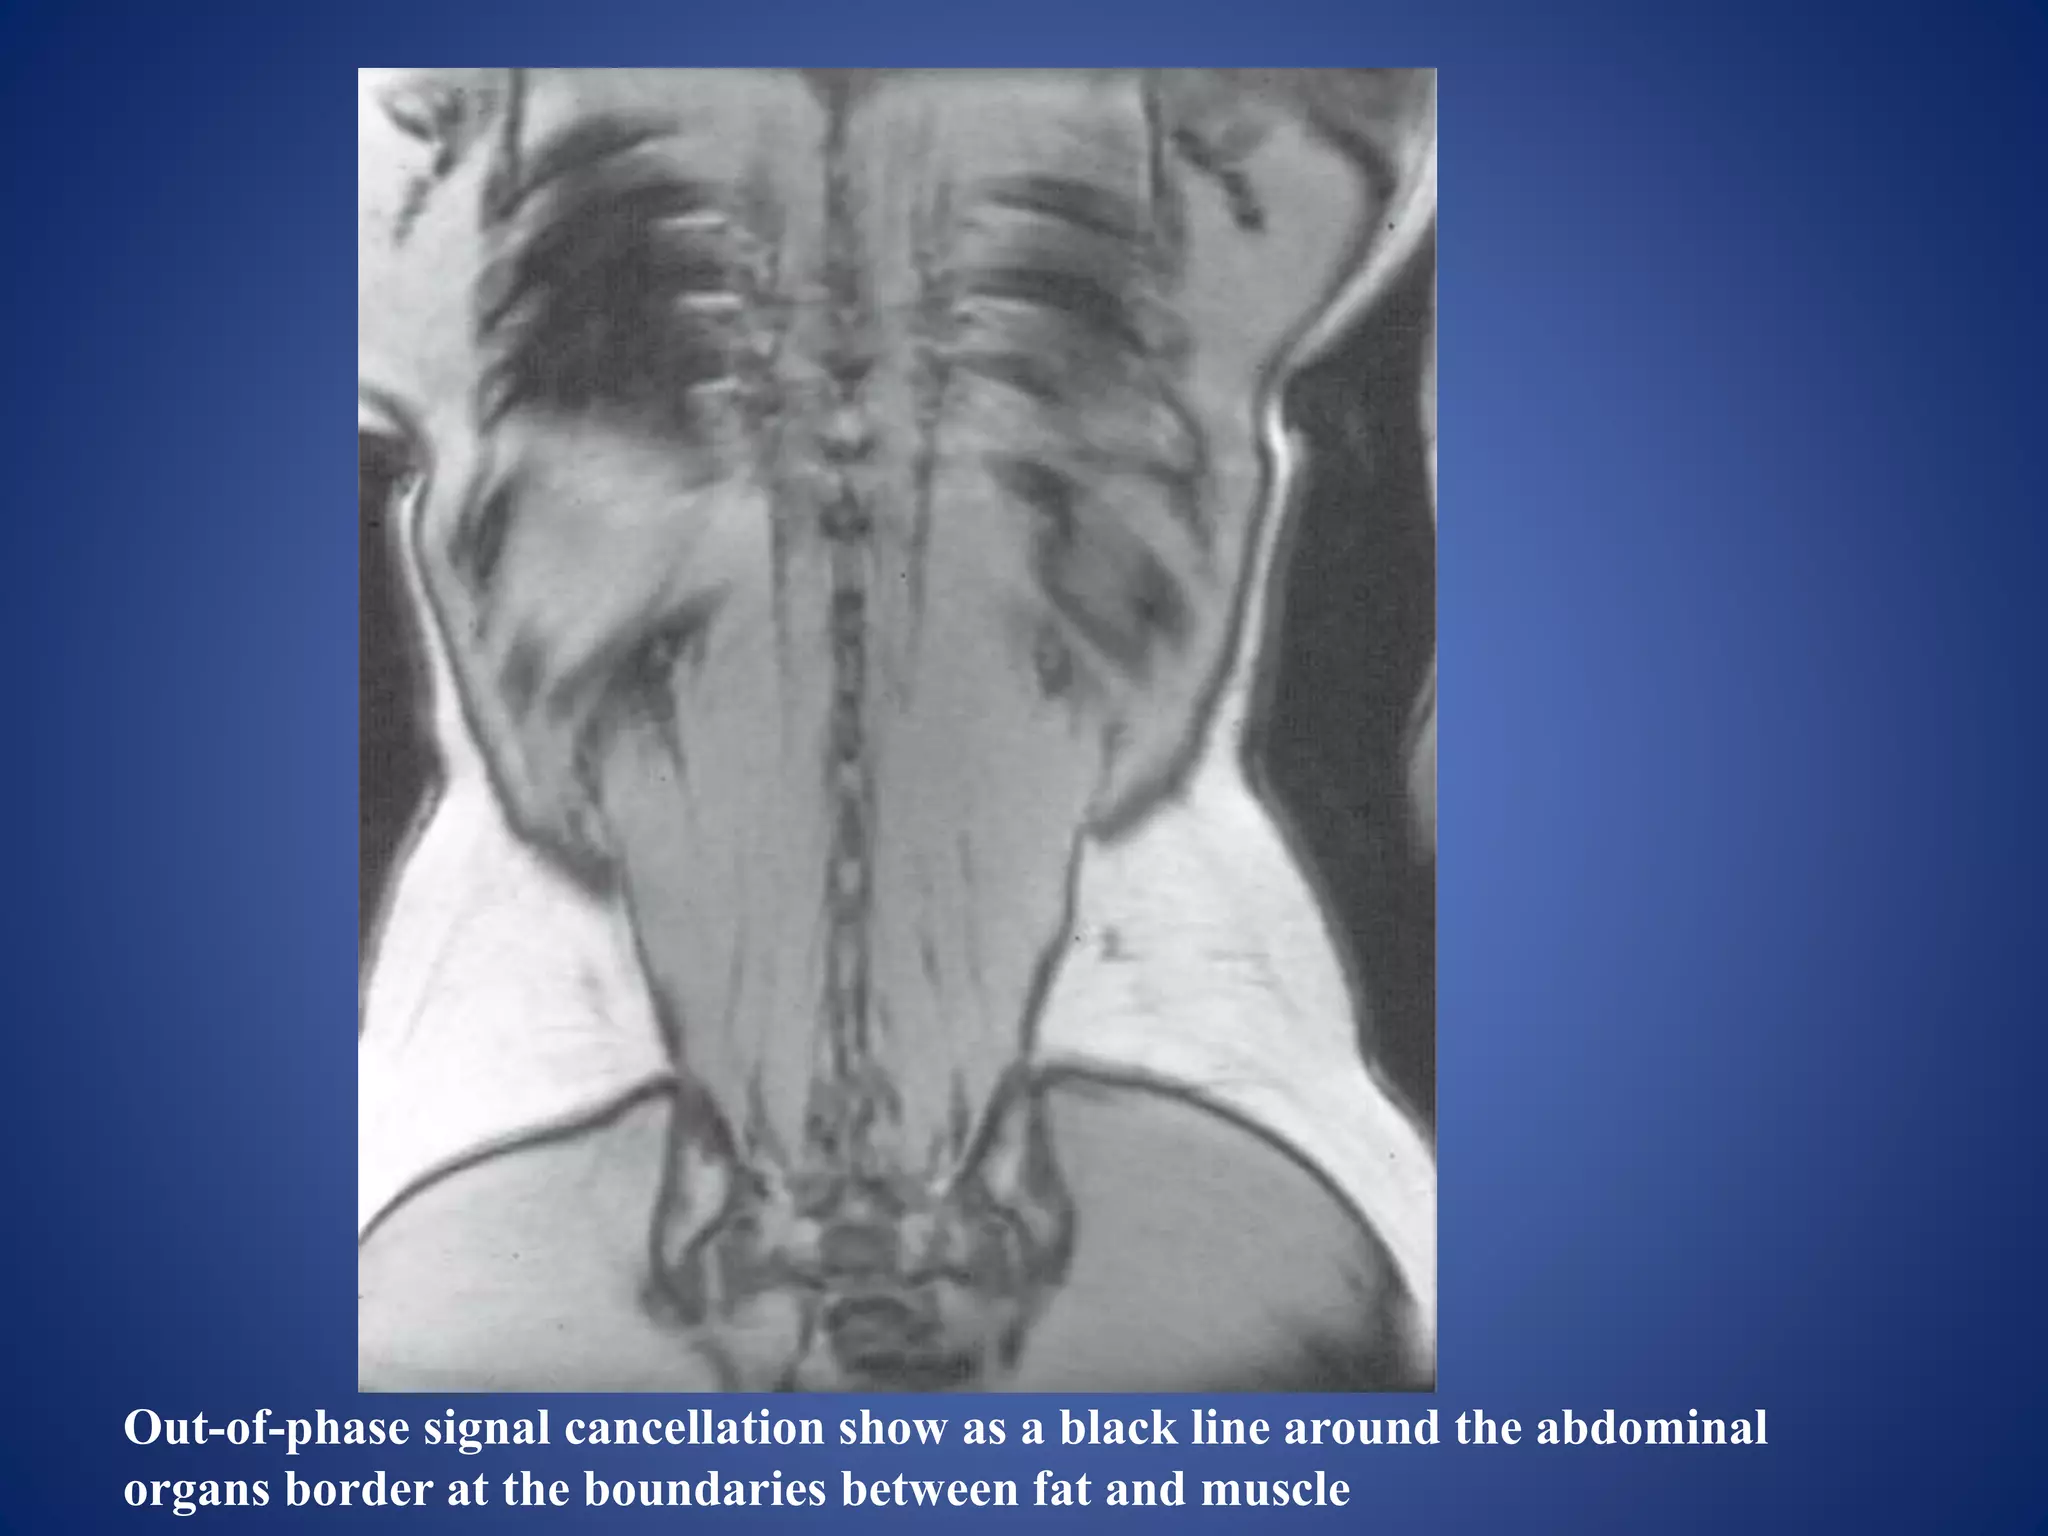
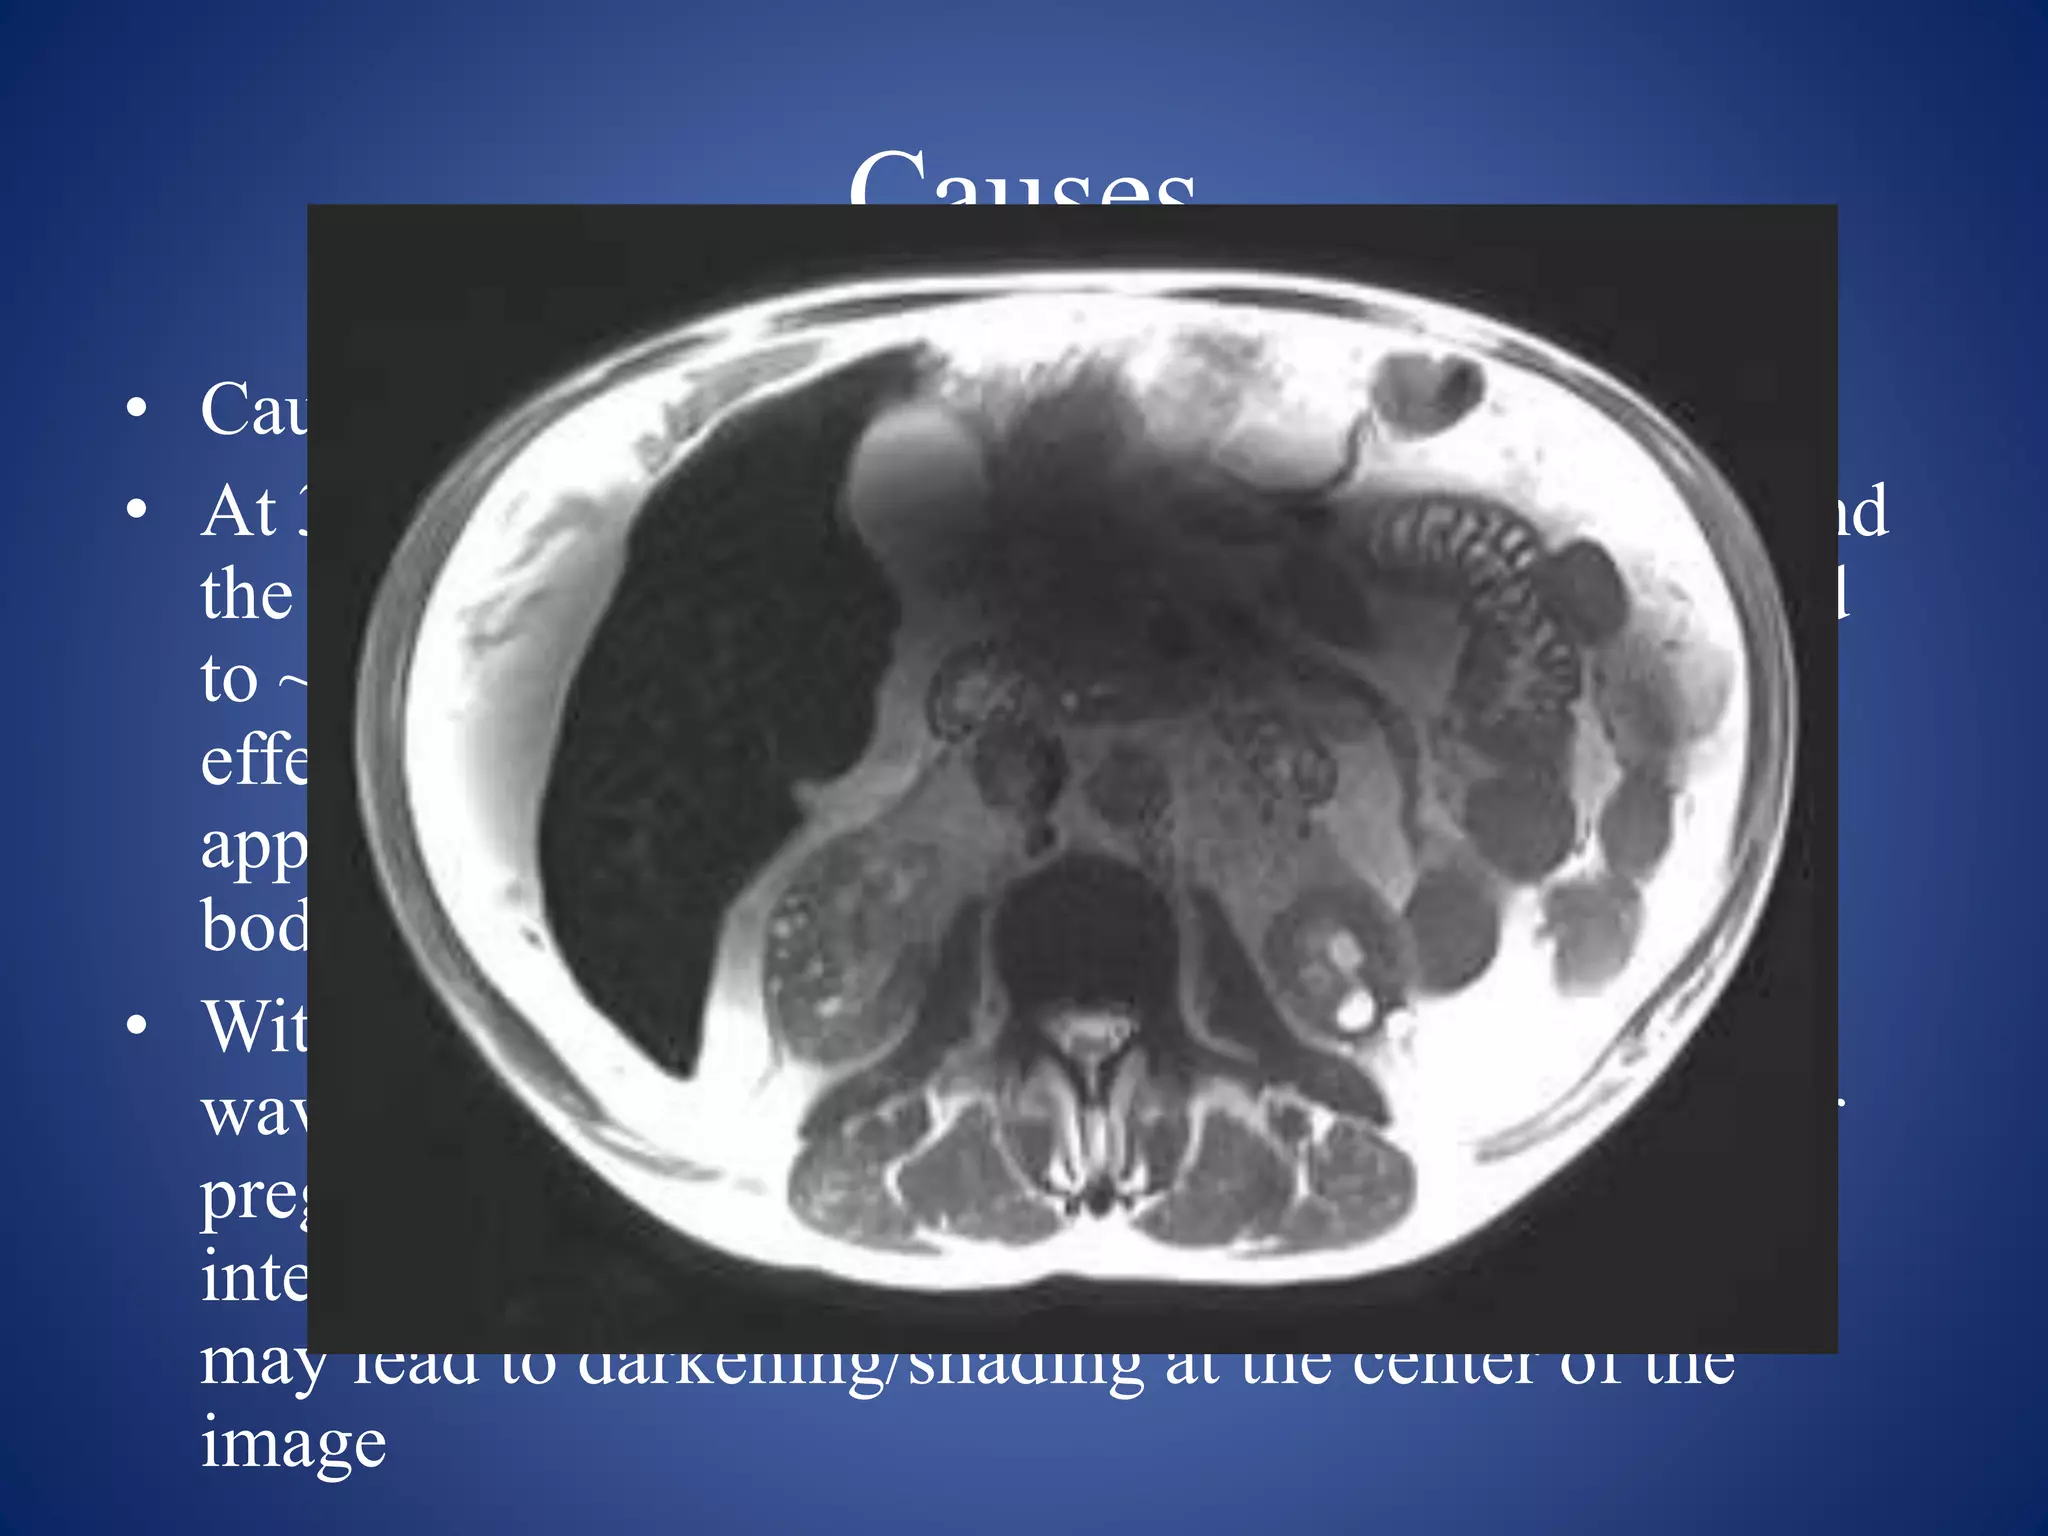
Night 7k to 12k Navi Mumbai Call Girl Photo 👉 BOOK NOW 9833363713 👈 ♀️ night ...
Artifacts
1. MRI Artifacts and Its
Remedies
Soni Nagarkoti
B.Sc.MIT 3rd year
NAMS Bir Hospital
2. Overview
• Introduction to artifacts
• Classification of artifacts
• Cause of the artifacts
• Appearance of the artifacts
• Remedies of the artifacts
3. What is artifact?
• Artifacts defined as either any signal or void in
the images that does not have an anatomic
basis, or as the result of distortion, addition or
deletion of information.
4. Significances of artifact
• Some artifacts degrade the images and may mask
or even mimic pathology
• Some artifacts are beneficial and we deliberately
create them to demonstrate flow, lesion
characterization and pathology visualization
• Some artifacts are irreversible and are reduced
rather than removed
• As artifacts characterization and identification is
essential, we need to understand them and how to
compensate them
5. Classification of the artifacts
• Hardware related artifacts
• Software related artifacts
• Artifacts due to physiologic motion
• Artifacts due to tissue heterogeneity and
foreign body
• Artifacts due to fourier transform and nyquist
theorem
6. Hardware based
1. Zipper artifact
2. Shading artifact
3. Moire artifact
4. Zebra artifact
5. Central point artifact
6. Equipment faults
Software based
1. Truncation artifact
2. Cross excitation/ cross talk
artifact
3. Aliasing artifacts
7. Motion based
1. Entry slice phenomenon/ in
flow artifact
2. Phase mismapping
Tissue inhomogeneity
based
1. Chemical shift artifacts
2. Susceptibility artifacts
3. Magic angle artifacts
4. Out of phase cancellation
artifact
5. Dielectric artifacts
10. 1. Zipper artifact
• Appearance: appears as a dense broken line across
the image perpendicular to the frequency
encoding direction
• cause:
1. extraneous RF entering the room at a frequency
that matches the frequencies expected in the
echo
2. Faulty scan room doors
3. Breach in the RF cage
11. (The frequency of the interference tends to be of a
much higher amplitude compared to the spin-echo
and therefore appears in the image as a high-
intensity line representing that particular frequency
after FFT)
• Remedy:
1. Scan door should be closed
2. Engineers should locate breach in RF and repair
them
3. Equipments within scan room should be serviced
12. 2.Moire artifacts
• Appearance: appears as a strange looking wavy pattern such
that in
• the fabrics
• Causes:
1.Multiple noise spike
In SE sequences, the noise from the static electric discharge in the scan
room causes spikes in data in the k space. After FFT, these spikes are
reconstructed as parallel lines. If these two spikes occur during same
acquisition, two sets of parallel lines will be reconstructed that interfere
the image and forms a woven pattern in image.
2.Field inhomogenity
This effect is seen in GRE by the combination of aliasing and field
inhomogeneity. aliasing causes anatomy outside FOV produce signals
and field inhomogeneity causes the superimposed signals to be in phase
out phase with the voxels on which it is wrapped. This gives spiky
appearance in the edge of image.
13.
14. • Remedies:
1. Use of spin echo sequences
2. Use of anti aliasing remedies
3. Humidity in room should be in normal limits
4. Plug on the receive coil should be firmly sited
in the socket
15. 3.Shading artifacts
• Appearance:
Appears as a difference in the signal intrnsity across the
imaging volume
• Causes :
Uneven excitation of the nuclei within the patientd due
to the RF applied at flip angle less than 90° and 180°
Abnormal loading of the coil or coupling the coil at one
point
Patient anatomy touching at one side of the body coil
and coupling at that point
Overflow of ADC
16. Remedies
• Loading the coil correctly
• using the proper size coil for patient size and the
examined part
• preventing the patient touching the coil (you can
use foam pads between patient and coil)
• shimming to reduce inhomogeneity of the
magnetic field
• using the proper scanning parameters to set proper
amplitude of applied RF pulses (less amplification
to avoid analog to digital converter over flow)
17. 4.Zebra artifact
• Appearance: appears as the black and white
stripes of zebra on the image obliquely
• Causes:
Data is missing in k space array or set to zero
during scanning
Abrupt change in signal from signal to no
signal
18. Remedies
• Using SE pulse sequences
• Expanding the FOV
• Using oversampling techniques to prevent
aliasing
• Using surface coils
19. 5.Central point artifact
• Appearance: appears as a focal dot of increased or
decreased signal in the exact centre of the image
often with a surrounding ringing artifact
• This artifact was originally misinterpreted as a
multiple sclerosis plaque or a lacunar infarction
• Causes:
Constant offset of DC voltage in the receiver.
After FFT, the constant offset gives the bright dot
at the centre of image
20. Remedies
• Scanners have compensation software to avoid this
problem (DC Correction, Baseline Correction
• doubling the acquisition time.
• In case of failure, technical assistance is required.
• Repeating the sequence
• Maintaining constant temperature in scanner
• Software to estimate DC offset and adjust the data in K-
space
• Recalibration of the receiver and software correction
21. 6.Equipment faults
• The loss of a gradient, for example, causes
image distortion, and eddy currents induced in
the gradient coils can cause phase artifacts as
they create additional unwanted phase shifts.
• data-acquisition errors cause a variety of
different artifacts, most of which are
characterized by a geometric appearance in the
image,such as well-defined bands of missing
signal. These
23. 1.Truncation artifact
• Appearance: appears as a banding artifact at the
interface of high and low signals. It creates the low
intensity band running through high intensity areas.
• Causes:
• results from undersampling of data (too few k-space
lines are filled) so that interfaces of high and low signal
are incorrectly represented on the image.
• is most common when tissue is still producing a high
signal at the end of data collection or when the peak of
the echo is not centered in the middle of the sampling
window.
24. Remedy
• Undersampling of data should be avoided.
• Phase matrix should be increased. For example,
use a 512 × 512 matrix instead of 512 × 128.
• Techniques that partially fill k spaces should be
avoided
• Fat suppression techniques used in T1-weighted
imaging might reduce this artifact by nulling high
signal from fat at the beginning and end of the
sampling window.
• filters can be used that force the signal amplitude
to zero at the end of the sampling window
25. 2.Cross excitation artifact
• Appearance:
This artifact causes a reduction in SNR in adjacent slices
in the slice stack
• Causes :
• Ideally, the profile of a slice should be square, or rather
rectangular, when viewed from the edge but in practice,
an RF excitation pulse is not able to achieve this.
• The adjacent slices receive energy from the RF
excitation pulse of their neighbors where the overlap
occurs .
• This energy pushes the magnetic moments of nuclei
toward the transverse plane, so that they may become
saturated when they are excited by their intended RF
pulse. This effect is called cross-excitation, and the
resulting saturation reduces SNR.
26.
27. Remedy
• Cross-excitation can be reduced by ensuring
that there is at least a 30% gap between the
slices.
• This is 30% of the slice thickness itself and
reduces the likelihood of RF exciting adjacent
slices.
28. 3.Aliasing artifact
• Appearance: appears as the wrap where anatomy hat
exist outside the FOV is folded onto the top of anatomy
inside FOV
• Causes:
Anatomy outside the FOV still experiences the effects
of the gradients and produces a signal if it is within the
receiving volume of the receiver coil.
The signal from this anatomy has frequencies that are
higher or lower than those within the FOV because
nuclei are positioned on parts of the gradient that
extend beyond the FOV.
If the frequency exceeds the Nyquist frequency, it is not
accurately digitized and is represented as a lower
frequency
29. Types of aliasing
1. Frequency wrap
• When the FOV is smaller than the anatomy in the
frequency direction of the image, frequencies
outside the FOV are higher than the Nyquist
frequency and are mapped to a lower frequency.
This is called highfrequency aliasing
2.Phase wrap
• Aliasing along the phase axis of the image is
known as phase wrap. This is caused by
undersampling of data along the phase axis of the
image.
30. Remedy
• enlarging the FOV to incorporate all signal-
producing anatomy.
• use presaturation bands on areas outside the FOV
that may wrap into the image. These can
sometimes null signal from these areas and reduce
aliasing.
• two antialiasing software methods that
compensate for wrap i.e. antialiasing along
frequency axis and antialiasing along phase axis
32. 1.Phase mismapping/ghosting
• Appearance:
Produces replication of moving anatomy across the image
in the phase encoding axis.
• Causes:
Is produced by anatomy moving along the phase
encoding gradient like anterior abdominal wall during
respiration, eye movement, pulsation of vessels etc
As anatomy moves during the scan, its reconstructed
signal is misplaced in the phase encoding direction as
the gradient amplitude changes.
Repetitive motion results in periodic perturbations of
the data collected in k-space.
After FFT, it is these perturbations that result in
“ghosts” of moving anatomy being mismapped into
incorrect spatial locations across the image
33. Remedy
• Swapping the phase and frequency encoding direction
• placing presaturation pulses over the source
of motion, causes signal from this motion decreases or is
nulled altogether
• Appropriate breath hold techniques should be instructed
to patients
• In longer sequences, respiratory compensation can be
used
• Respiratory gating and triggering and cardiac gating
and triggering should be used
34. Inflow artifacts/ entry slice
phenomenon
• Entry slice phenomenon is related to the excitation history
of the nuclei.
• Nuclei that receive repeated RF pulses during the
acquisition are said to be saturated or ‘beaten down’.
• The NMV of these nuclei eventually reach an equilibrium
position, and produce a signal according to the TE,TR, flip
angle and contrast characteristics of the tissue.
• Nuclei that have not received repeated RF pulses are said to
be ‘Fresh’ as their NMV has not been beaten down.
• The signal produced by the ‘fresh’ nuclei and the ‘beaten
down’ nuclei are different
• Stationary nuclei within a slice become saturated after
repeated RF pulses.
35. Causes
• Entry slice phenomenon occurs when unsaturated spins in
blood first enter into a slice or slices.
• It is characterised by the bright signal in a blood vessel
(artery or vein) at the first slice that the vessel enters.
• Usually, the signal is seen on more than one slice, fading
with distance.
• This mechanism is used in a positive fashion to generate
flight MR angiograms.
• This artifact has been confused with thrombosis with
disastrous results. The characteristic location and if
necessary, the use of gradient echo flow techniques can be
used to differentiate entry slice artifacts from occlusions.
36. Remedy
• Use of GE techniques are fundamental in the
differentiation between artifact and occlusion.
• Spatial saturation bands place before the first
slice and after the last can be used to eliminate
this artifact
38. 1.Chemical shift artifact
• Appearance:
Chemical shift artifact causes the misplacement of
signal from fat in the image.
It can also create both signal voids and signal
superimposition in areas where fat and water interface
For eg: fluid filled kidney surrounded by the perirenal
fat
The signal loss represents a boundry where signal from
fat is shifted by certain number of voxels leaving
devoid of signal as a result area on opposite side of
kidney is seen hyperintense
39.
40. Cause of chemical shift artifact
• The difference in the precessional frequencies between
magnetic moments in fat and water is called chemical shift,
or sometimes fat/water shift.
• The amount of chemical shift is often expressed in arbitrary
units known as parts per million (ppm) of the main
magnetic field strength which value is abt 3.5ppm
• Is caused by different chemical environment between fat
and water
• The self shielding nature of the fat molecule causes
lowering of the larmor frequency of the magnetic moment
of hydrogen nuclei in fat due to this fat and water are placed
in different pixels and they differ in the receive bandwidth
as well as a result they are sampled differently and
displayed independently across FOV
41. Remedy
• Scanning at lower field strength
• Minimizing FOV
• Use of wider bandwidth
• Use of fat supression techniques
• Higher readout gradients
42. Magnetic suceptibility artifacts
• Apperance: it produces distortion of image together
with larger signal voids
• Causes:
the main causes of this artifact are metals within the
imaging volume,
it can also be seen from naturally occurring
hemorrhage or iron deposition, as they magnetize to a
much greater degree than the surrounding tissue
is more prominent in gradient-echo sequences, as the
gradient reversal cannot compensate for the phase
difference at the interface
43. Remedy
• Removal of all metal objects
• Use of spin echo sequences rather than gradient echo
sequence
• Decrease in the TE
• Use of the wide receive bandwidth when scanning
metal implant
Note
Under some circumstances, it aids in diagnosis. Small
hemorrhages are sometimes only seen because they
produce a magnetic susceptibility effect. The use of fruit
juices such as pineapple as negative “contrast agents” in
the bowel also relies on susceptibility-related dephasing.
44. Magic angle artifacts
• Appearance: produces abnormally high signal intensity
in the tissue that contaims collahen such as tendon
Is most common in patellar tendon
• Causes:
Occurs when the collagen structure lie at 55 degree to
the main magnetic field
The anisotropic shape of the molecules in collagen
causes reduction to zero of spin–spin interactions.
The T2 decay time increases in collagen structures
when they lie at this angle to B0.
This causes increased signal intensity in the structure
when a short TE is used
45. Remedy
• The patient’s anatomy can be altered relative
to the B0 field or increase the TE. If the signal
remains hyperintense, it is likely to be fluid
(Alter the angle of the patient’s anatomy.
46. Out phase signal cancellation artifacts
• Appearance: produces a ring of dark signal
around certain organs where fat and water
interfaces occur within the same voxel.
It degrades the image in gradient-echo pulse
sequences because gradient rephasing does not
compensate for this artifact.
• Cause:
• caused by the fact that the magnetic moments of
hydrogen precess at different frequencies, and the
differences in their phase positions are exhibited
by fat and water vectors at discrete points in time.
47. Out-of-phase signal cancellation show as a black line around the abdominal
organs border at the boundaries between fat and muscle
48. Remedy
• Selection of TE that matches the periodicity of fat and water
• Using spin echo sequences rather than gradient echo
sequences
• Using in phase TE
Note
• out-of-phase signal cancellation is clinically very useful.
• Any pathology that contains both fat and water exhibits
reduced signal on an out-of-phase image.
• Adrenal tumors are a good example.
• out-of-phase images provide a method of background
suppression in inflow angiography when examining the
cerebral circulation.
• There are computer algorithms that can manipulate data
from in-phase and out-of-phase images to provide fat-only
and water-only images. This is known as the Dixon
Technique.
49. Dielectric artifacts
• dielectric effect refers to the interaction of
matter with the E component of an
electromagnetic field.
• Appearance: appears as non uniform shading
• Abnormal bright and dark areas due to B1 field
inhomogeneity are frequently noted at very
high fields
50. Causes
• Caused by shortening of the RF
• At 3 T, the RF wavelength measures 234 cm in air, and
the speed and wavelength of the RF field is shortened
to ~26 cm within the body as a result of dielectric
effects. However, this 26 cm field of view is
approximately the cross-sectional diameter of most
body imaging studies.
• With patient abdominal diameters that exceed the RF
wavelength (e.g. patients with cirrhosis and ascites or
pregnant patients), constructive and destructive
interference patterns may emerge. In body MRI this
may lead to darkening/shading at the center of the
image
51. Remedy
• Using of the dielectric pads
• Imaging at lower field strengths
• Draining the ascites before imaging
52.
53. References
• MRI in Practice 5th edison
• www.mriquestion.com
• Radiopaedia.org
• Google.com
When electromagnetic waves encounter the human body, several phenomena occur: 1) the wavelength decreases; 2) electrical currents are generated; and 3) wave reflection/refraction may develop at tissue interfaces.