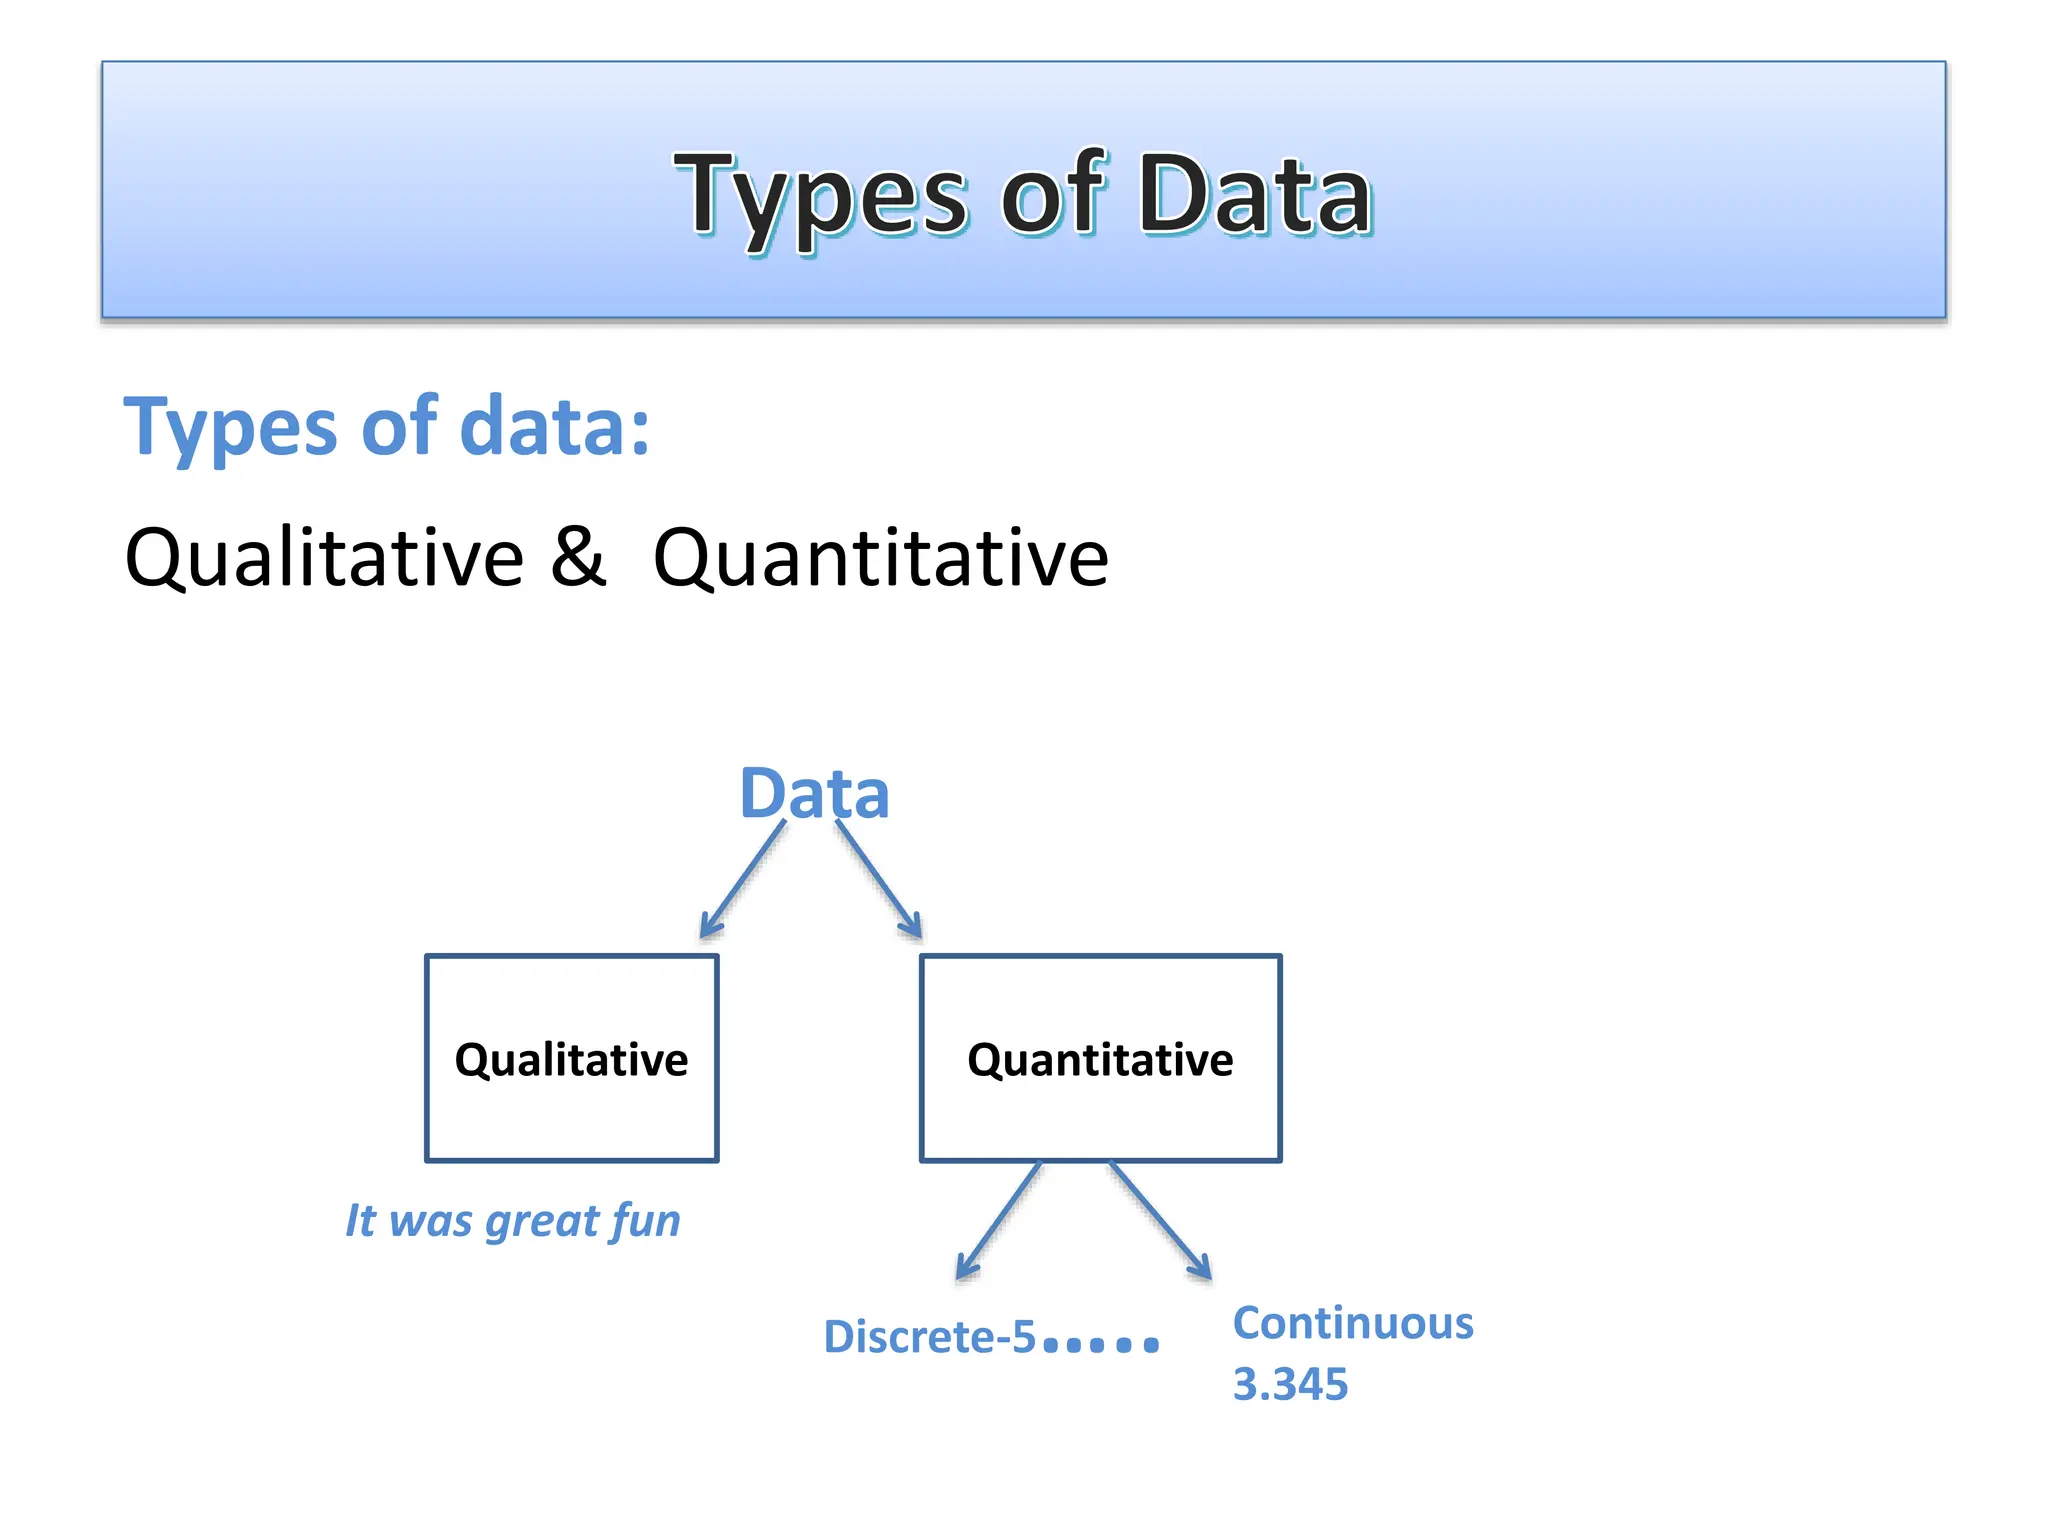
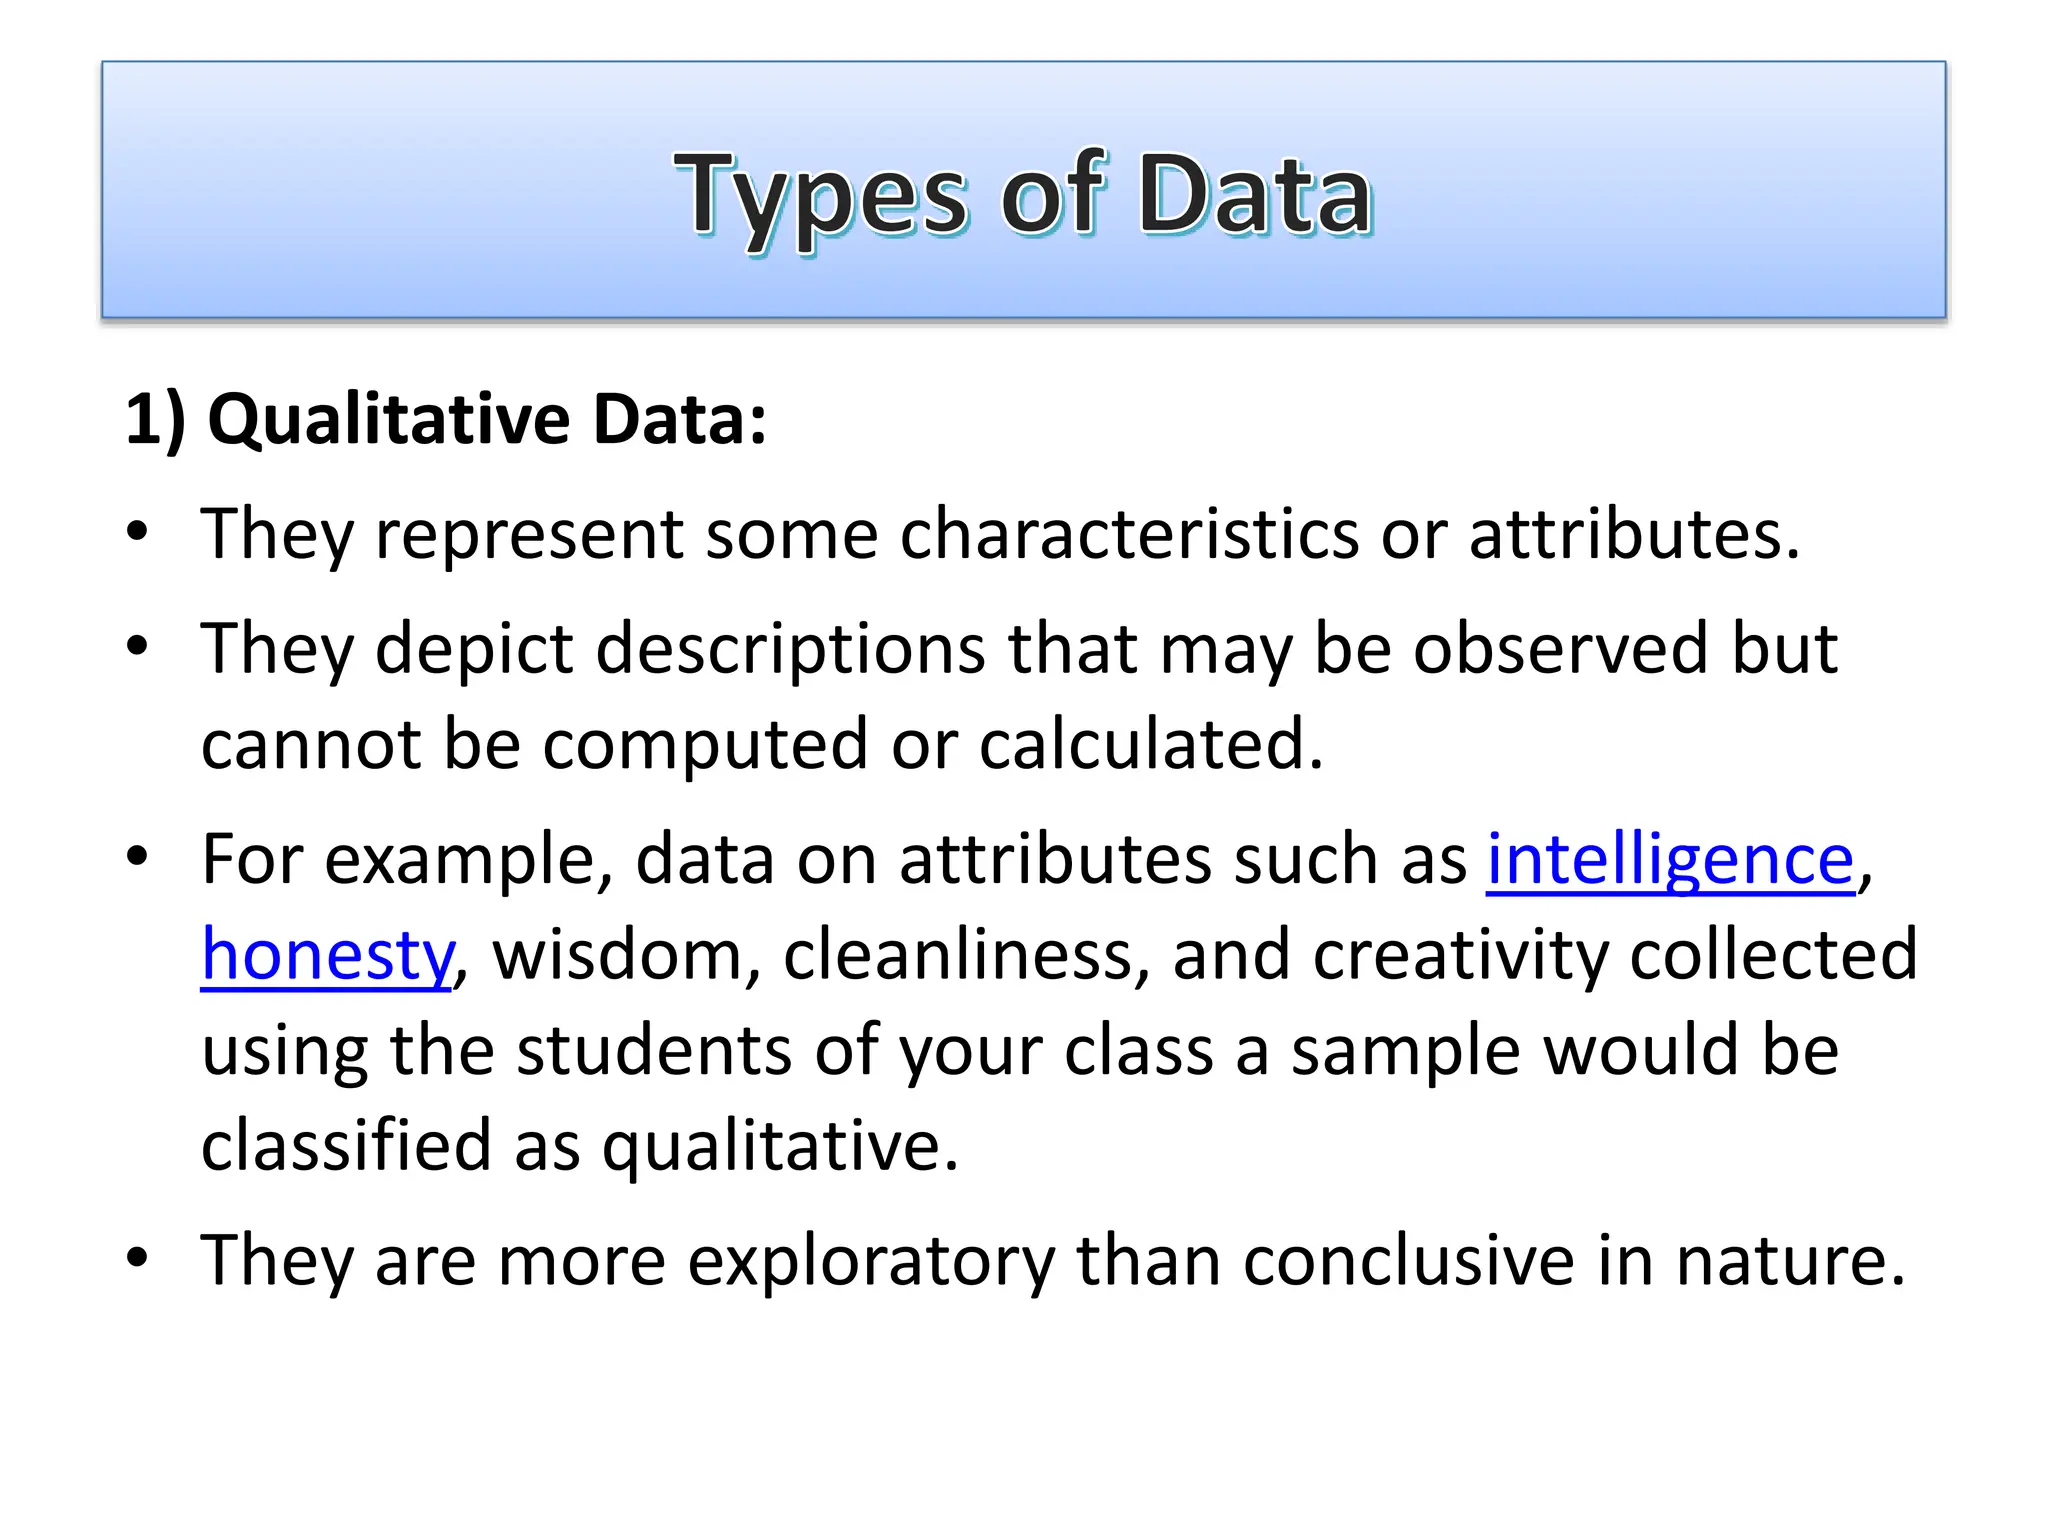
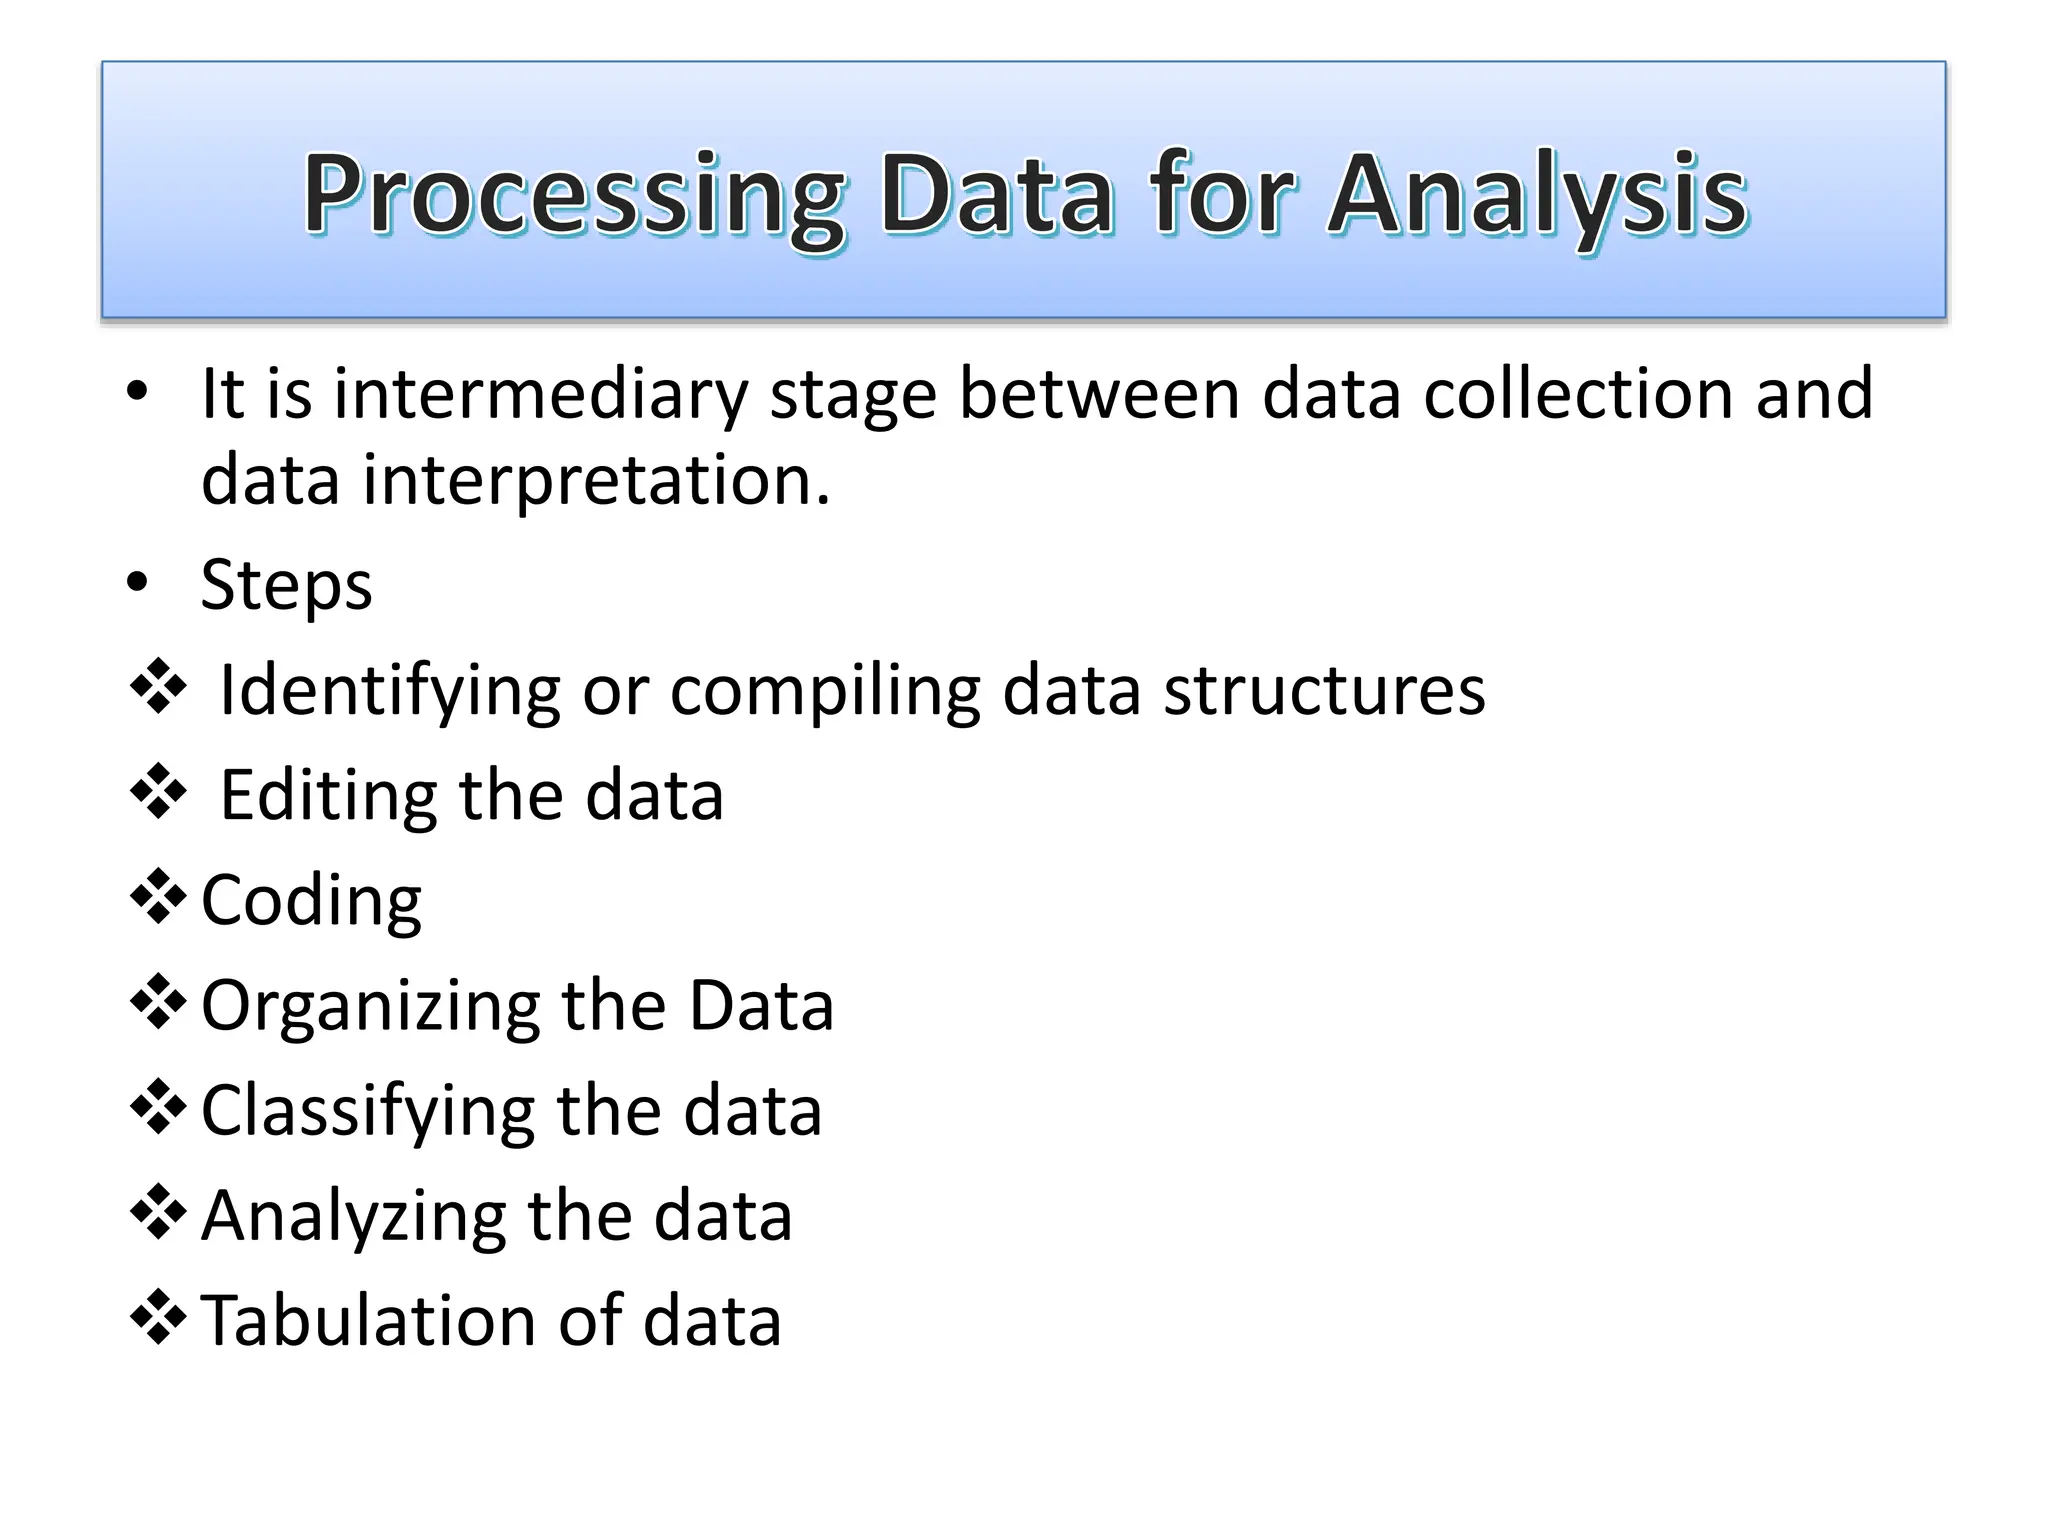
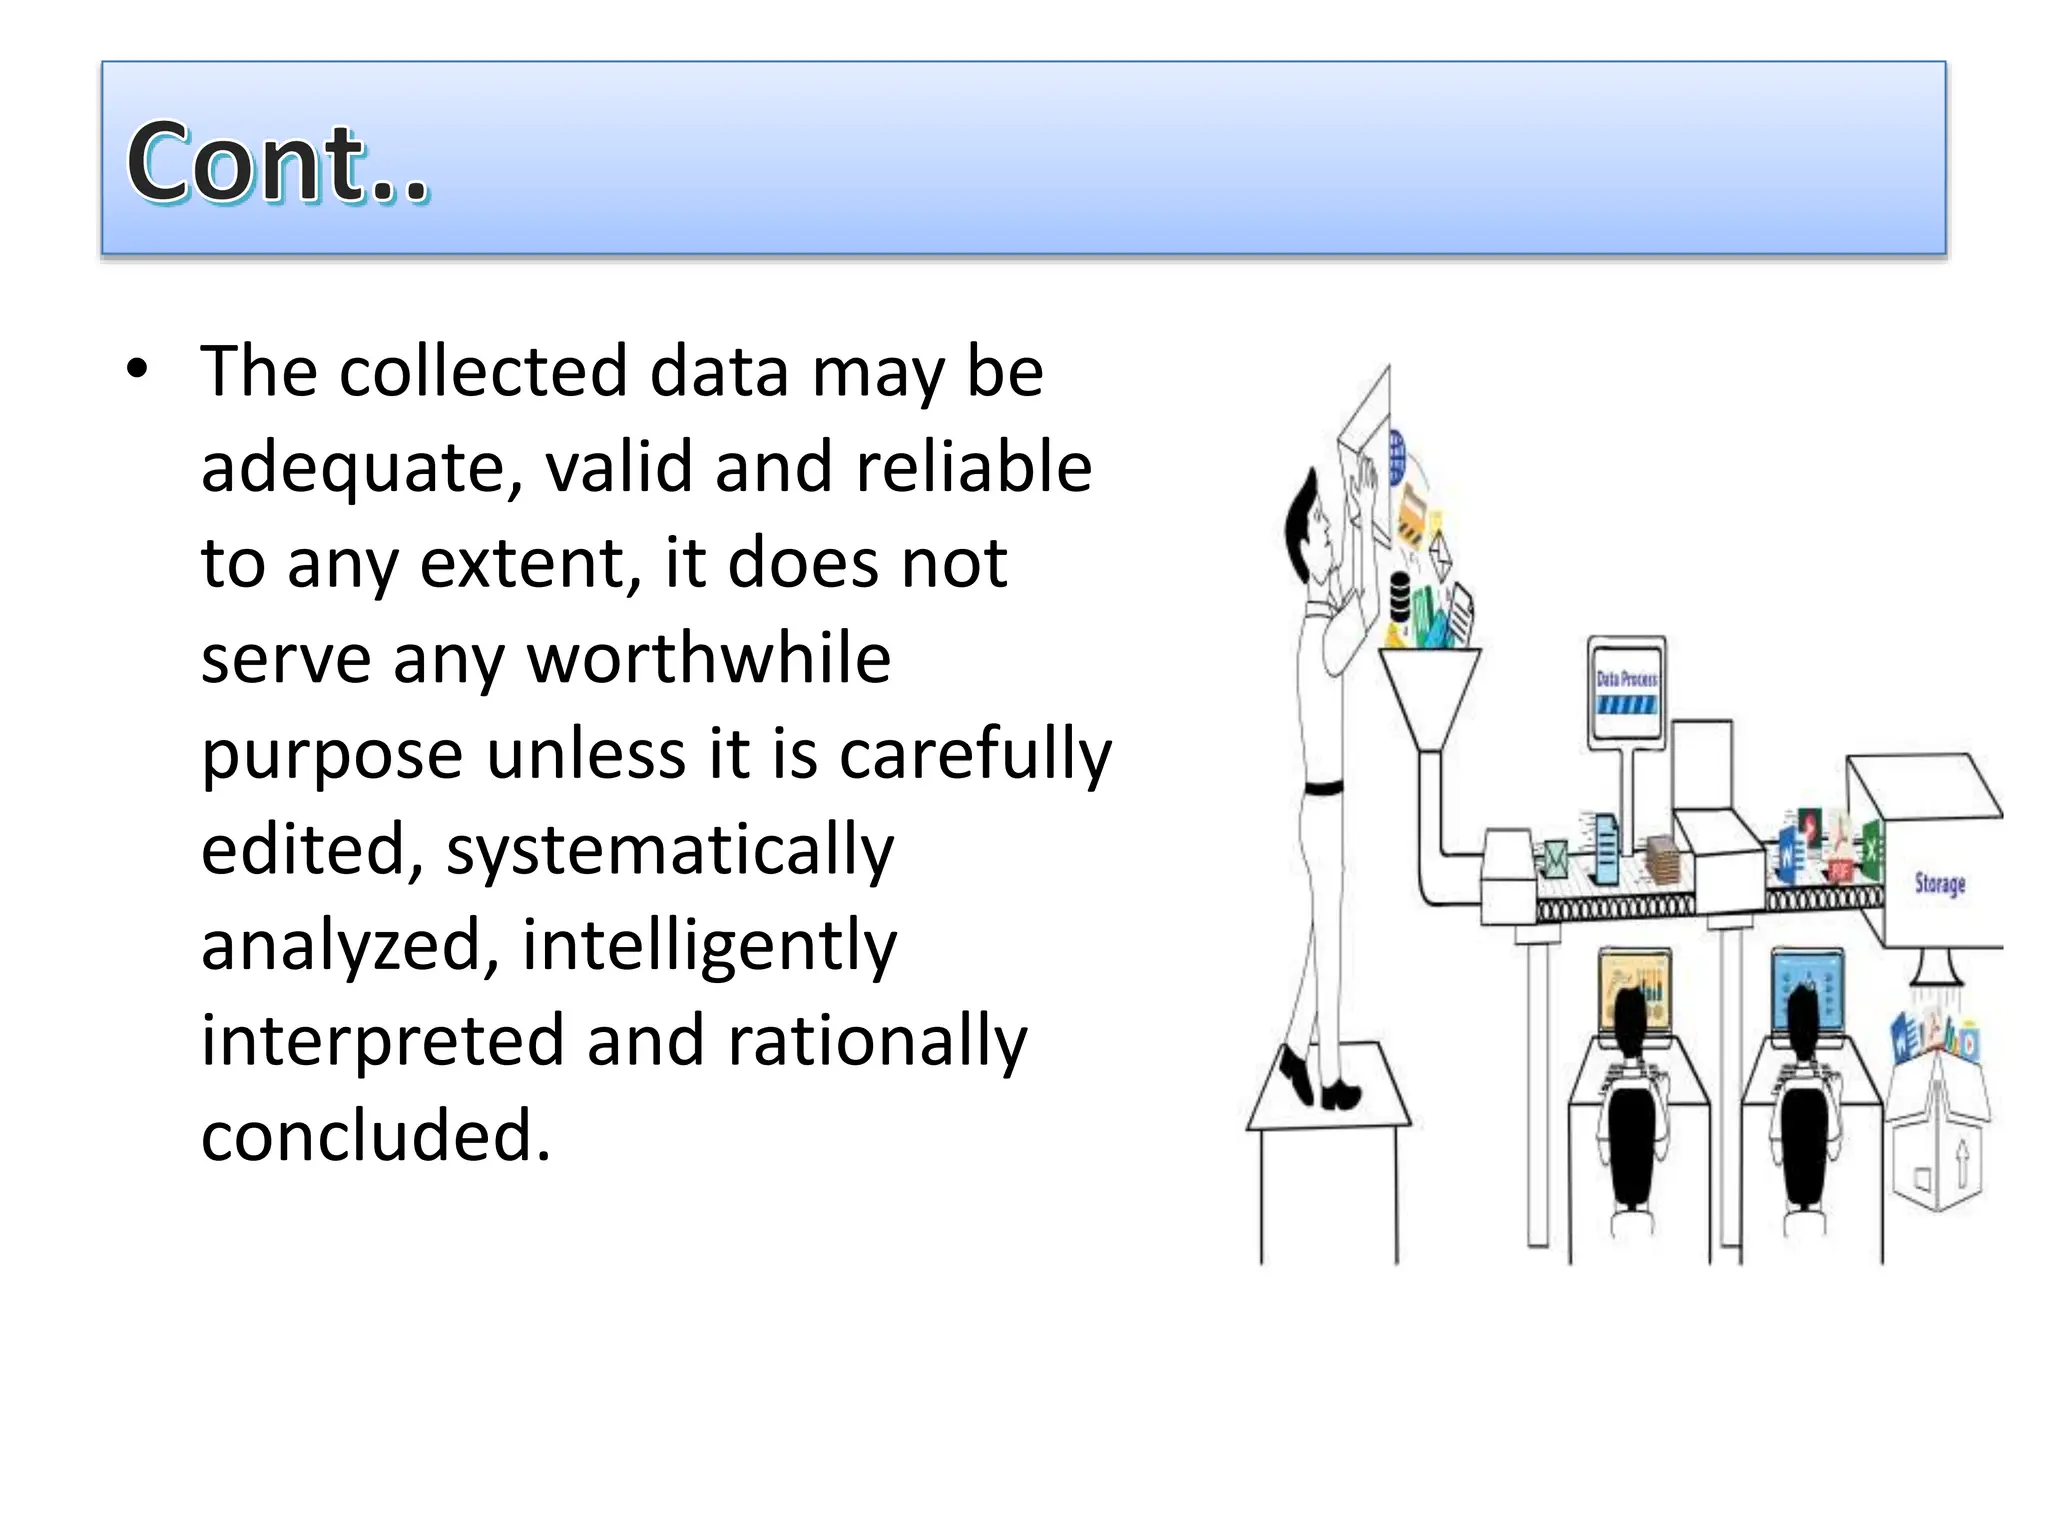
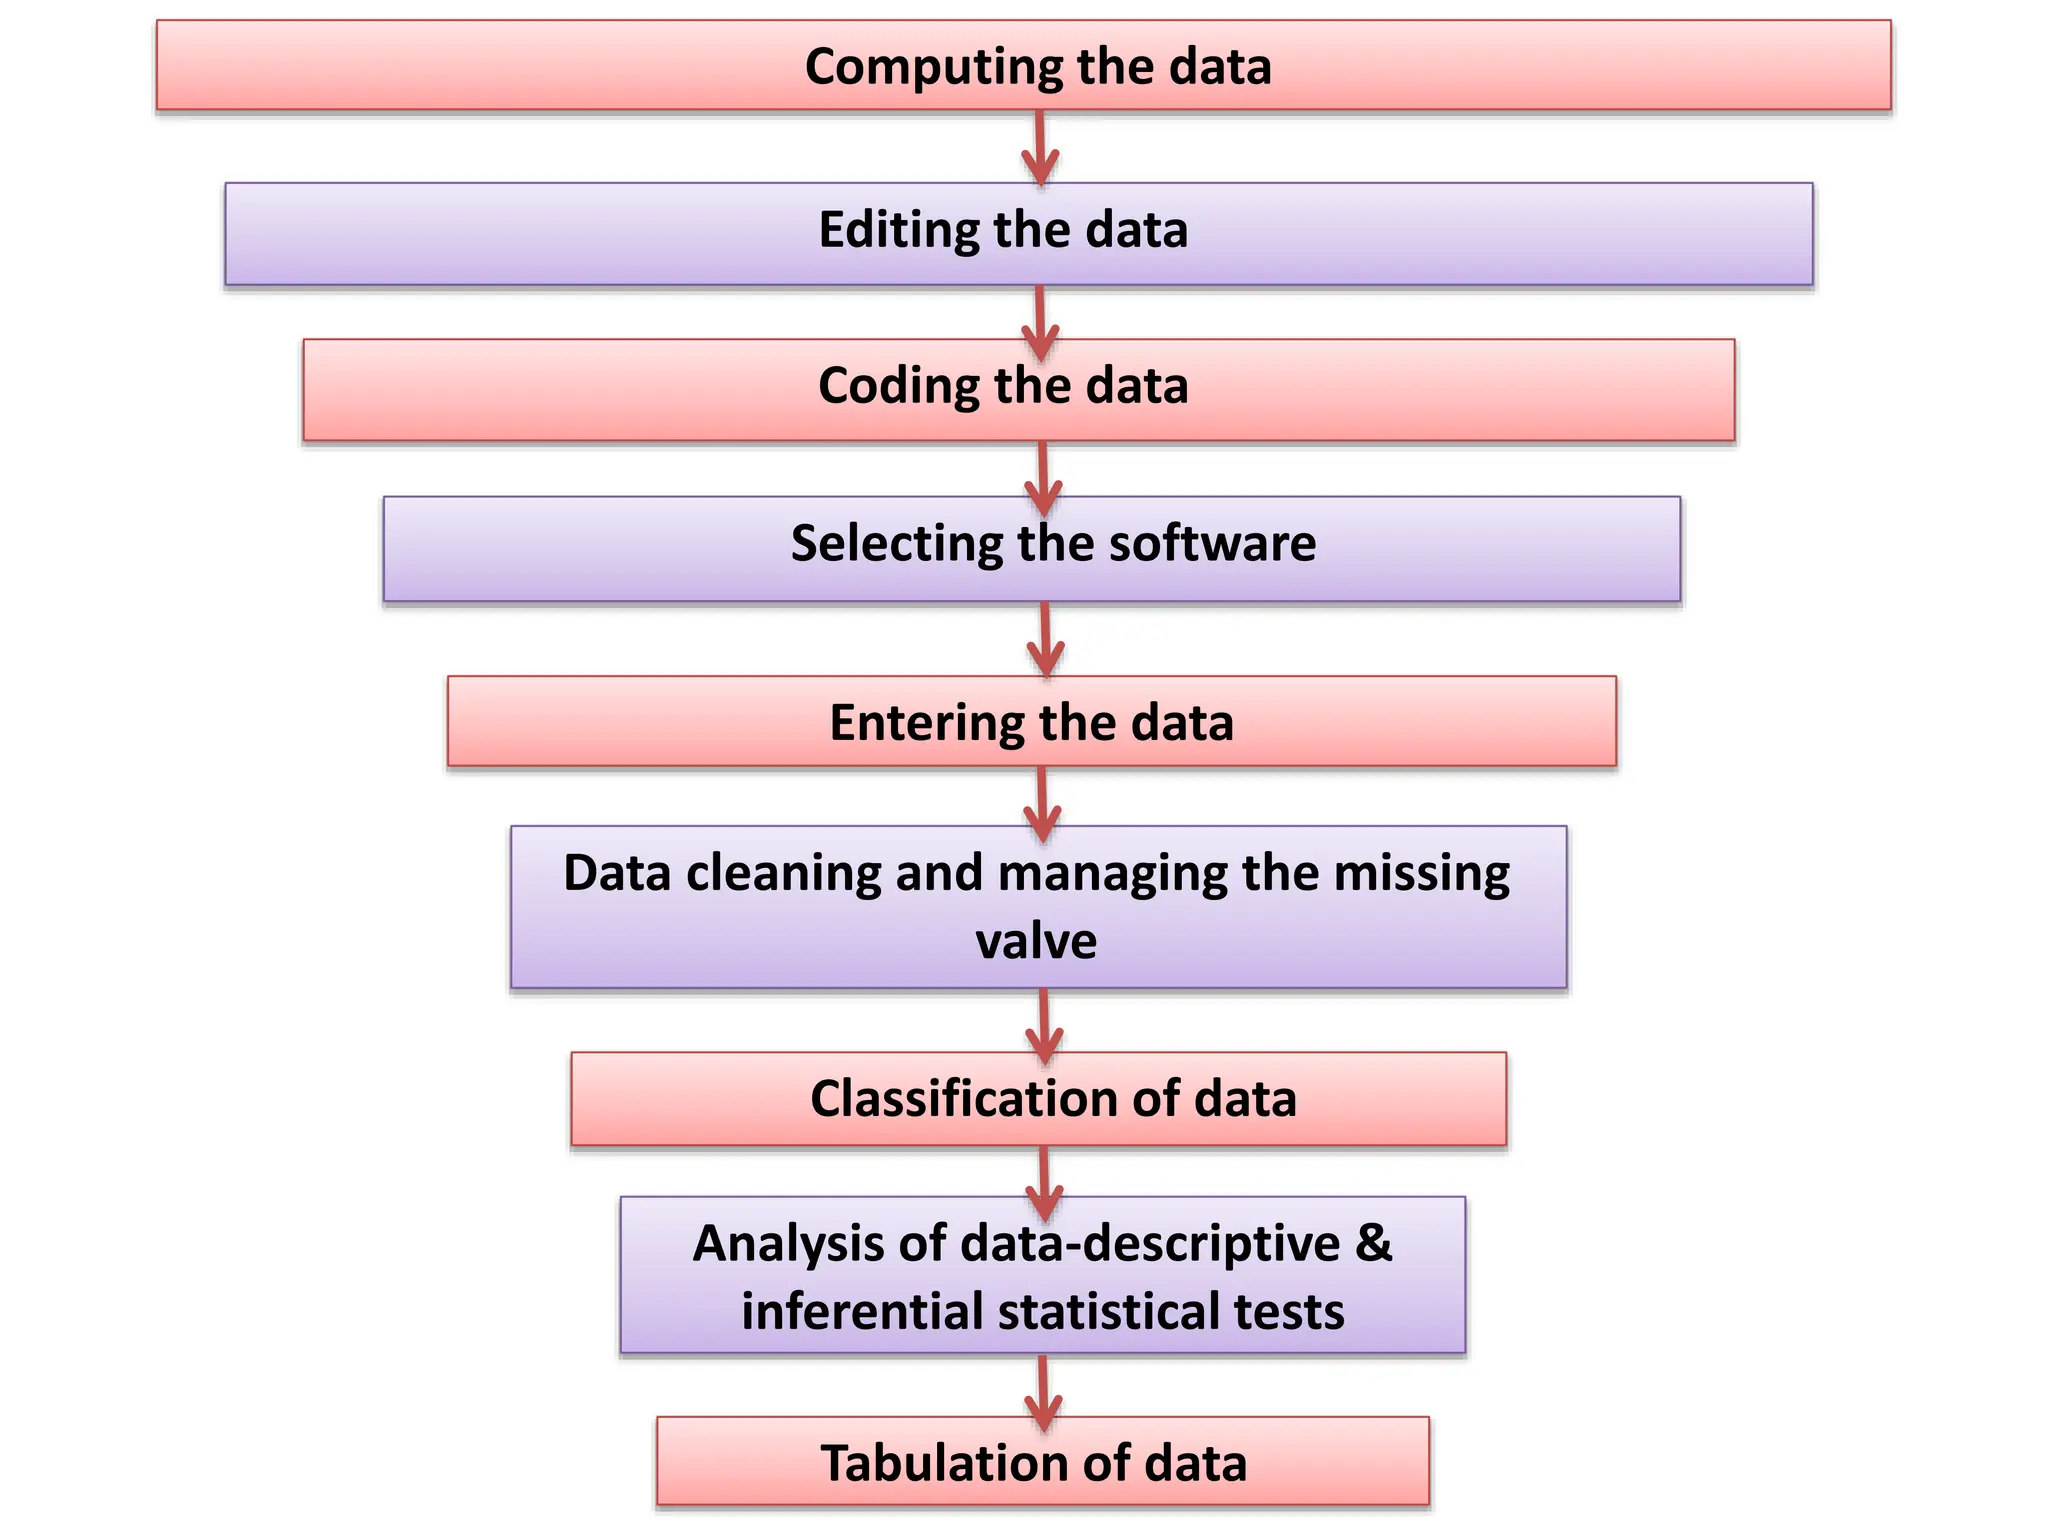
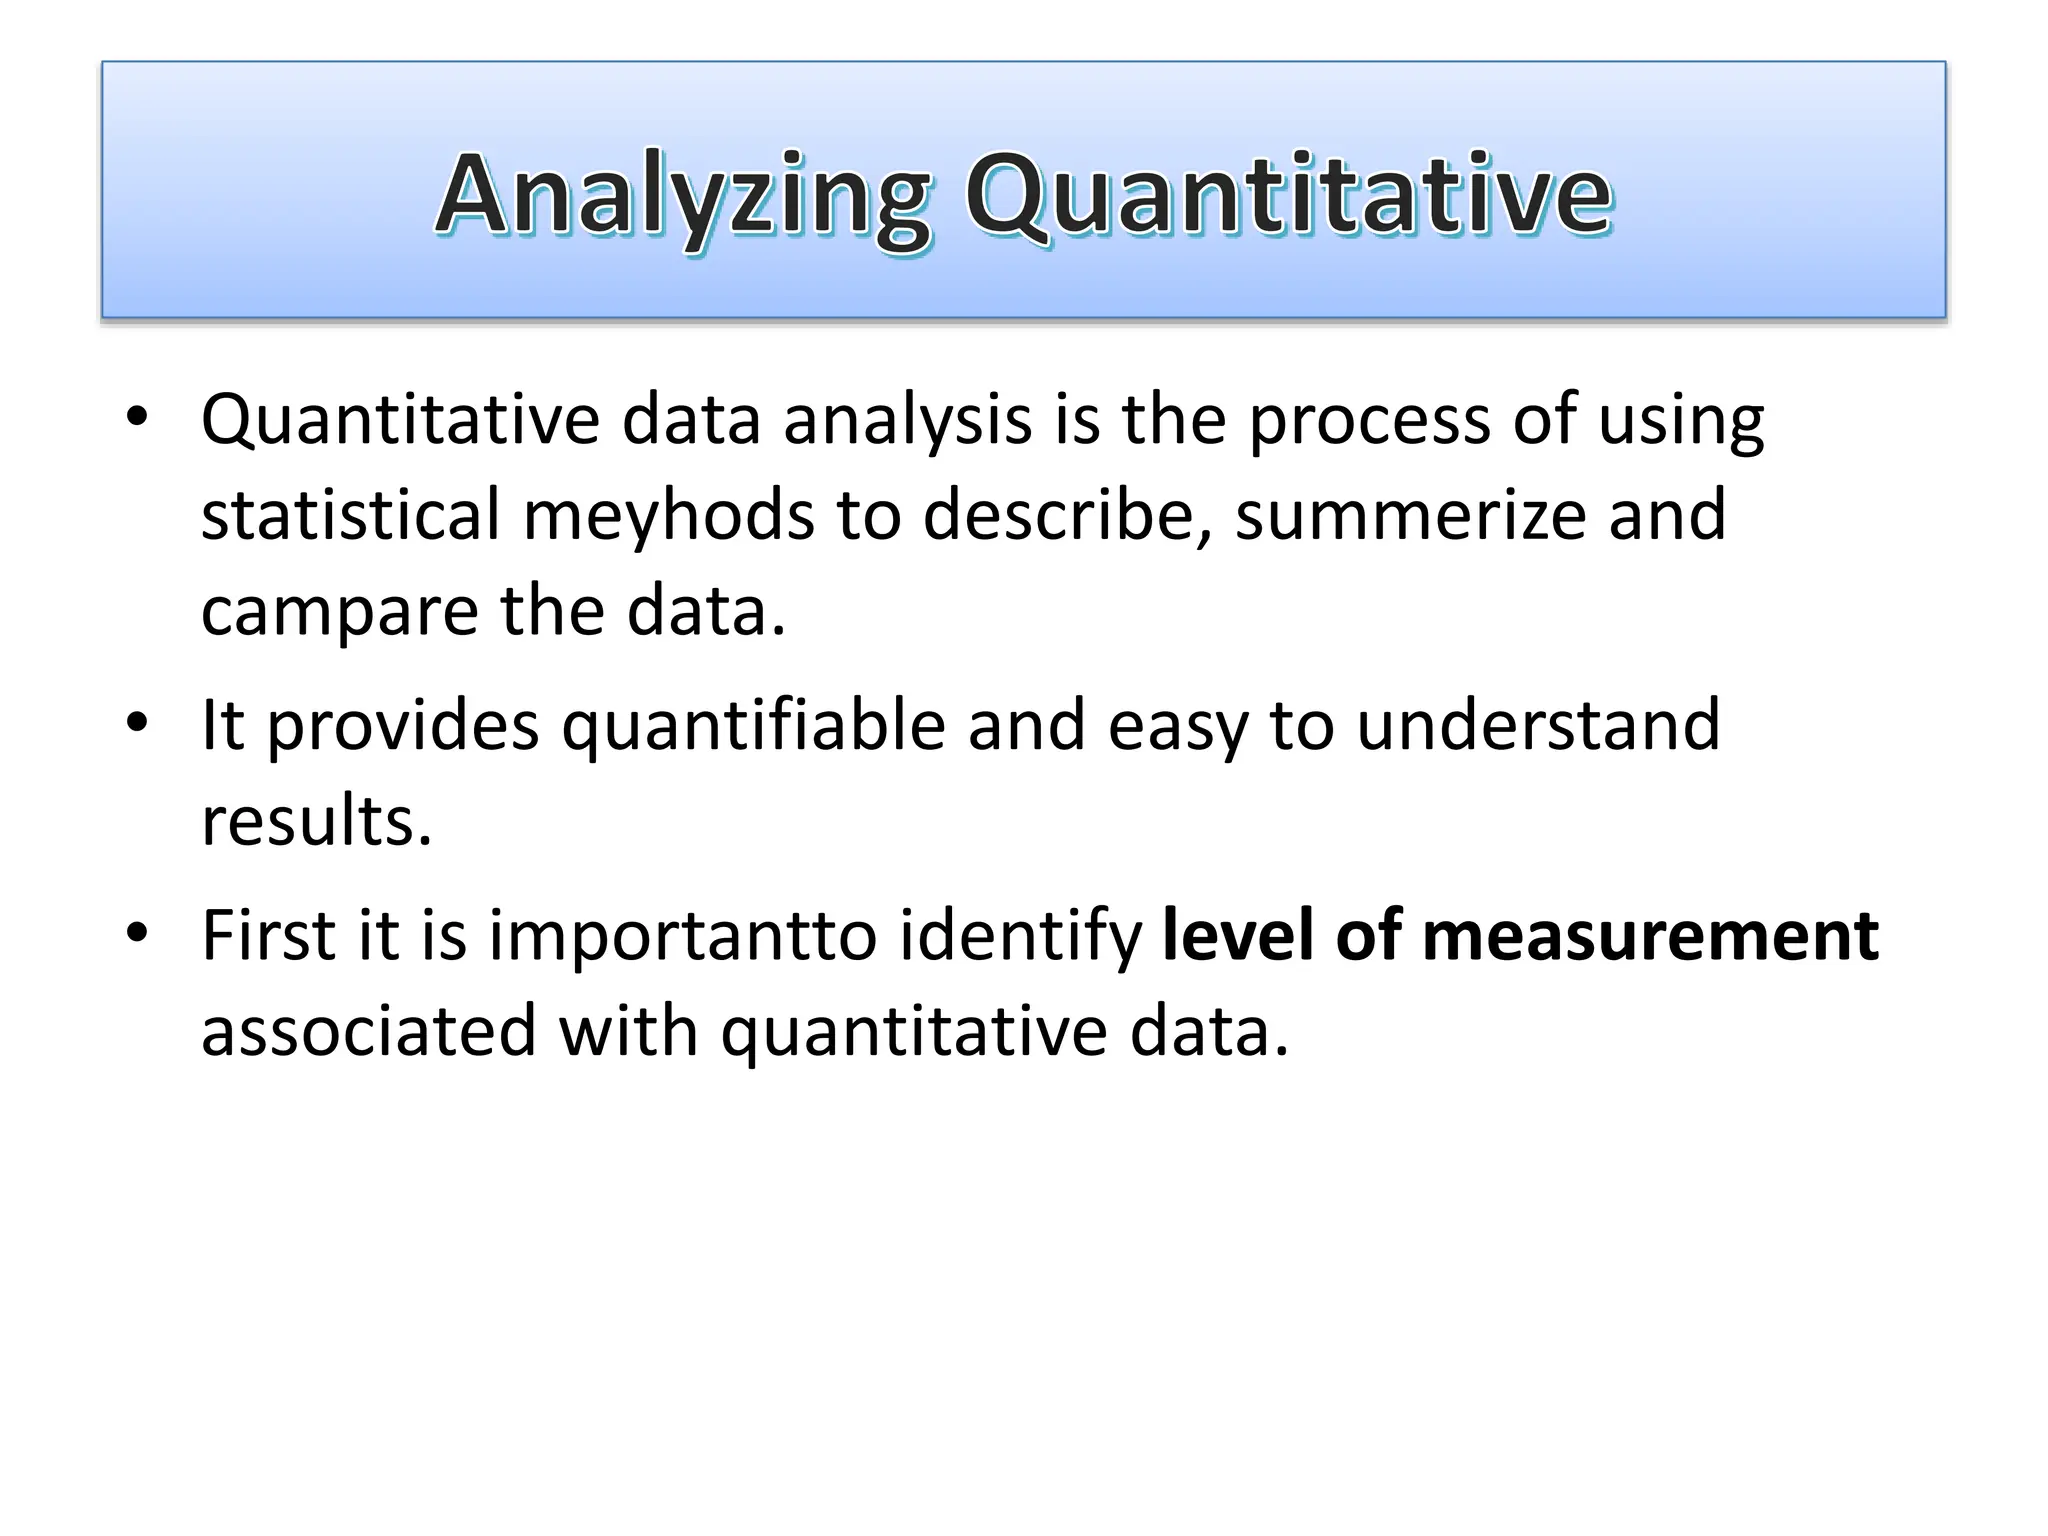
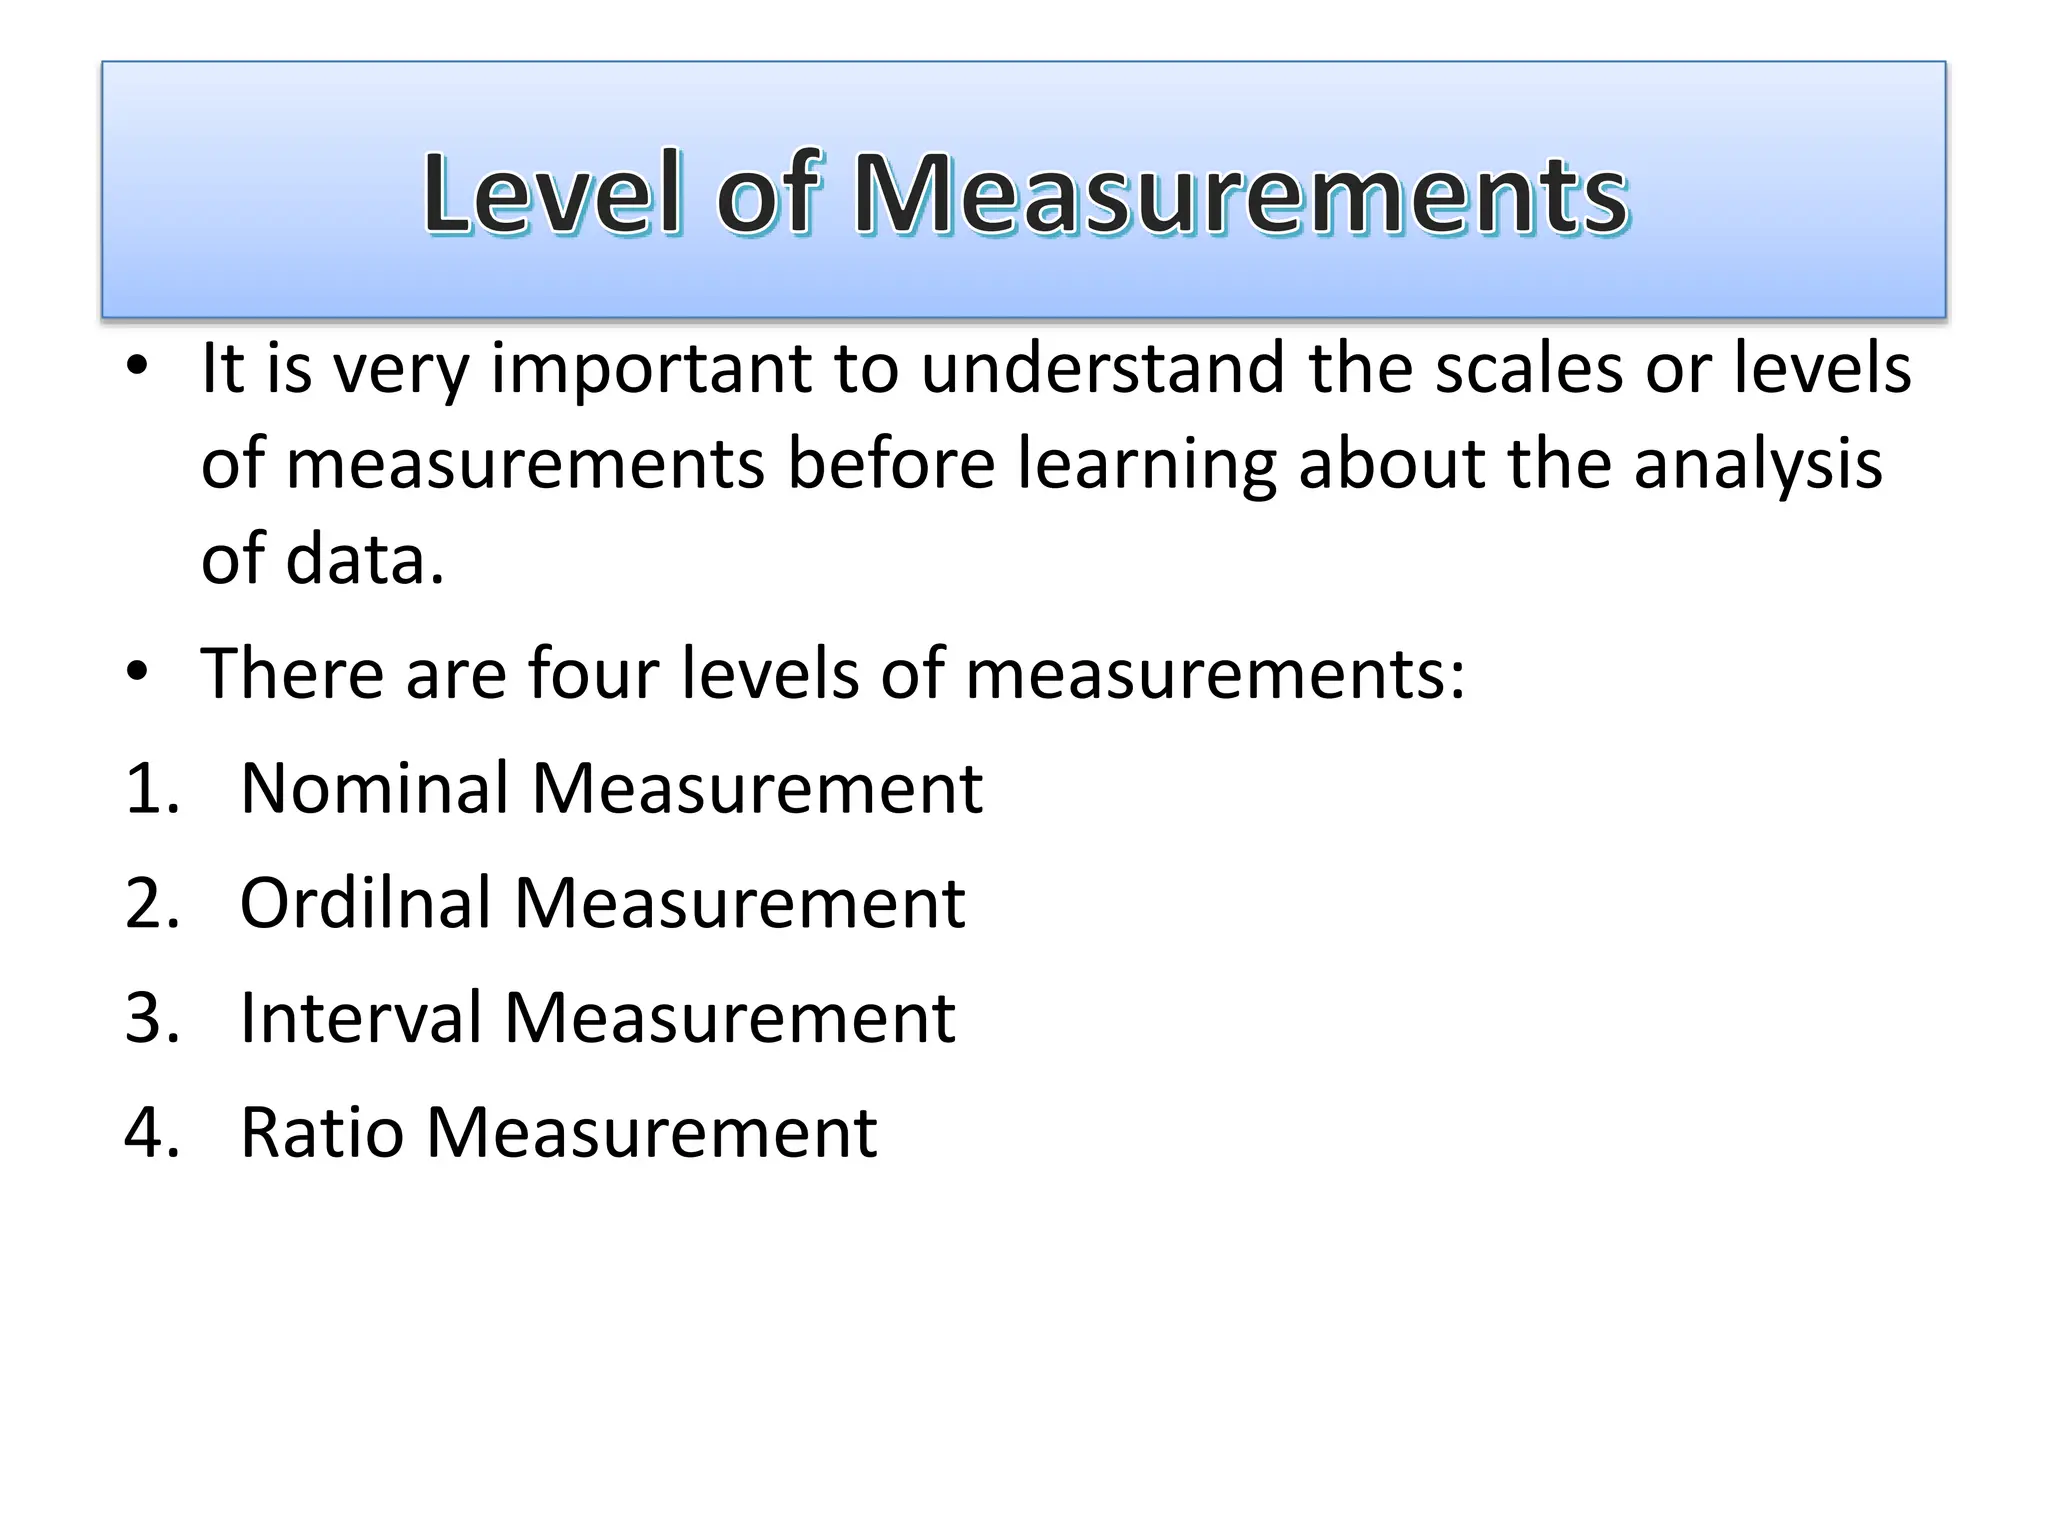
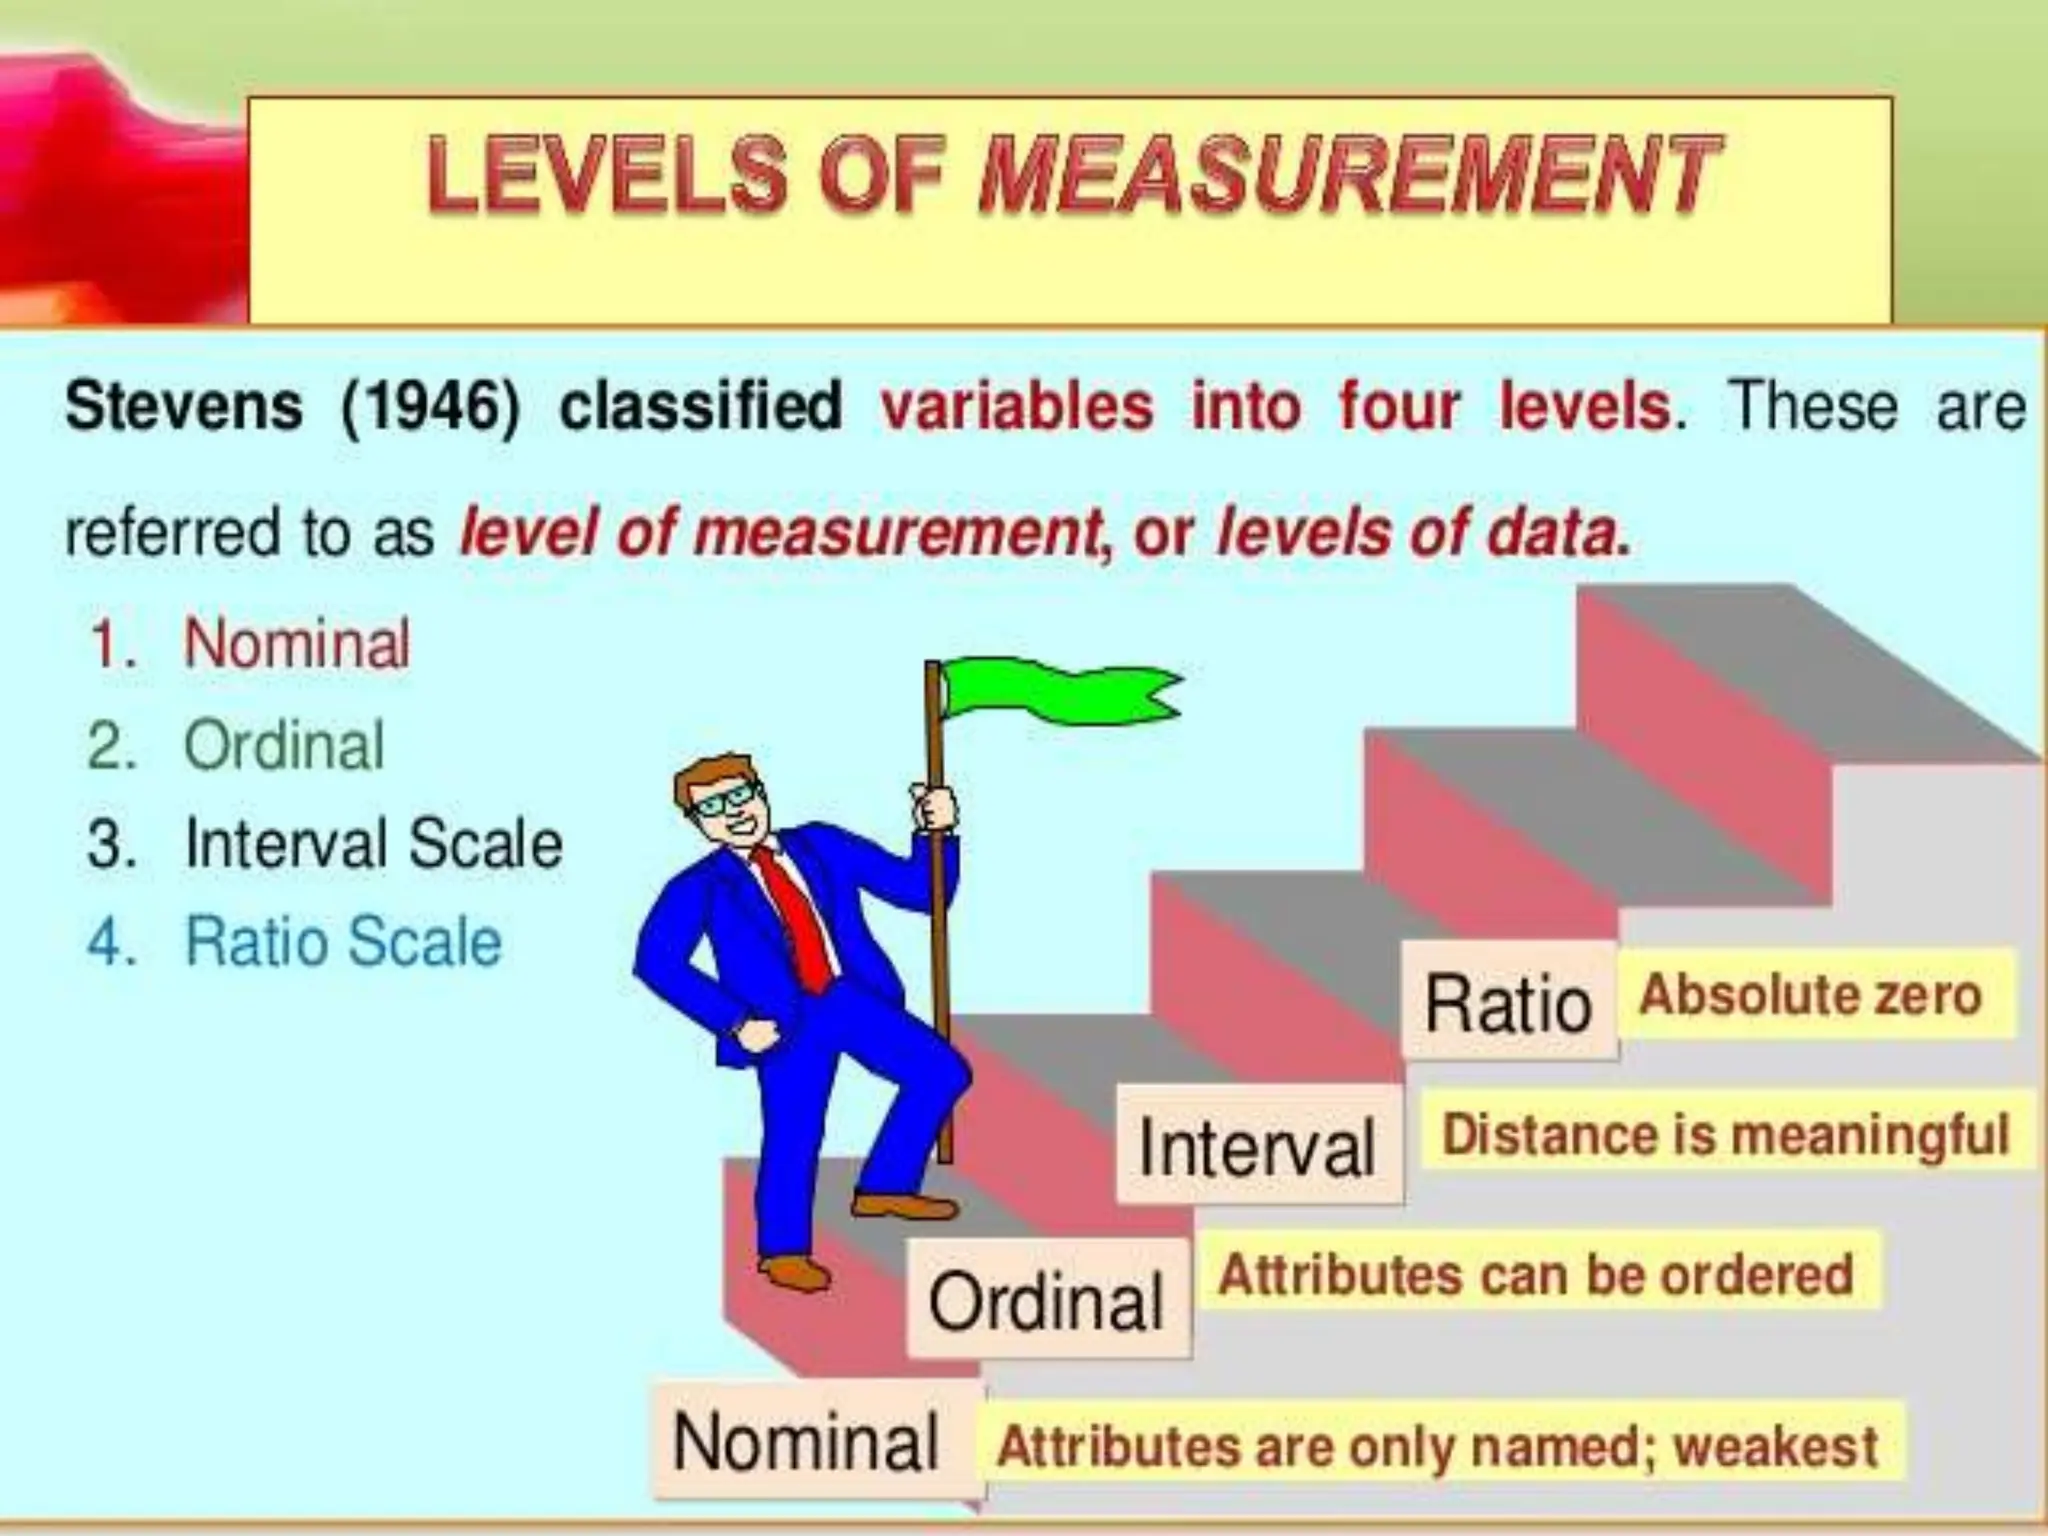
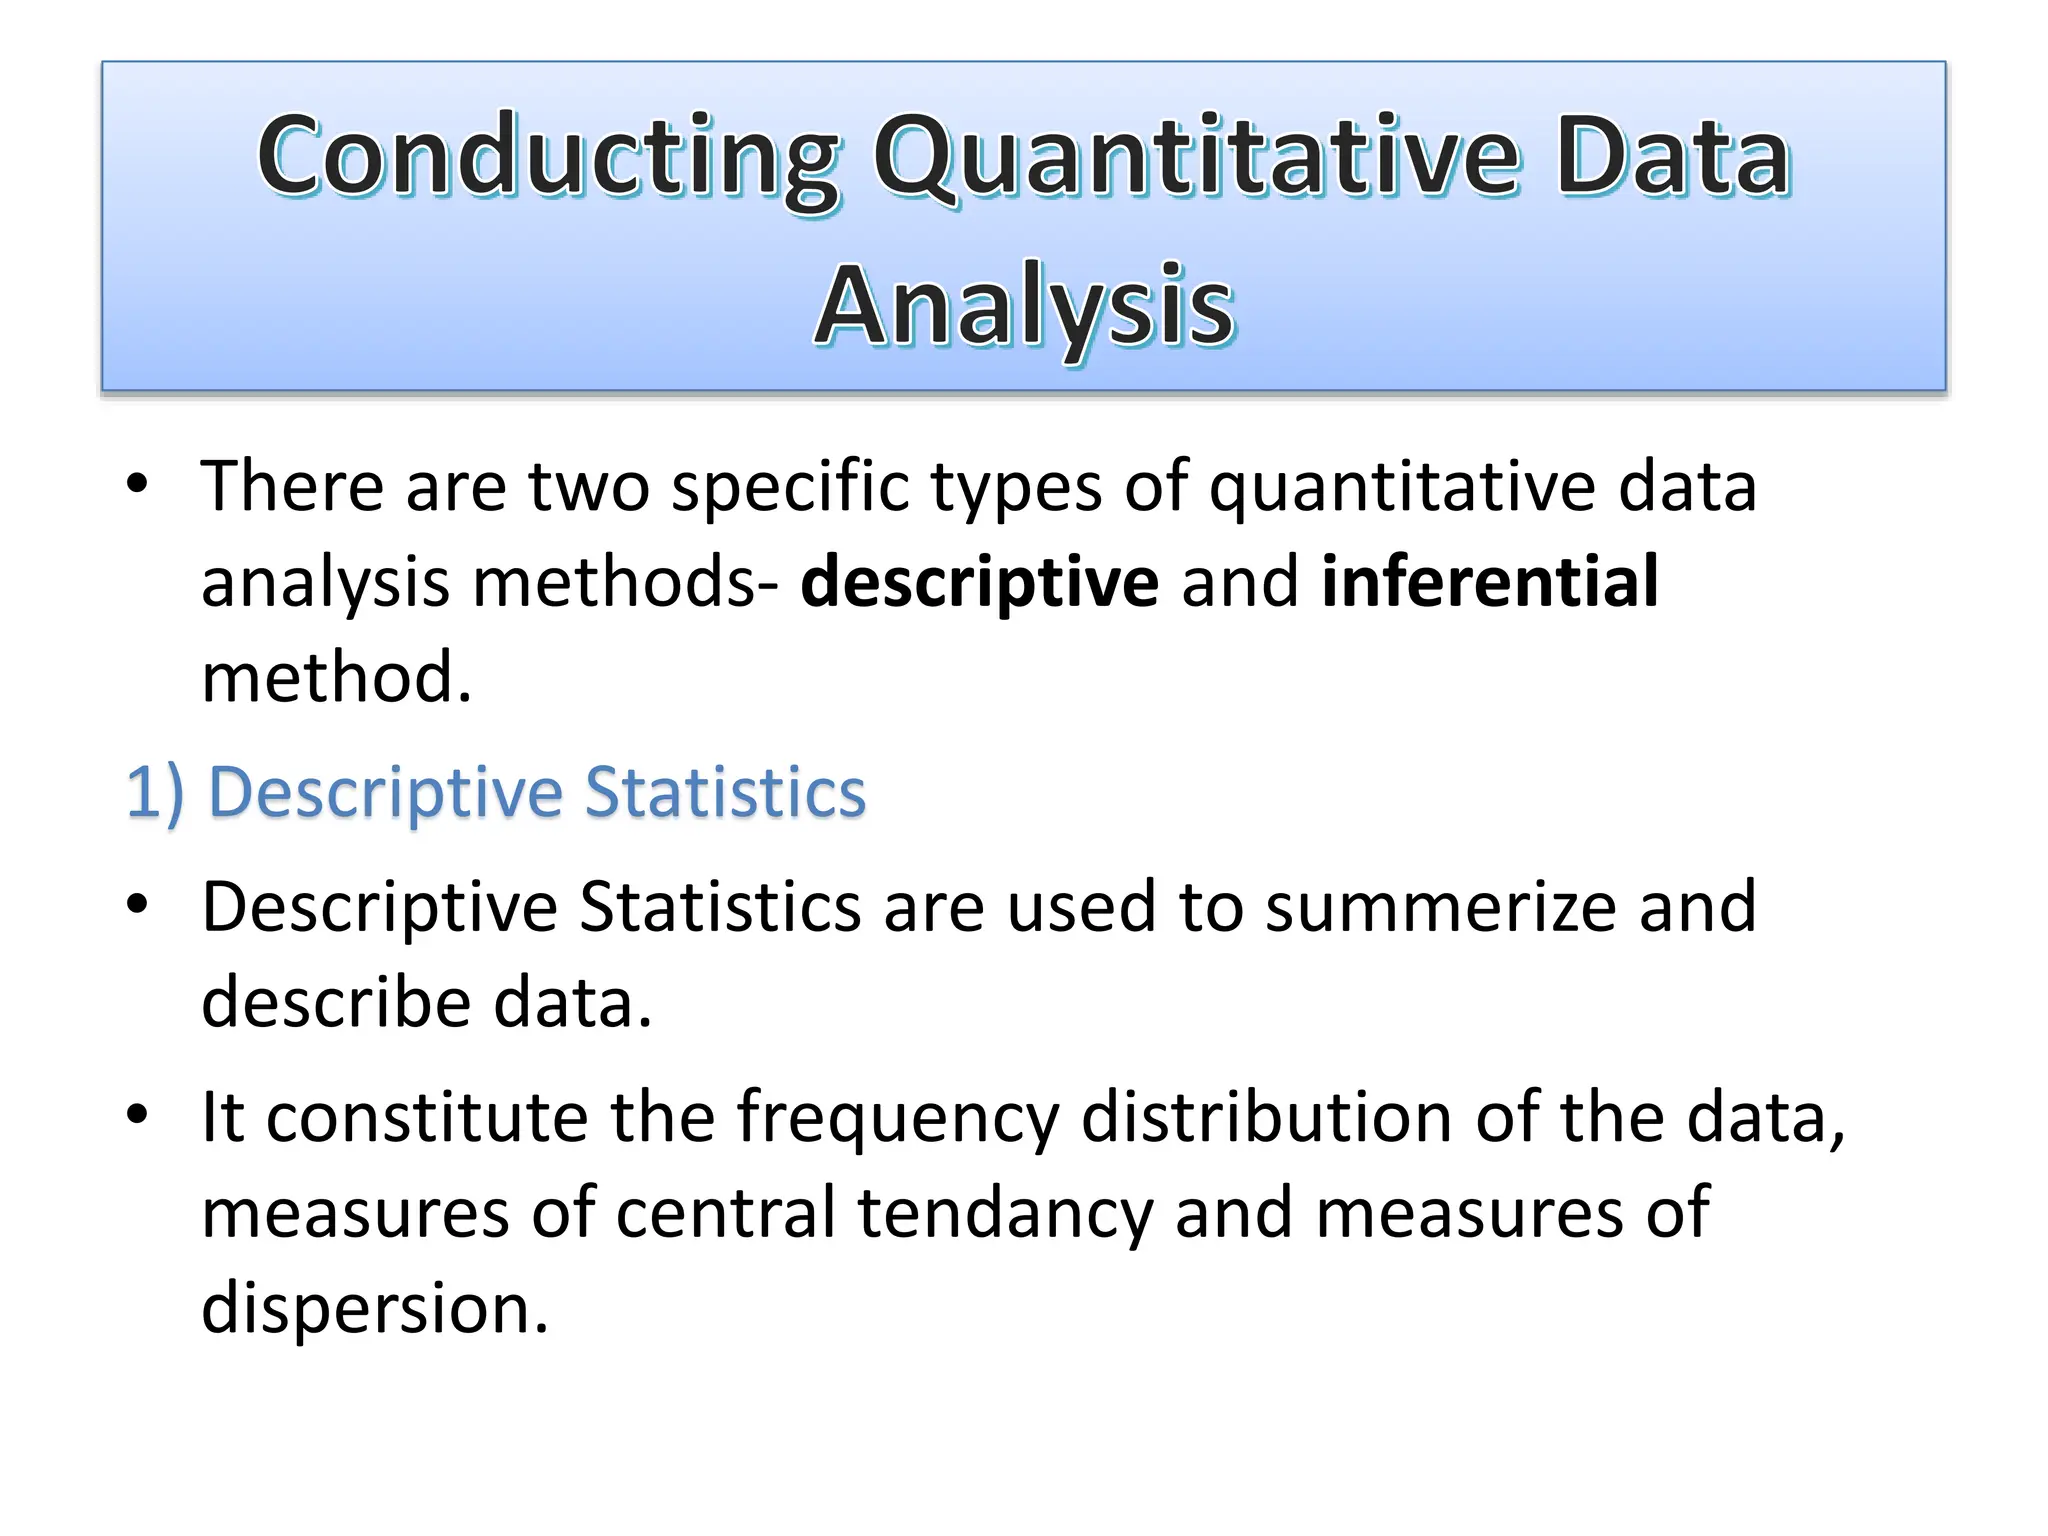
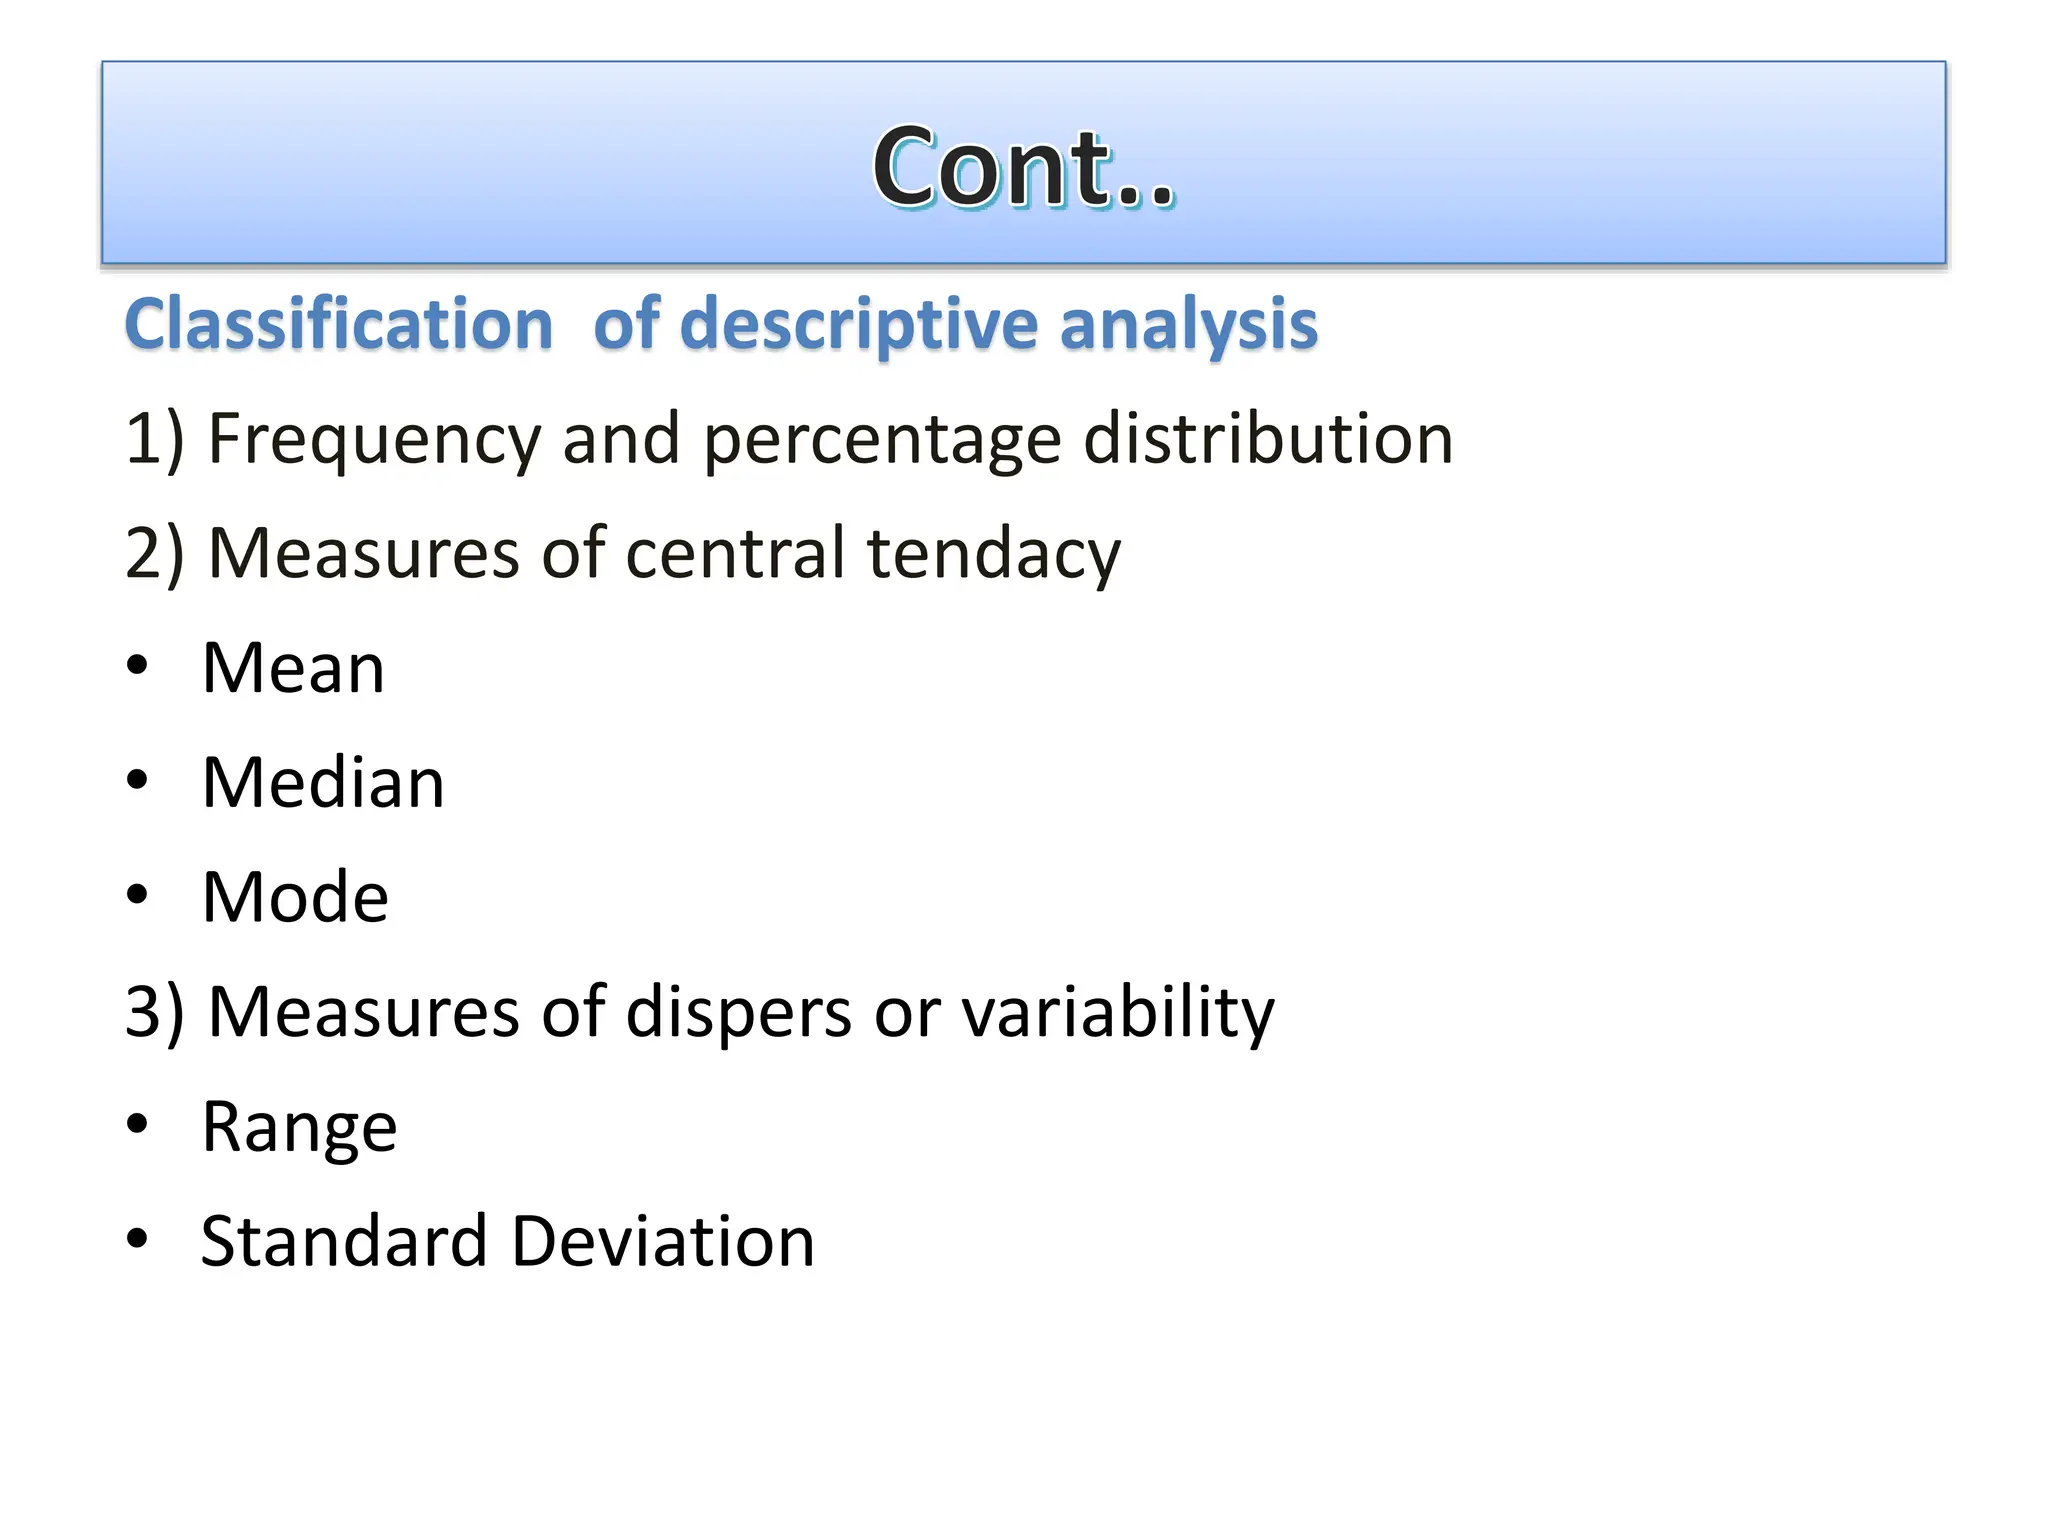
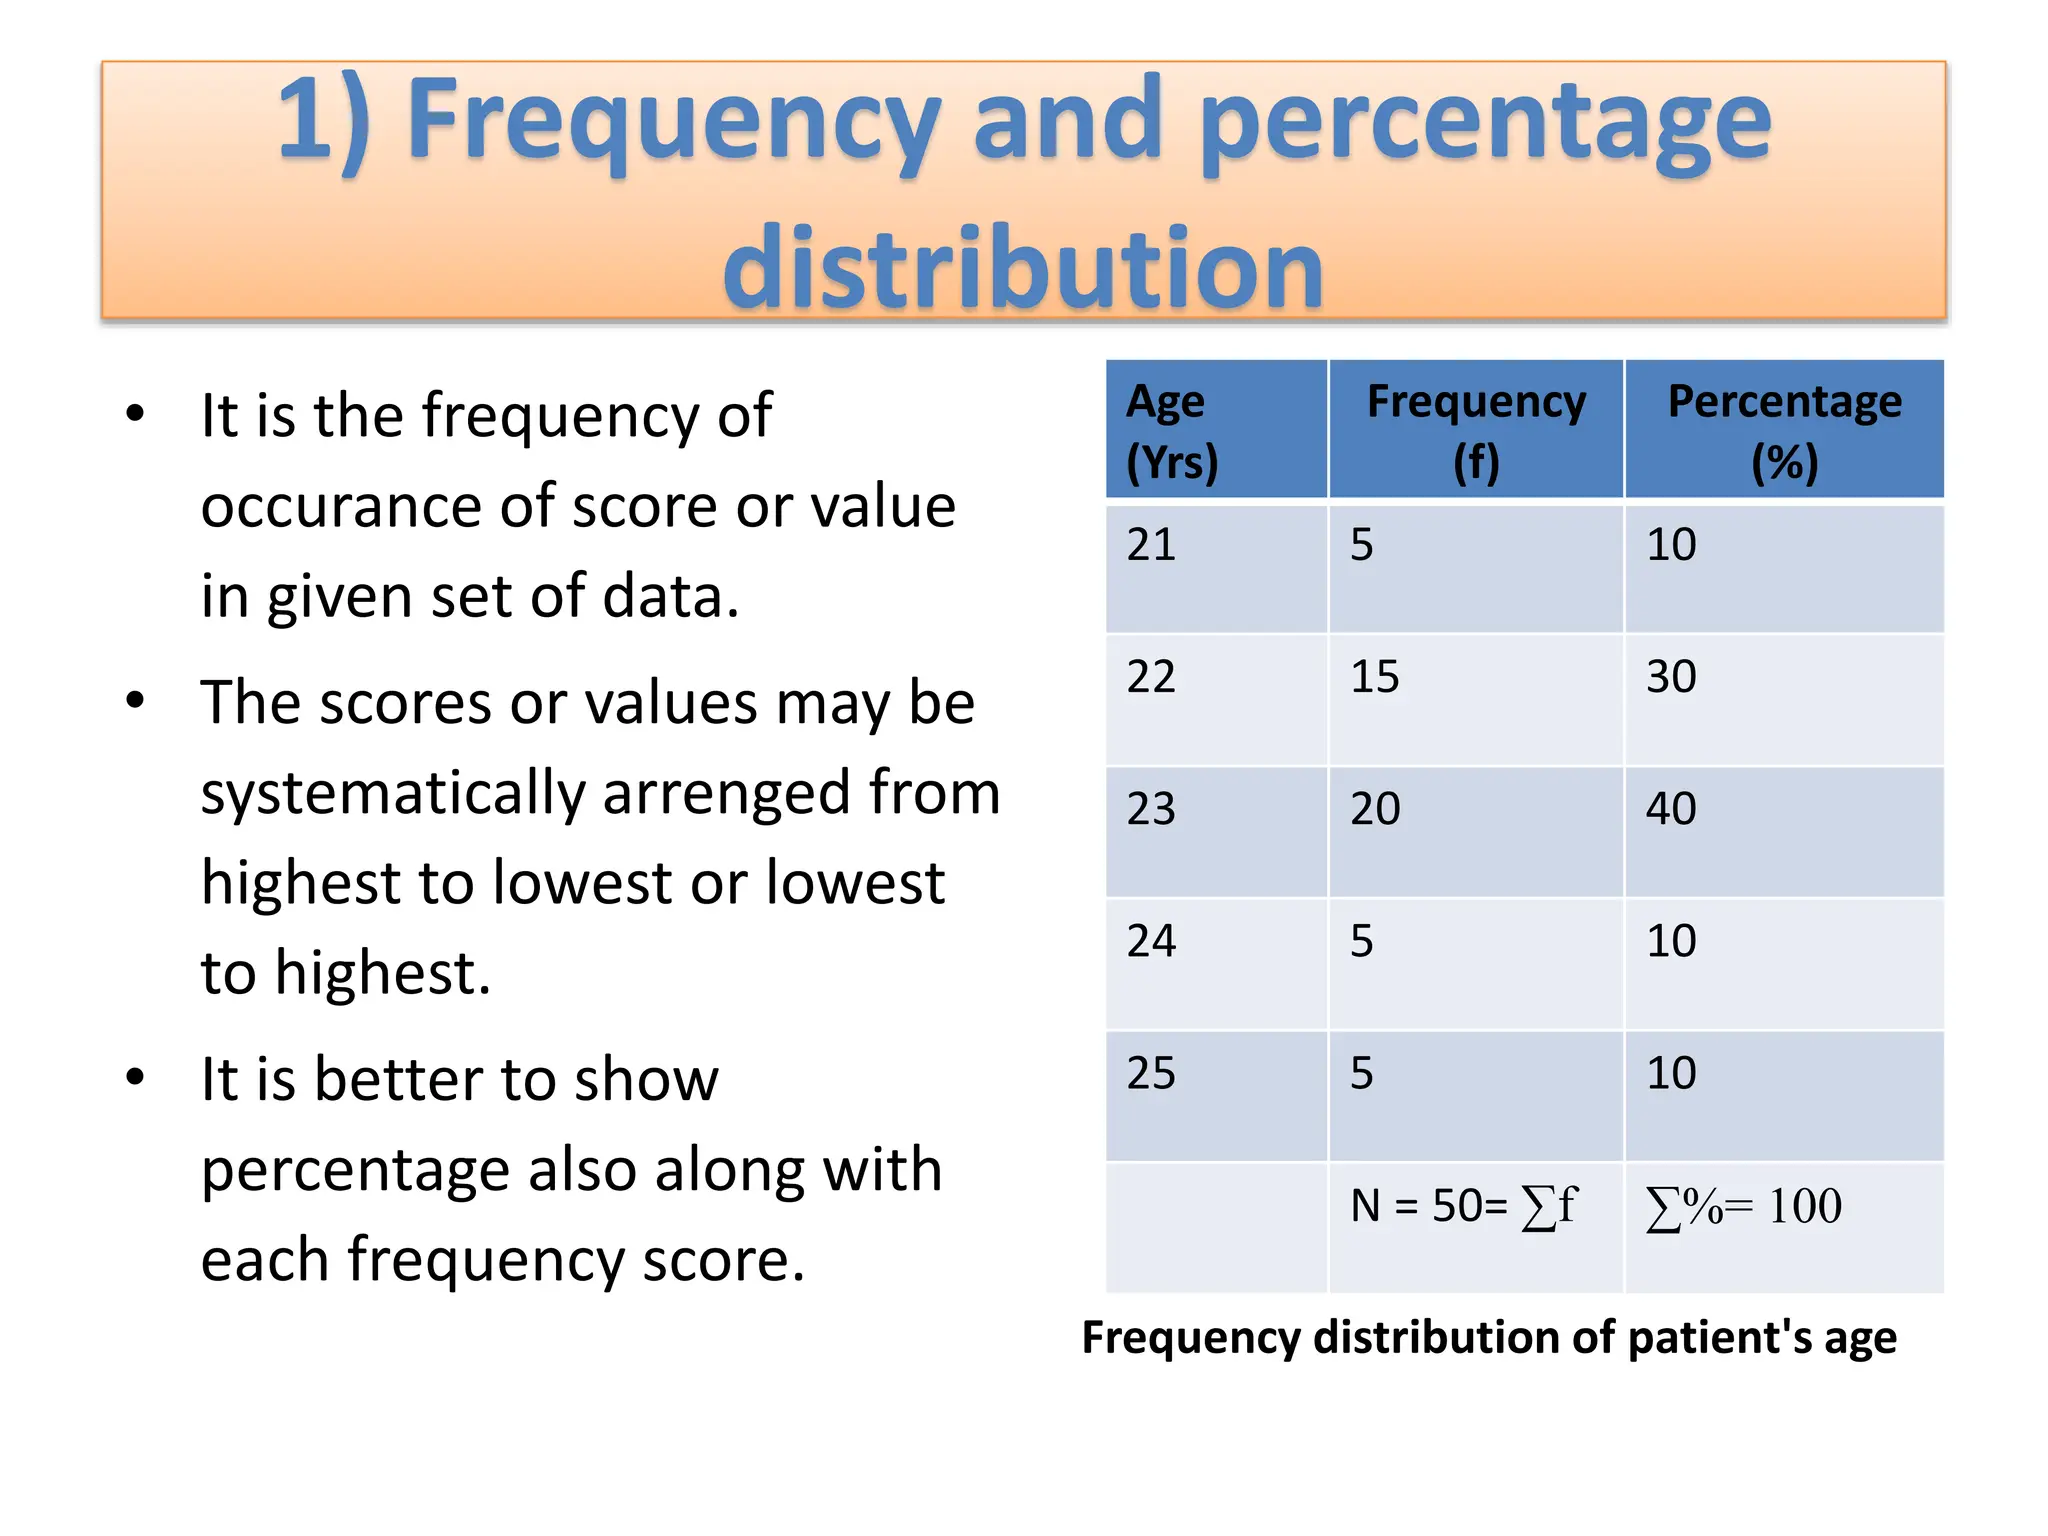
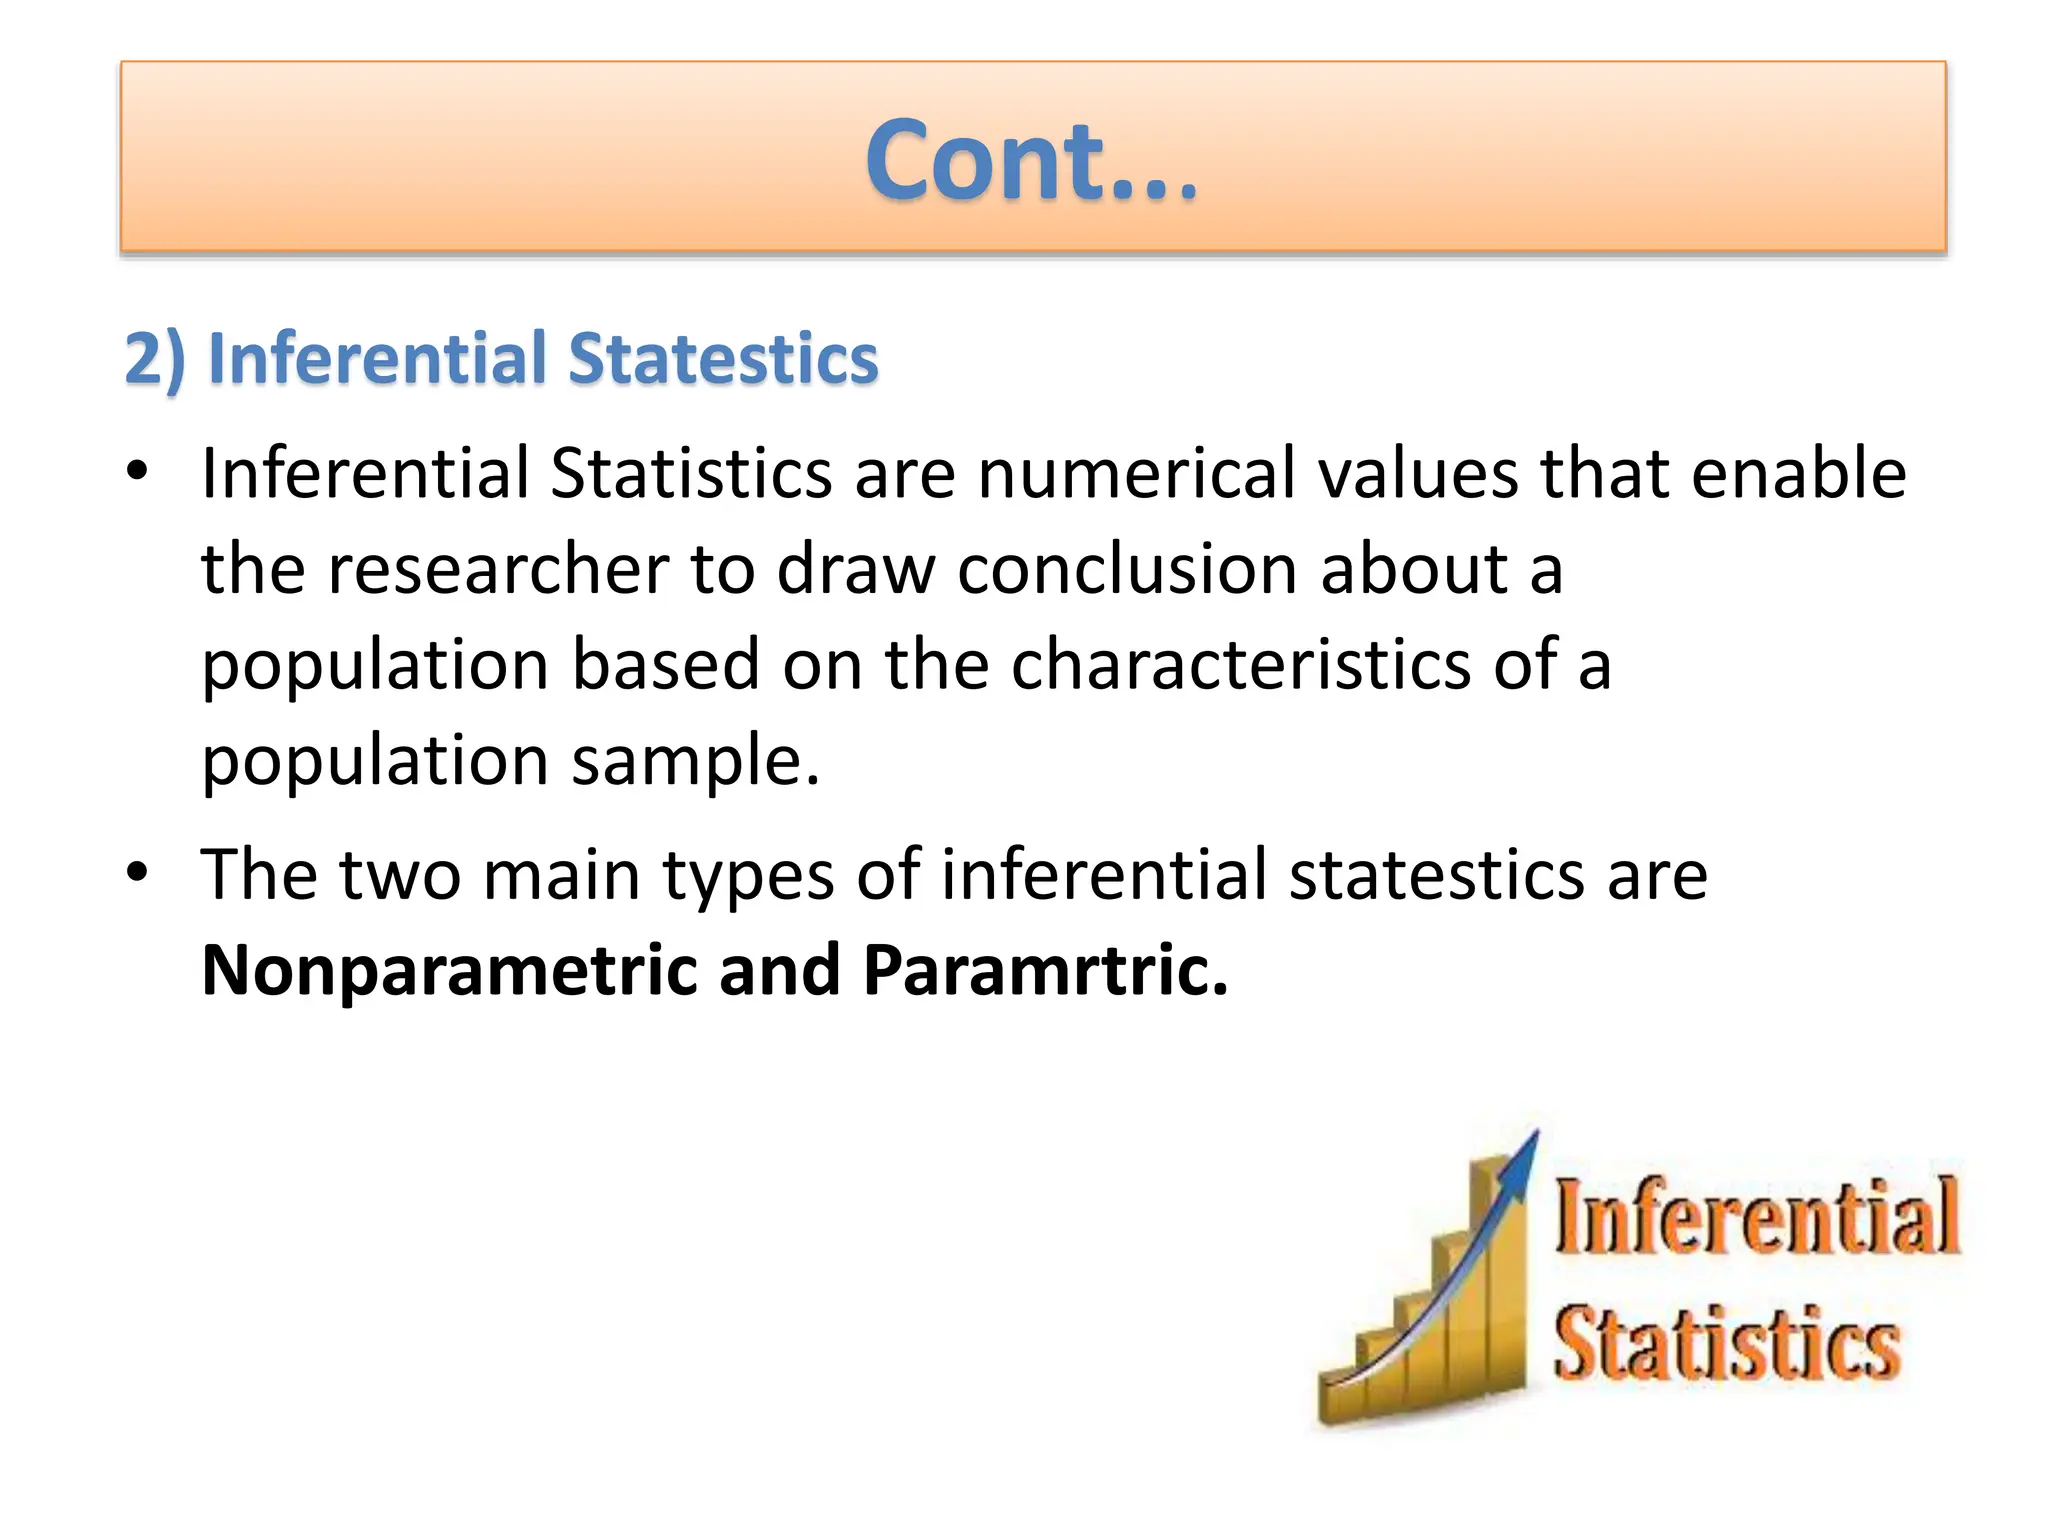
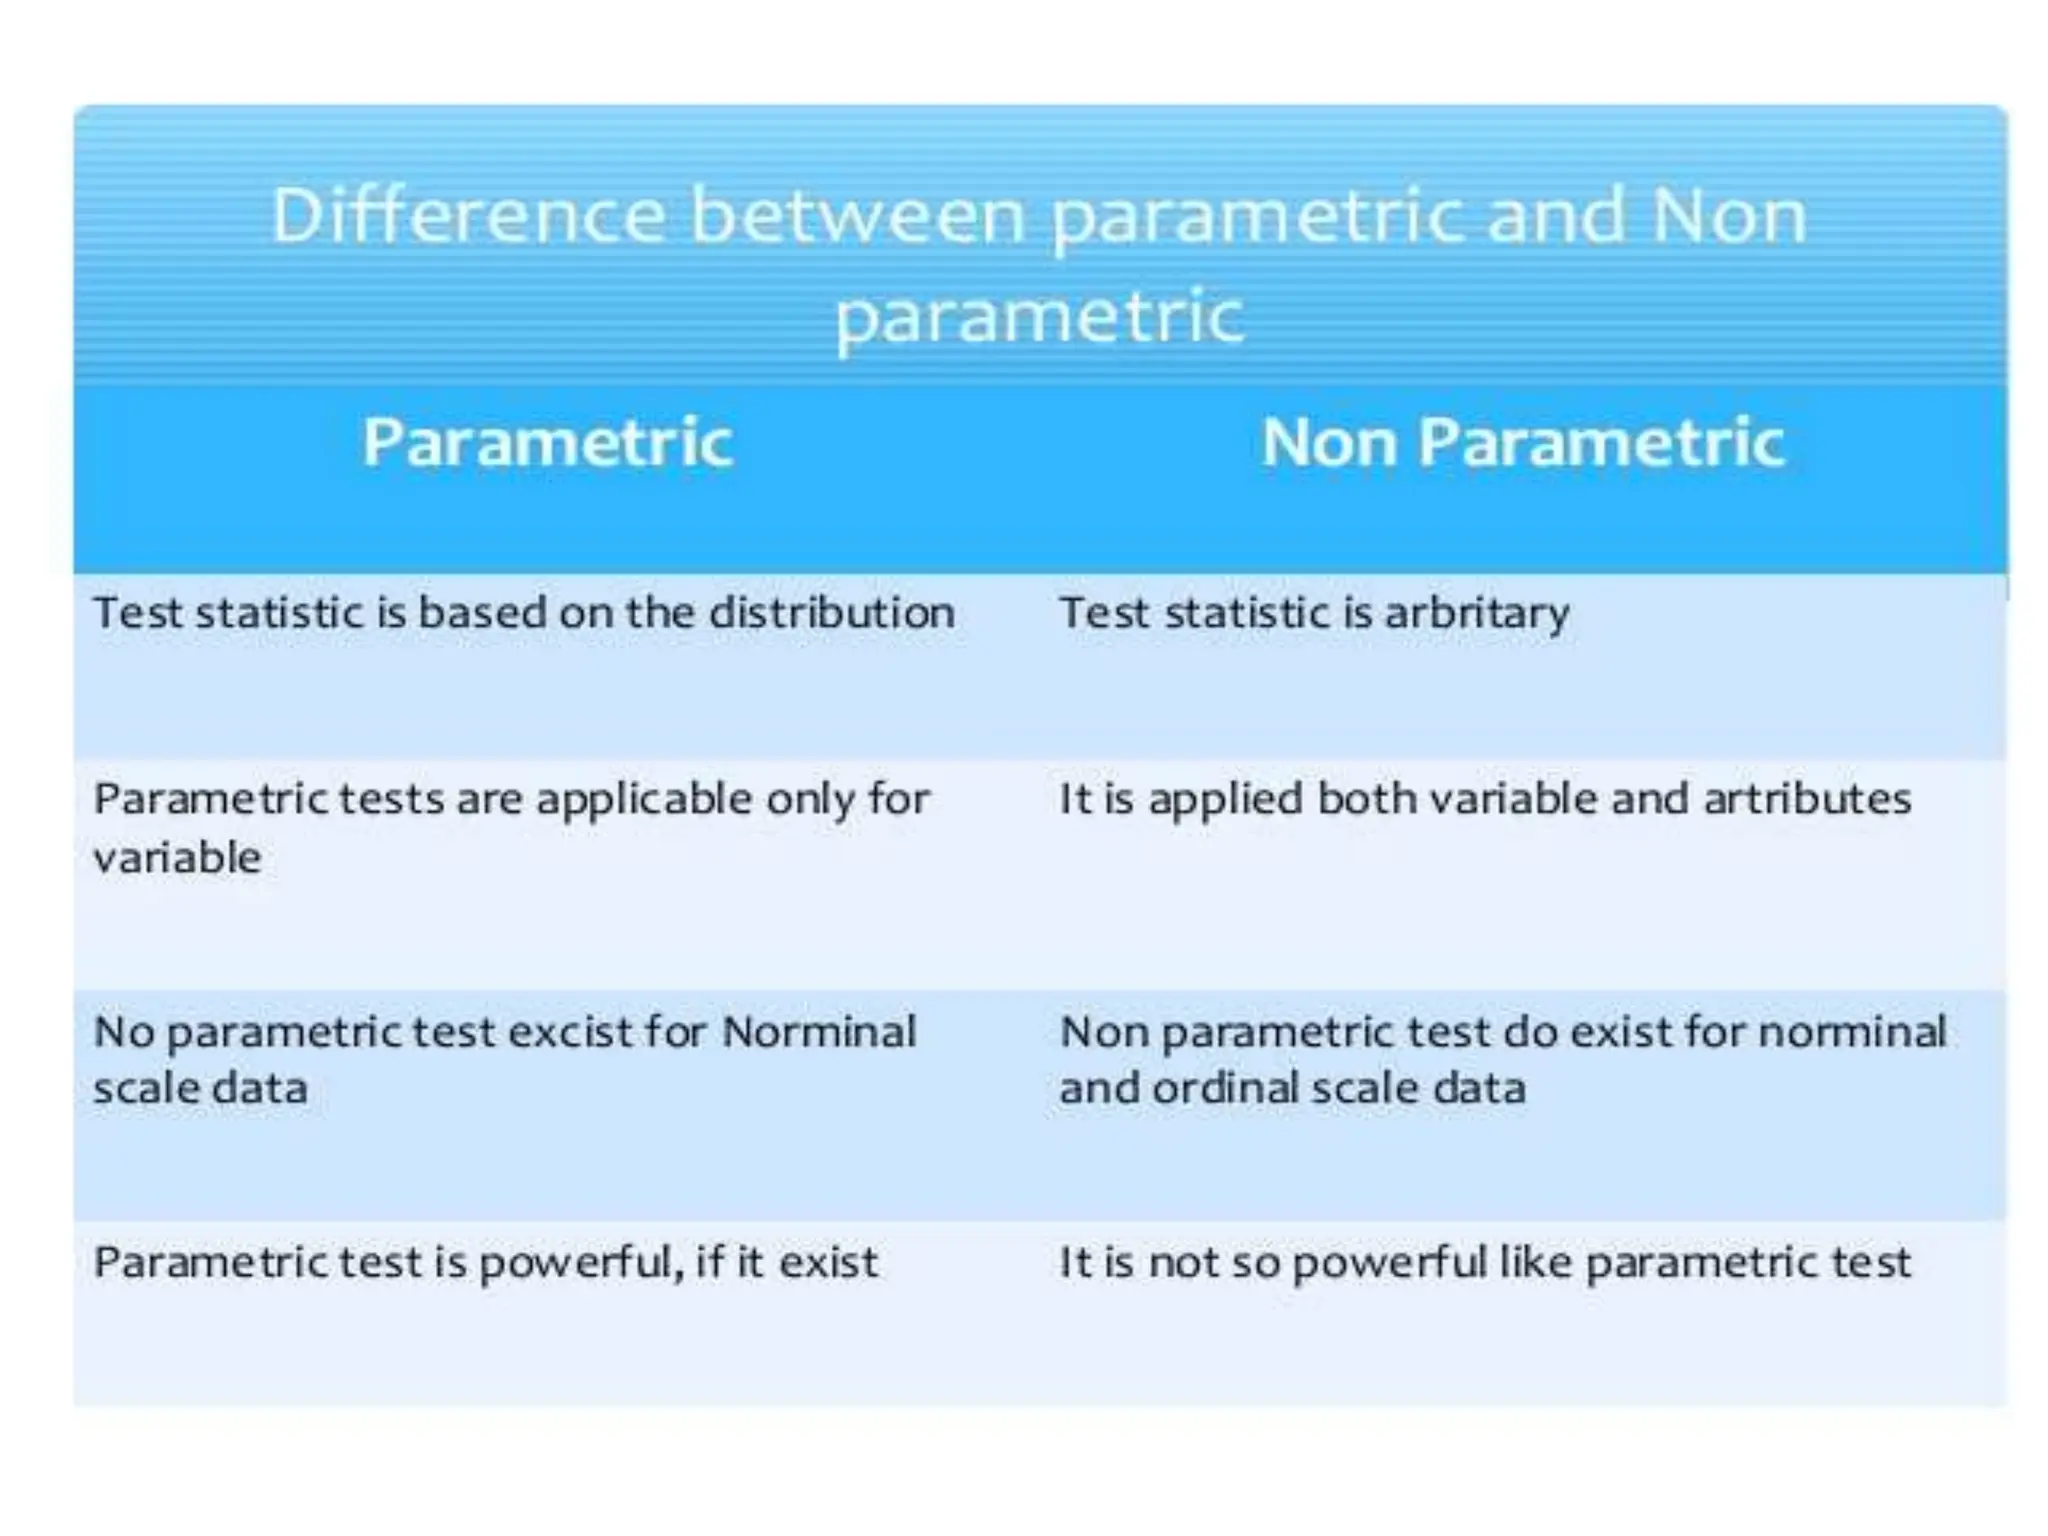
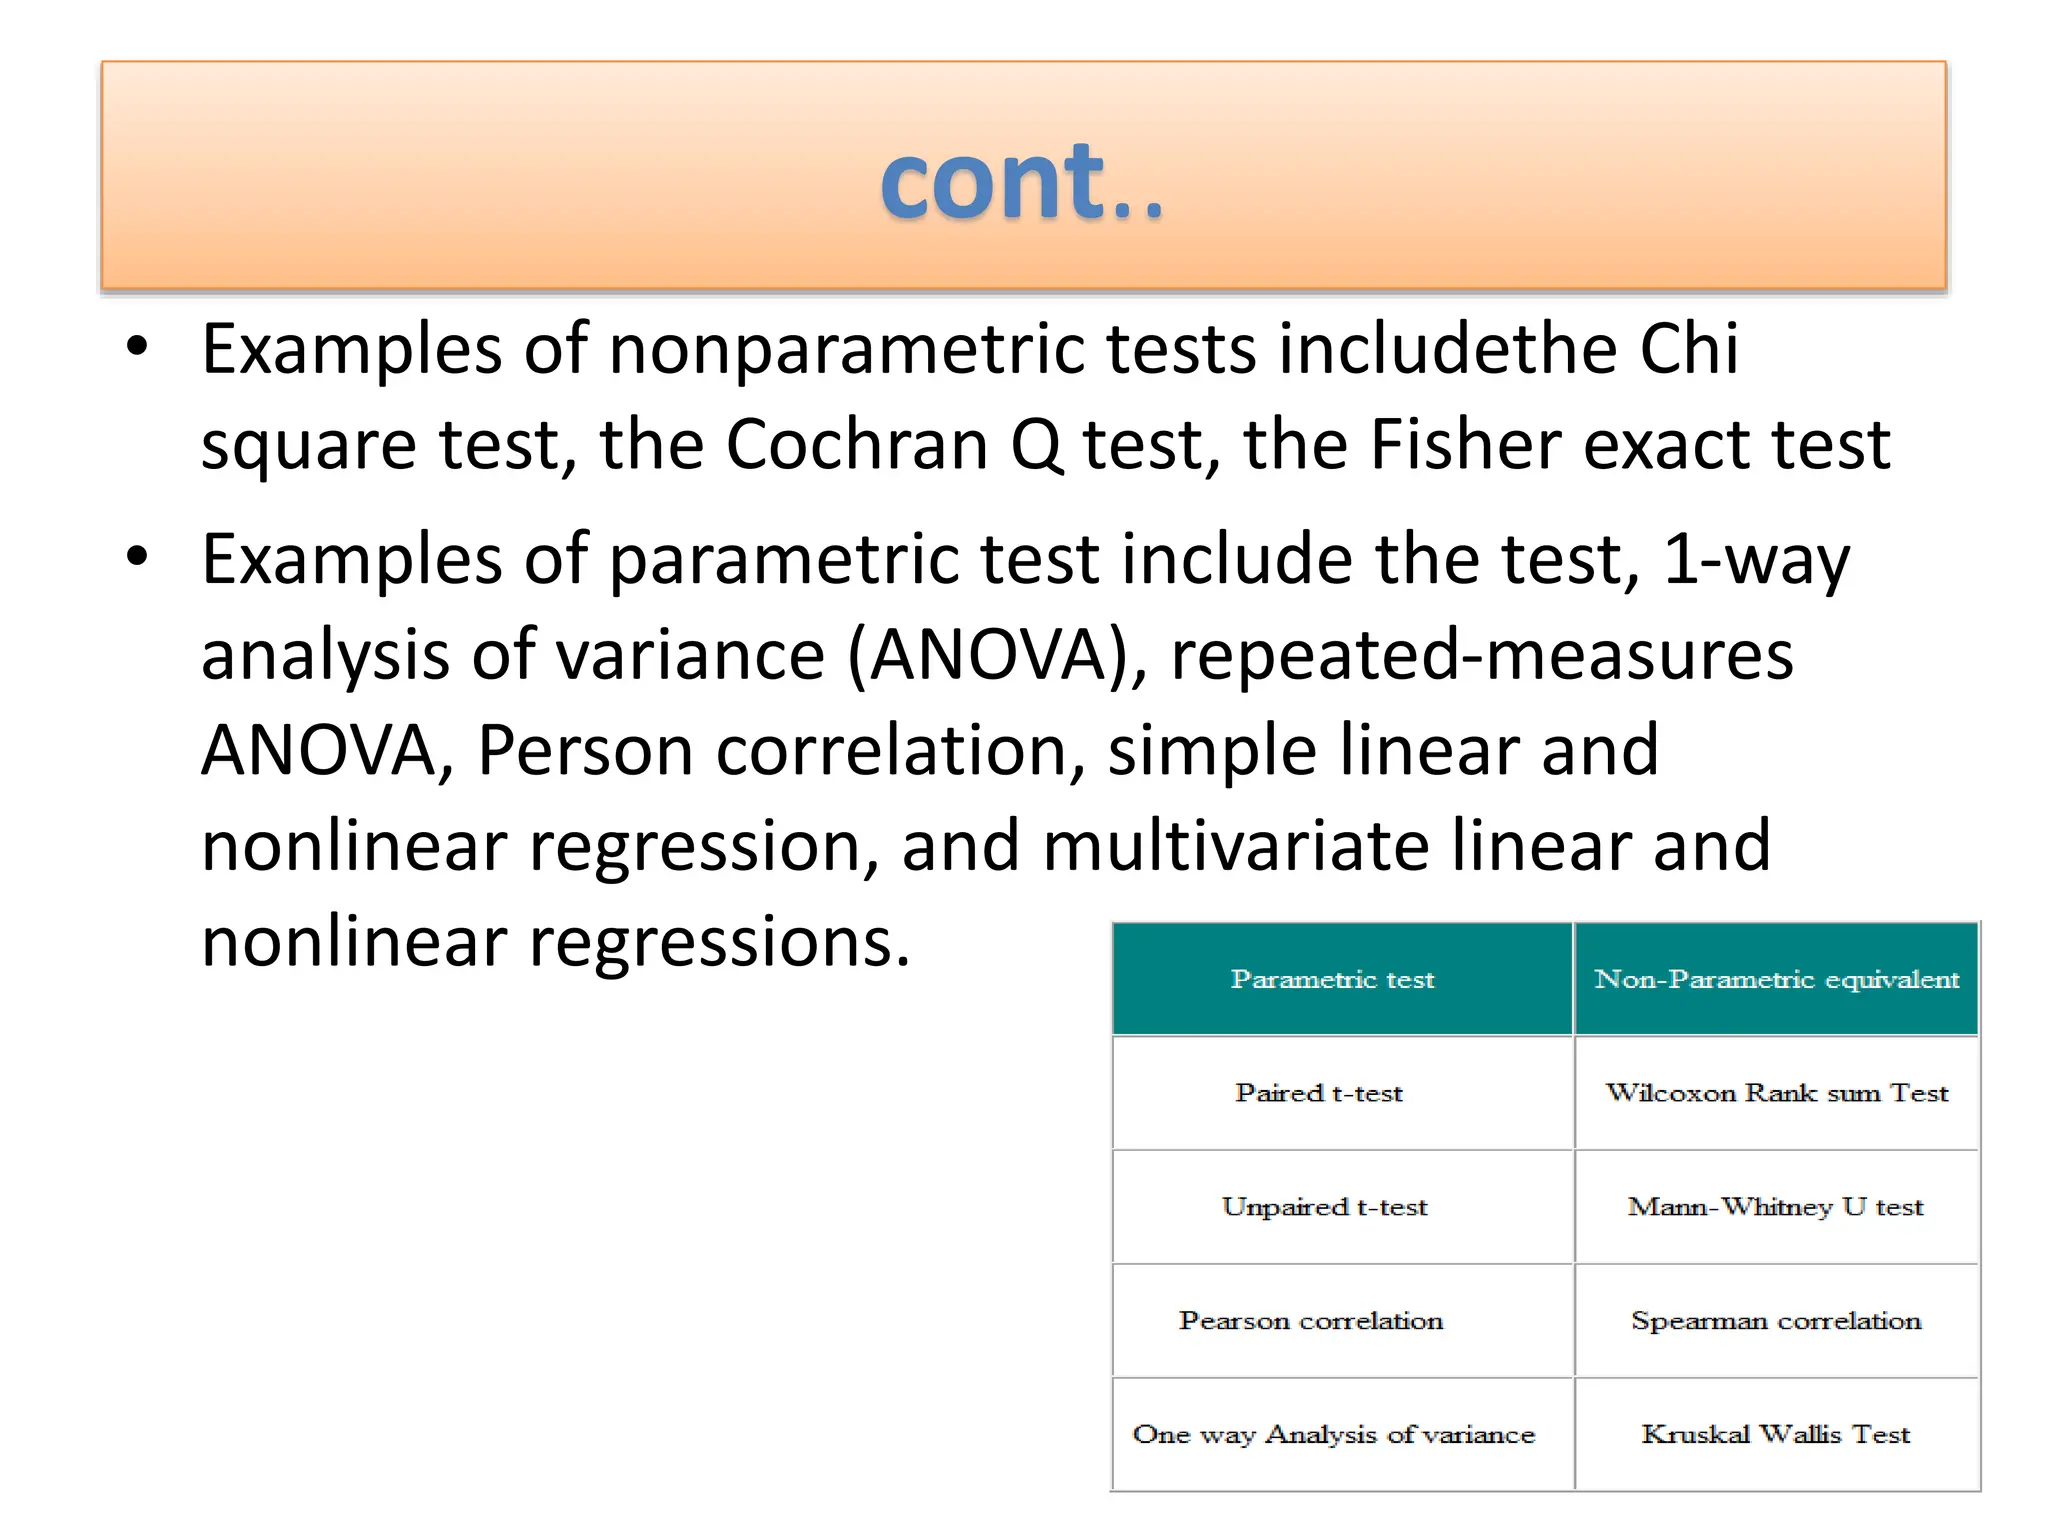
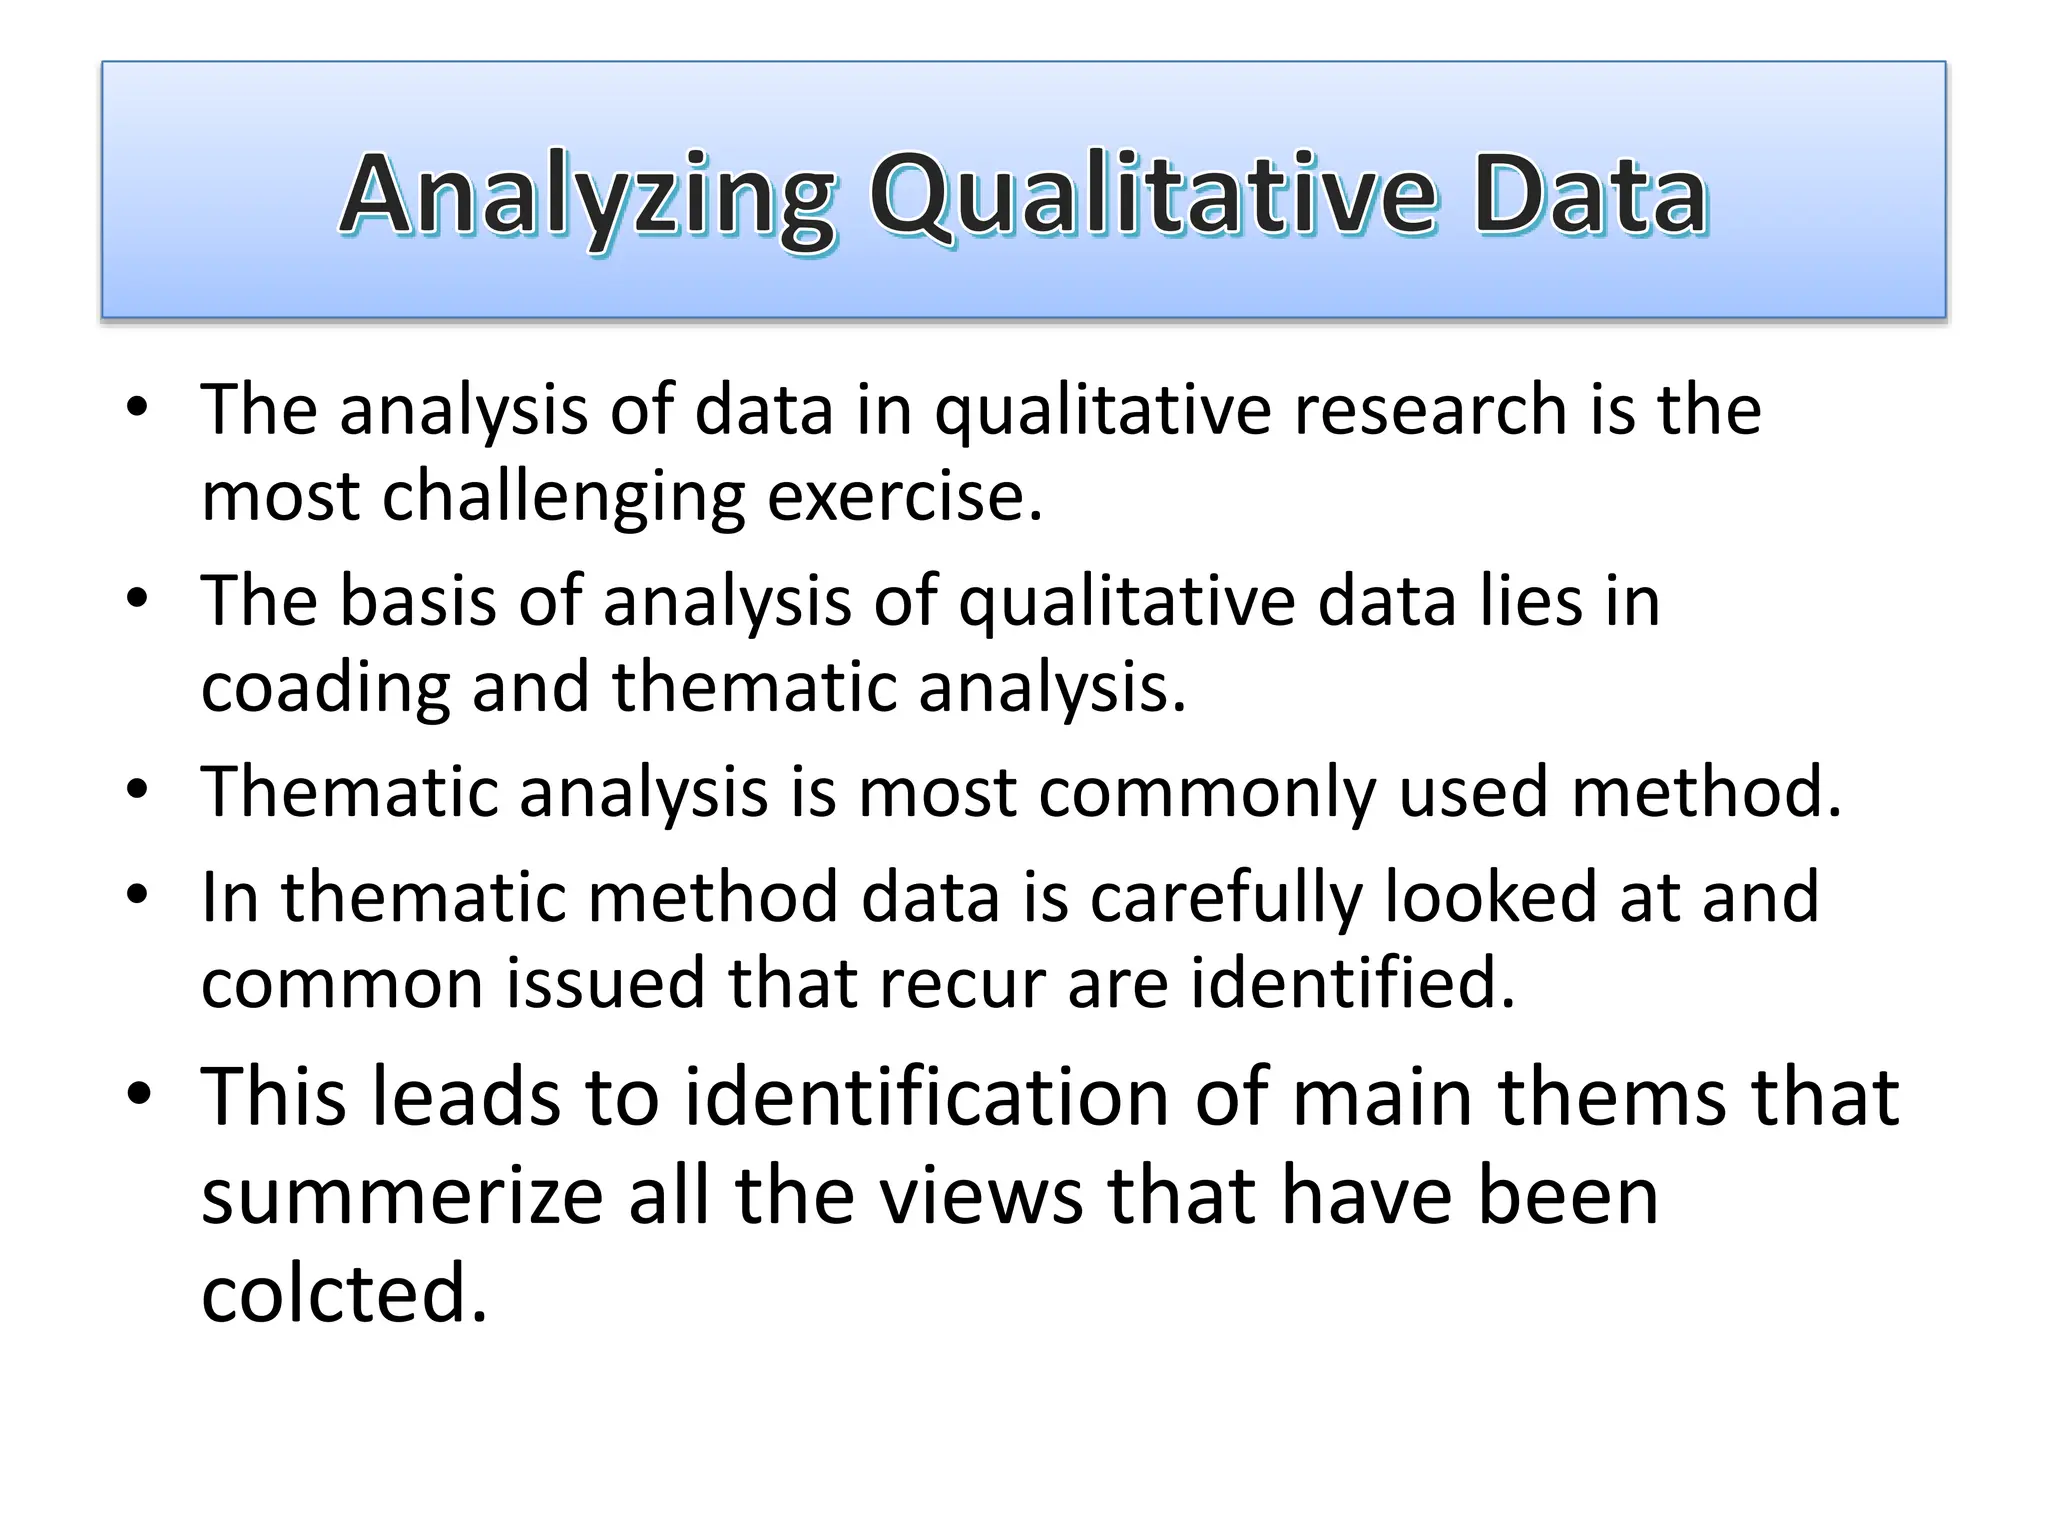
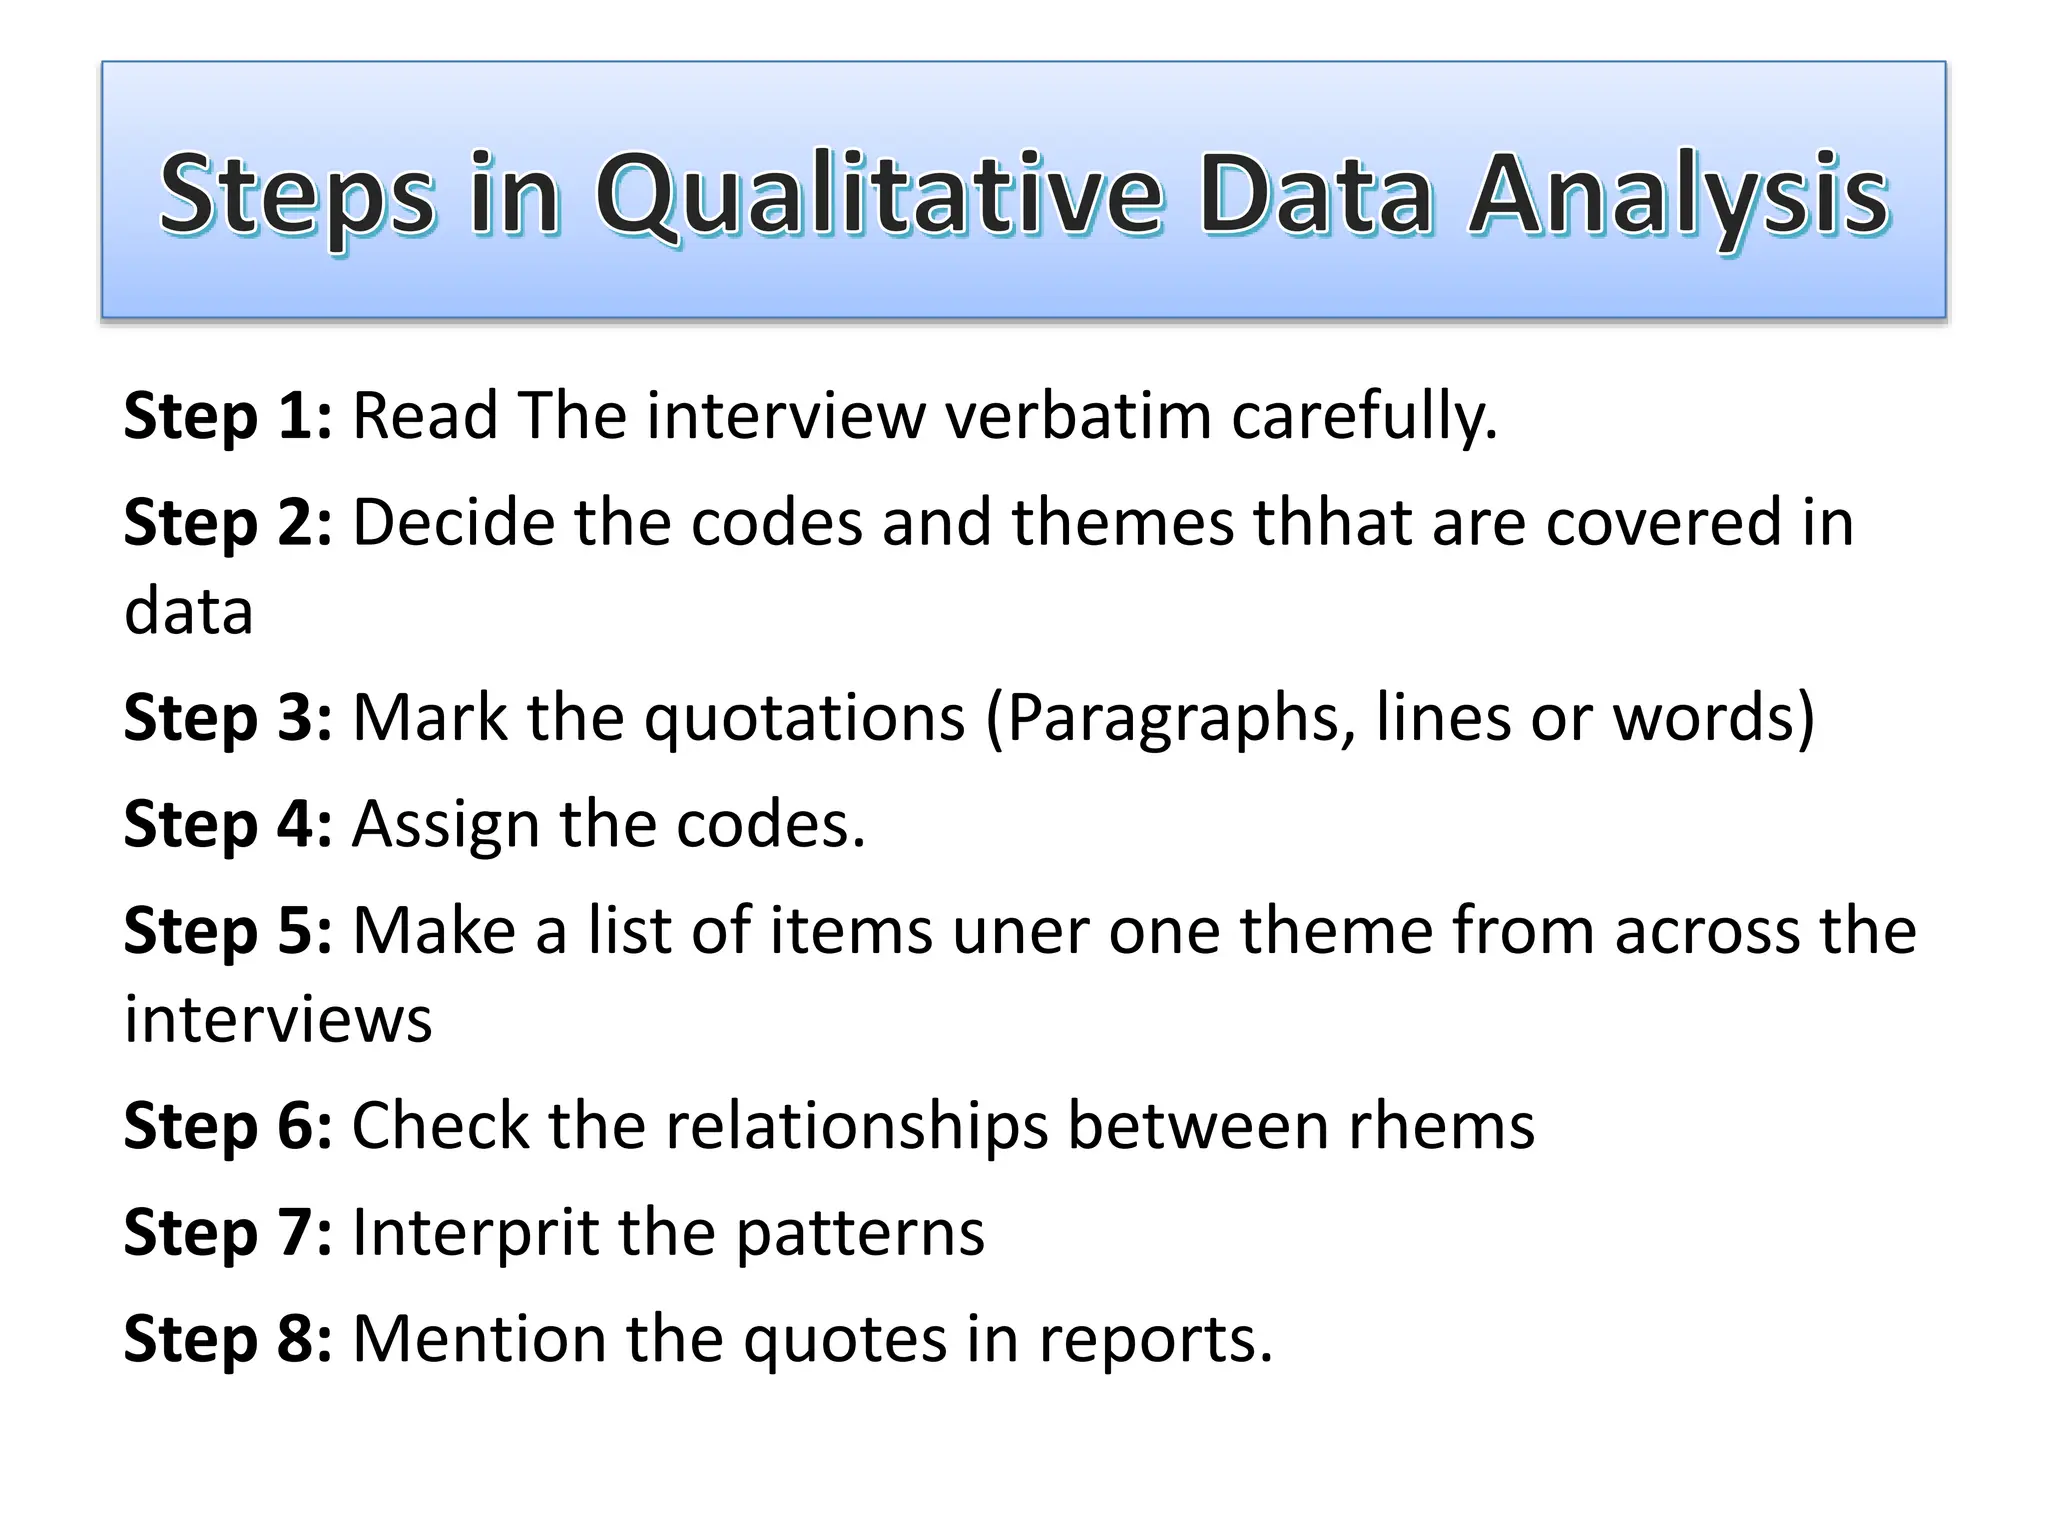
SlideShare a Scribd company logo
Prof. Rupa Varma
Principal,
MKSSS, Sitabai Nargundkar
College of Nursing For Women,
Nagpur
Introduction to Data Analysis
• We nurses during period of our study, learn best method of
nursing process
• After graduation, we go through, research papers presented
at conferences and in current journals to know new methods
for nursing practices
• Training in statistics has been recognized as indispensible for
students
• If we want to establish cause and effect relationship, we need
statistics
• If we want to measure state of health and also burden of
disease in community, we need statistics.
• Data can be defined as a
systematic record.
• It is the different values of
that quantity represented
together in a set.
• It is a collection of facts and
figures to be used for a
specific purpose such as a
survey or analysis.
• When arranged in an
organized form, can be called
information.
Analysis-
• Analysis is the process of
organizing and synthesizing
the data so as to answer
reserch questions and
hypothesis.
• Analysis is the process of
breaking a complex topic
into smaller parts to gain
better understanding of it.
• Almost end of the ladder of research process.
• After collection of data we enter into exciting phase
of research process- Analysis, Presentation and
interpretation.
• Data analysis is the reduction and organization
of a body of data to produce results that can be
interpreted by the researcher;
• A variety of quantitative and qualitative metods may
be used, depending upon the nature of the data to
be analyzed and the design of the study.
• Data analysis is the most complex and mysterious of
all of the phases of a qualitative project, and the one
that receives the least thoughtful discussion in the
literature
• Data after collection has to be processed and
analyzed in accordance with the outline down for
the purpose at the time of developing research plan.
• In process of analysis, relationships or differences
supporting or conflicting with hypotheses are
subjected to statistical tests of significance, to
conclude the study.
• Research consists of two larger steps
1) Gathering the data
2) Analysis of gathered data
• But, no amount of analysis can validly extract
from the data factors which are not present.
Types of data:
Qualitative & Quantitative
Data
Qualitative Quantitative
It was great fun
Discrete-5….. Continuous
3.345
1) Qualitative Data:
• They represent some characteristics or attributes.
• They depict descriptions that may be observed but
cannot be computed or calculated.
• For example, data on attributes such as intelligence,
honesty, wisdom, cleanliness, and creativity collected
using the students of your class a sample would be
classified as qualitative.
• They are more exploratory than conclusive in nature.
2) Quantitative Data:
• These can be measured and not simply observed.
• They can be numerically represented and calculations
can be performed on them.
• For example, data on the number of students playing
different sports from your class gives an estimate of
how many of the total students play which sport.
• This information is numerical and can be classified as
quantitative.
• It is intermediary stage between data collection and
data interpretation.
• Steps
 Identifying or compiling data structures
 Editing the data
Coding
Organizing the Data
Classifying the data
Analyzing the data
Tabulation of data
• The collected data may be
adequate, valid and reliable
to any extent, it does not
serve any worthwhile
purpose unless it is carefully
edited, systematically
analyzed, intelligently
interpreted and rationally
concluded.
• It means putting
together or composing
the collected data.
• It includes arranging all
the collected data in a
sequence.
• In orderly and organized
manner.
• Monitor the data for quality and
comprehensiveness.
• Each piece of data should be
checked for accuracy and
completeness.
• Coding is translating answers into numerical value.
• Assigning numbers to various categories of a variable
that can be entered into database in a form which can be
analyzed easily.
• Coding of all the forms should be done on daily basis in
order to manage the work.
• In case of open ended question, it is to be placed in
various categories and each category is assigned a code.
• Coding of open ended question require lot of efforts
from researcher.
a. Selecting software
package
b. Entering the data
c. Cleaning the data/
managing missing value
a) Selecting a software package:
• Except in small studies, the researchers always make
use of computer for analysis of data.
• SPSS (Statistical Package for social Sciences) is
prefferred by majority of the researchers.
b) Entering the Data:
• The Data can be entered directly from the
questionnaires.
• It is always good to have two persons entering the data
to prevent errors and mistakes.
c) Data Cleaning and managing the missing value:
• After completing whole data entry, the reseaecher
must take out the print of that file.
• Checking the data for error is called cleaning.
• If any respondant may not have given an answer for
a question.
• Some data analysis programs have a mechanism for
handling missing values, giving them a code or not
using that case in the data analysis.
• The calssification of data implies that the collected
raw data is categorized into common groups having
common features.
• It can be according to the numerical characteristics
or according to attributes.
• The Numeical characteristics are classified on the
basis of class intervals.
• As per attributes, the data is classified on the basis of
common characteristics like literacy, sex, marital
status, etc.
• First the discriptive statistics is
employed to obtain the
frequencies of discriptive
variables.
• This is followed by application
of inferential statestics to test
the hypothesis, research
question or objectives.
• Tabulation is the orderly
arrangement of data in rows and
columns.
• It conserves space.
• It facilitates rocess of comparison
and summerization.
• It also facilitates detection of
errors and ommissions and
establishes the basis of various
statestical computation.
Computing the data
Editing the data
Coding the data
Selecting the software
Entering the data
Data cleaning and managing the missing
valve
Classification of data
Analysis of data-descriptive &
inferential statistical tests
Tabulation of data
• Quantitative data analysis is the process of using
statistical meyhods to describe, summerize and
campare the data.
• It provides quantifiable and easy to understand
results.
• First it is importantto identify level of measurement
associated with quantitative data.
• It is very important to understand the scales or levels
of measurements before learning about the analysis
of data.
• There are four levels of measurements:
1. Nominal Measurement
2. Ordilnal Measurement
3. Interval Measurement
4. Ratio Measurement
Nominal Measurement
Ordilnal Measurement
Interval Measurement
Ratio Measurement
Qualitative measures-
Calssify into nonnumeric
Catagogies
Quantitative measures-
Measurement is numerical
The Nominal scale, sometimes
called qualitative type, that
differentiate between Items or
subjects only on the basis of their
names or categories or qualities
Examples Include Gender,
nationality, language, style, Marital
status, student ID, state of
residence.
An ordinal scale not only classifies subject but also
ranks them in terms of the degree to which they
possess a characteristics of interest. An ordinal scale
indicates relative position
The order of ranking is iposed on categories
Example:
Health Staus
A) Poor B) Fair
C) Good D) Excellent
There is specification of ranking of objects
on an attribute of the distance between
those objects.
There is, more or less, equal numerical
distance between intervals
Example: Temperature
A) 100- 800 B) 40o-500
This is the highest level of
measurement and has the
properties of other three
levels.
Has absolute zero point.
Examples: Biophysical
Parameters
a) Weight b) Height
c) Volume d) Bood Presure
• There are two specific types of quantitative data
analysis methods- descriptive and inferential
method.
1) Descriptive Statistics
• Descriptive Statistics are used to summerize and
describe data.
• It constitute the frequency distribution of the data,
measures of central tendancy and measures of
dispersion.
Classification of descriptive analysis
1) Frequency and percentage distribution
2) Measures of central tendacy
• Mean
• Median
• Mode
3) Measures of dispers or variability
• Range
• Standard Deviation
1) Frequency and percentage
distribution
• It is the frequency of
occurance of score or value
in given set of data.
• The scores or values may be
systematically arrenged from
highest to lowest or lowest
to highest.
• It is better to show
percentage also along with
each frequency score.
Age
(Yrs)
Frequency
(f)
Percentage
(%)
21 5 10
22 15 30
23 20 40
24 5 10
25 5 10
N = 50= ∑f ∑%= 100
Frequency distribution of patient's age
2) Measures of central tendacy
MEAN
• Add all the numbers then divided
by the amount of numbers
• 9,3,1,8,3,6(30 ÷ 6=5),mean is 5
MEDIAN
• Order the set of numbers, the
median is the middle number
• 9,3,1,8,3,6(1,3,3,6,8,9) median is
4.5
MODE
• The most common number
• 9,3,1,8,3,6 mode is 3
3) Measures of dispers or
variability
a) Range
The distance between the highest score and the lowest
score in a distribution.
When to use
 Sample description is desired.
 Variance or standard deviation
Cannot be computed.
 Have ordinal data.
 Presenting your results to
people with little .
Cont...
2) Standard Deviation
The most commonly used measure of variability
that indicates the average to which the scores deviate
from the mean.
Uses
• Biological studies
• Fitting a normal curve to a
frequency distribution
• Measure of dispersion
Cont...
2) Inferential Statestics
• Inferential Statistics are numerical values that enable
the researcher to draw conclusion about a
population based on the characteristics of a
population sample.
• The two main types of inferential statestics are
Nonparametric and Paramrtric.
cont..
• Examples of nonparametric tests includethe Chi
square test, the Cochran Q test, the Fisher exact test
• Examples of parametric test include the test, 1-way
analysis of variance (ANOVA), repeated-measures
ANOVA, Person correlation, simple linear and
nonlinear regression, and multivariate linear and
nonlinear regressions.
• The analysis of data in qualitative research is the
most challenging exercise.
• The basis of analysis of qualitative data lies in
coading and thematic analysis.
• Thematic analysis is most commonly used method.
• In thematic method data is carefully looked at and
common issued that recur are identified.
• This leads to identification of main thems that
summerize all the views that have been
colcted.
Step 1: Read The interview verbatim carefully.
Step 2: Decide the codes and themes thhat are covered in
data
Step 3: Mark the quotations (Paragraphs, lines or words)
Step 4: Assign the codes.
Step 5: Make a list of items uner one theme from across the
interviews
Step 6: Check the relationships between rhems
Step 7: Interprit the patterns
Step 8: Mention the quotes in reports.

More Related Content

What's hot

Sleep pattern and its disturbances
Sleep pattern and its disturbancesSleep pattern and its disturbances
Sleep pattern and its disturbances
SupriyaSingh101
 
Project method
Project methodProject method
Project method
Santosh Kumari
 
Essay type questions, By Pooja Godiyal
Essay type questions, By Pooja GodiyalEssay type questions, By Pooja Godiyal
Essay type questions, By Pooja Godiyal
Pooja Godiyal
 
Introduction to Medical surgical nursing
Introduction to Medical surgical nursingIntroduction to Medical surgical nursing
Introduction to Medical surgical nursing
Anil patidar
 
Self instruction module
Self instruction module Self instruction module
Self instruction module
PriyankaPG3
 
Computer Assisted Learning
Computer Assisted LearningComputer Assisted Learning
Computer Assisted Learning
anam
 
Data collection methods in Nursing research
Data collection methods in Nursing researchData collection methods in Nursing research
Data collection methods in Nursing research
Deepa Ajithkumar
 
Objective Structured Practical/Clinical Examination
Objective Structured Practical/Clinical ExaminationObjective Structured Practical/Clinical Examination
Objective Structured Practical/Clinical Examination
Amit Newton
 
Geriatric Assessment , Assessment of Elderly
Geriatric Assessment , Assessment of Elderly Geriatric Assessment , Assessment of Elderly
Geriatric Assessment , Assessment of Elderly
Anant Layall
 
Geriatric nursing ppt
Geriatric nursing pptGeriatric nursing ppt
Geriatric nursing ppt
Vikas Ghadge
 
IMMOBILITY.pptx
IMMOBILITY.pptxIMMOBILITY.pptx
IMMOBILITY.pptx
Tamannabhattiya
 
Lesson plan on myocardial infarction
Lesson plan on myocardial infarctionLesson plan on myocardial infarction
Lesson plan on myocardial infarction
kalyan kumar
 
Self Directed Learning
Self Directed LearningSelf Directed Learning
Self Directed Learning
MAHESWARI JAIKUMAR
 
Course Plan and Unit Plan
Course Plan and Unit PlanCourse Plan and Unit Plan
Course Plan and Unit Plan
NursingSpark
 
Project method of teaching
Project method of teachingProject method of teaching
Project method of teaching
Srikutty Devu
 
Impair body alignment and mobility & nursing care
Impair body alignment  and mobility & nursing careImpair body alignment  and mobility & nursing care
Impair body alignment and mobility & nursing care
yashwant ramawat
 
Lecture Method in Nursing Education
Lecture Method in Nursing EducationLecture Method in Nursing Education
Lecture Method in Nursing Education
vaibhavpaul9
 
Note on Evaluation and Assessment in Nursing Education (Part - 01)
Note on Evaluation and Assessment in Nursing Education (Part - 01)Note on Evaluation and Assessment in Nursing Education (Part - 01)
Note on Evaluation and Assessment in Nursing Education (Part - 01)
Babitha Devu
 
Ppt on nhp panchitr a mam
Ppt on nhp panchitr a mamPpt on nhp panchitr a mam
Ppt on nhp panchitr a mam
Viki Patidar
 

What's hot (20)

Sleep pattern and its disturbances
Sleep pattern and its disturbancesSleep pattern and its disturbances
Sleep pattern and its disturbances
 
Project method
Project methodProject method
Project method
 
Essay type questions, By Pooja Godiyal
Essay type questions, By Pooja GodiyalEssay type questions, By Pooja Godiyal
Essay type questions, By Pooja Godiyal
 
Introduction to Medical surgical nursing
Introduction to Medical surgical nursingIntroduction to Medical surgical nursing
Introduction to Medical surgical nursing
 
Self instruction module
Self instruction module Self instruction module
Self instruction module
 
Computer Assisted Learning
Computer Assisted LearningComputer Assisted Learning
Computer Assisted Learning
 
Data collection methods in Nursing research
Data collection methods in Nursing researchData collection methods in Nursing research
Data collection methods in Nursing research
 
Objective Structured Practical/Clinical Examination
Objective Structured Practical/Clinical ExaminationObjective Structured Practical/Clinical Examination
Objective Structured Practical/Clinical Examination
 
Geriatric Assessment , Assessment of Elderly
Geriatric Assessment , Assessment of Elderly Geriatric Assessment , Assessment of Elderly
Geriatric Assessment , Assessment of Elderly
 
Geriatric nursing ppt
Geriatric nursing pptGeriatric nursing ppt
Geriatric nursing ppt
 
IMMOBILITY.pptx
IMMOBILITY.pptxIMMOBILITY.pptx
IMMOBILITY.pptx
 
Sleep pattern disturbance copy
Sleep pattern disturbance   copySleep pattern disturbance   copy
Sleep pattern disturbance copy
 
Lesson plan on myocardial infarction
Lesson plan on myocardial infarctionLesson plan on myocardial infarction
Lesson plan on myocardial infarction
 
Self Directed Learning
Self Directed LearningSelf Directed Learning
Self Directed Learning
 
Course Plan and Unit Plan
Course Plan and Unit PlanCourse Plan and Unit Plan
Course Plan and Unit Plan
 
Project method of teaching
Project method of teachingProject method of teaching
Project method of teaching
 
Impair body alignment and mobility & nursing care
Impair body alignment  and mobility & nursing careImpair body alignment  and mobility & nursing care
Impair body alignment and mobility & nursing care
 
Lecture Method in Nursing Education
Lecture Method in Nursing EducationLecture Method in Nursing Education
Lecture Method in Nursing Education
 
Note on Evaluation and Assessment in Nursing Education (Part - 01)
Note on Evaluation and Assessment in Nursing Education (Part - 01)Note on Evaluation and Assessment in Nursing Education (Part - 01)
Note on Evaluation and Assessment in Nursing Education (Part - 01)
 
Ppt on nhp panchitr a mam
Ppt on nhp panchitr a mamPpt on nhp panchitr a mam
Ppt on nhp panchitr a mam
 

Similar to Introduction to Data Analysis for Nurse Researchers

lecture-8.pdf
lecture-8.pdflecture-8.pdf
lecture-8.pdf
lavanya209529
 
5.Measurement and scaling technique.pptx
5.Measurement and scaling technique.pptx5.Measurement and scaling technique.pptx
5.Measurement and scaling technique.pptx
HimaniPandya13
 
Lecture 1- data preparation.pptx
Lecture 1- data preparation.pptxLecture 1- data preparation.pptx
Lecture 1- data preparation.pptx
EricRajat
 
Chapter 11 Data Analysis Classification and Tabulation
Chapter 11 Data Analysis Classification and TabulationChapter 11 Data Analysis Classification and Tabulation
Chapter 11 Data Analysis Classification and Tabulation
International advisers
 
ANALYSIS OF DATA.pptx
ANALYSIS OF DATA.pptxANALYSIS OF DATA.pptx
ANALYSIS OF DATA.pptx
PRADEEP ABOTHU
 
Data processing.pdf
Data processing.pdfData processing.pdf
Data processing.pdf
MuthuLakshmi124949
 
Statistics.pptx
Statistics.pptxStatistics.pptx
Statistics.pptx
lavanya209529
 
Data analysis plan in medicine and nurse.pptx
Data analysis plan in medicine and nurse.pptxData analysis plan in medicine and nurse.pptx
Data analysis plan in medicine and nurse.pptx
Juma675663
 
Research and Data Analysi-1.pptx
Research and Data Analysi-1.pptxResearch and Data Analysi-1.pptx
Research and Data Analysi-1.pptx
MaryamManzoor25
 
ANALYSIS OF DATA.pptx
ANALYSIS OF DATA.pptxANALYSIS OF DATA.pptx
ANALYSIS OF DATA.pptx
Fankstien Tayeng
 
ANALYSIS OF DATA (2).pptx
ANALYSIS OF DATA (2).pptxANALYSIS OF DATA (2).pptx
ANALYSIS OF DATA (2).pptx
UtkarshKumar608655
 
Unit 4 editing and coding (2)
Unit 4 editing and coding (2)Unit 4 editing and coding (2)
Unit 4 editing and coding (2)
kalailakshmi
 
Data-Scores
Data-ScoresData-Scores
Data Collection Preparation
Data Collection PreparationData Collection Preparation
Data Collection Preparation
Business Student
 
Topic interpretation of data and its analysis
Topic   interpretation of data and its analysisTopic   interpretation of data and its analysis
Topic interpretation of data and its analysis
KmTriptiSingh
 
DATA PROCESSING on marketing research...
DATA PROCESSING on marketing research...DATA PROCESSING on marketing research...
DATA PROCESSING on marketing research...
120SupritBhuyan
 
1. Data Process.pptx
1. Data Process.pptx1. Data Process.pptx
1. Data Process.pptx
jeyanthisivakumar
 
Chapter 6.pptx Data Analysis and processing
Chapter 6.pptx Data Analysis and processingChapter 6.pptx Data Analysis and processing
Chapter 6.pptx Data Analysis and processing
etebarkhmichale
 
e3_chapter__5_evaluation_technics_HCeVpPLCvE.ppt
e3_chapter__5_evaluation_technics_HCeVpPLCvE.ppte3_chapter__5_evaluation_technics_HCeVpPLCvE.ppt
e3_chapter__5_evaluation_technics_HCeVpPLCvE.ppt
appstore15
 

Similar to Introduction to Data Analysis for Nurse Researchers (20)

lecture-8.pdf
lecture-8.pdflecture-8.pdf
lecture-8.pdf
 
5.Measurement and scaling technique.pptx
5.Measurement and scaling technique.pptx5.Measurement and scaling technique.pptx
5.Measurement and scaling technique.pptx
 
Lecture 1- data preparation.pptx
Lecture 1- data preparation.pptxLecture 1- data preparation.pptx
Lecture 1- data preparation.pptx
 
Chapter 11 Data Analysis Classification and Tabulation
Chapter 11 Data Analysis Classification and TabulationChapter 11 Data Analysis Classification and Tabulation
Chapter 11 Data Analysis Classification and Tabulation
 
ANALYSIS OF DATA.pptx
ANALYSIS OF DATA.pptxANALYSIS OF DATA.pptx
ANALYSIS OF DATA.pptx
 
Data processing.pdf
Data processing.pdfData processing.pdf
Data processing.pdf
 
Statistics.pptx
Statistics.pptxStatistics.pptx
Statistics.pptx
 
Data analysis plan in medicine and nurse.pptx
Data analysis plan in medicine and nurse.pptxData analysis plan in medicine and nurse.pptx
Data analysis plan in medicine and nurse.pptx
 
Research and Data Analysi-1.pptx
Research and Data Analysi-1.pptxResearch and Data Analysi-1.pptx
Research and Data Analysi-1.pptx
 
ANALYSIS OF DATA.pptx
ANALYSIS OF DATA.pptxANALYSIS OF DATA.pptx
ANALYSIS OF DATA.pptx
 
ANALYSIS OF DATA (2).pptx
ANALYSIS OF DATA (2).pptxANALYSIS OF DATA (2).pptx
ANALYSIS OF DATA (2).pptx
 
Unit 4 editing and coding (2)
Unit 4 editing and coding (2)Unit 4 editing and coding (2)
Unit 4 editing and coding (2)
 
Data-Scores
Data-ScoresData-Scores
Data-Scores
 
Data & Scores
Data & ScoresData & Scores
Data & Scores
 
Data Collection Preparation
Data Collection PreparationData Collection Preparation
Data Collection Preparation
 
Topic interpretation of data and its analysis
Topic   interpretation of data and its analysisTopic   interpretation of data and its analysis
Topic interpretation of data and its analysis
 
DATA PROCESSING on marketing research...
DATA PROCESSING on marketing research...DATA PROCESSING on marketing research...
DATA PROCESSING on marketing research...
 
1. Data Process.pptx
1. Data Process.pptx1. Data Process.pptx
1. Data Process.pptx
 
Chapter 6.pptx Data Analysis and processing
Chapter 6.pptx Data Analysis and processingChapter 6.pptx Data Analysis and processing
Chapter 6.pptx Data Analysis and processing
 
e3_chapter__5_evaluation_technics_HCeVpPLCvE.ppt
e3_chapter__5_evaluation_technics_HCeVpPLCvE.ppte3_chapter__5_evaluation_technics_HCeVpPLCvE.ppt
e3_chapter__5_evaluation_technics_HCeVpPLCvE.ppt
 

Recently uploaded

New Drug Discovery and Development .....
New Drug Discovery and Development .....New Drug Discovery and Development .....
New Drug Discovery and Development .....
NEHA GUPTA
 
Pulmonary Thromboembolism - etilogy, types, medical- Surgical and nursing man...
Pulmonary Thromboembolism - etilogy, types, medical- Surgical and nursing man...Pulmonary Thromboembolism - etilogy, types, medical- Surgical and nursing man...
Pulmonary Thromboembolism - etilogy, types, medical- Surgical and nursing man...
VarunMahajani
 
micro teaching on communication m.sc nursing.pdf
micro teaching on communication m.sc nursing.pdfmicro teaching on communication m.sc nursing.pdf
micro teaching on communication m.sc nursing.pdf
Anurag Sharma
 
Are There Any Natural Remedies To Treat Syphilis.pdf
Are There Any Natural Remedies To Treat Syphilis.pdfAre There Any Natural Remedies To Treat Syphilis.pdf
Are There Any Natural Remedies To Treat Syphilis.pdf
Little Cross Family Clinic
 
Evaluation of antidepressant activity of clitoris ternatea in animals
Evaluation of antidepressant activity of clitoris ternatea in animalsEvaluation of antidepressant activity of clitoris ternatea in animals
Evaluation of antidepressant activity of clitoris ternatea in animals
Shweta
 
Charaka Samhita Sutra sthana Chapter 15 Upakalpaniyaadhyaya
Charaka Samhita Sutra sthana Chapter 15 UpakalpaniyaadhyayaCharaka Samhita Sutra sthana Chapter 15 Upakalpaniyaadhyaya
Charaka Samhita Sutra sthana Chapter 15 Upakalpaniyaadhyaya
Dr KHALID B.M
 
Physiology of Chemical Sensation of smell.pdf
Physiology of Chemical Sensation of smell.pdfPhysiology of Chemical Sensation of smell.pdf
Physiology of Chemical Sensation of smell.pdf
MedicoseAcademics
 
For Better Surat #ℂall #Girl Service ❤85270-49040❤ Surat #ℂall #Girls
For Better Surat #ℂall #Girl Service ❤85270-49040❤ Surat #ℂall #GirlsFor Better Surat #ℂall #Girl Service ❤85270-49040❤ Surat #ℂall #Girls
For Better Surat #ℂall #Girl Service ❤85270-49040❤ Surat #ℂall #Girls
Savita Shen $i11
 
New Directions in Targeted Therapeutic Approaches for Older Adults With Mantl...
New Directions in Targeted Therapeutic Approaches for Older Adults With Mantl...New Directions in Targeted Therapeutic Approaches for Older Adults With Mantl...
New Directions in Targeted Therapeutic Approaches for Older Adults With Mantl...
i3 Health
 
24 Upakrama.pptx class ppt useful in all
24 Upakrama.pptx class ppt useful in all24 Upakrama.pptx class ppt useful in all
24 Upakrama.pptx class ppt useful in all
DrSathishMS1
 
ARTHROLOGY PPT NCISM SYLLABUS AYURVEDA STUDENTS
ARTHROLOGY PPT NCISM SYLLABUS AYURVEDA STUDENTSARTHROLOGY PPT NCISM SYLLABUS AYURVEDA STUDENTS
ARTHROLOGY PPT NCISM SYLLABUS AYURVEDA STUDENTS
Dr. Vinay Pareek
 
Ozempic: Preoperative Management of Patients on GLP-1 Receptor Agonists
Ozempic: Preoperative Management of Patients on GLP-1 Receptor Agonists  Ozempic: Preoperative Management of Patients on GLP-1 Receptor Agonists
Ozempic: Preoperative Management of Patients on GLP-1 Receptor Agonists
Saeid Safari
 
Ophthalmology Clinical Tests for OSCE exam
Ophthalmology Clinical Tests for OSCE examOphthalmology Clinical Tests for OSCE exam
Ophthalmology Clinical Tests for OSCE exam
KafrELShiekh University
 
The Normal Electrocardiogram - Part I of II
The Normal Electrocardiogram - Part I of IIThe Normal Electrocardiogram - Part I of II
The Normal Electrocardiogram - Part I of II
MedicoseAcademics
 
Prix Galien International 2024 Forum Program
Prix Galien International 2024 Forum ProgramPrix Galien International 2024 Forum Program
Prix Galien International 2024 Forum Program
Levi Shapiro
 
KDIGO 2024 guidelines for diabetologists
KDIGO 2024 guidelines for diabetologistsKDIGO 2024 guidelines for diabetologists
KDIGO 2024 guidelines for diabetologists
د.محمود نجيب
 
TEST BANK for Operations Management, 14th Edition by William J. Stevenson, Ve...
TEST BANK for Operations Management, 14th Edition by William J. Stevenson, Ve...TEST BANK for Operations Management, 14th Edition by William J. Stevenson, Ve...
TEST BANK for Operations Management, 14th Edition by William J. Stevenson, Ve...
kevinkariuki227
 
basicmodesofventilation2022-220313203758.pdf
basicmodesofventilation2022-220313203758.pdfbasicmodesofventilation2022-220313203758.pdf
basicmodesofventilation2022-220313203758.pdf
aljamhori teaching hospital
 
Phone Us ❤85270-49040❤ #ℂall #gIRLS In Surat By Surat @ℂall @Girls Hotel With...
Phone Us ❤85270-49040❤ #ℂall #gIRLS In Surat By Surat @ℂall @Girls Hotel With...Phone Us ❤85270-49040❤ #ℂall #gIRLS In Surat By Surat @ℂall @Girls Hotel With...
Phone Us ❤85270-49040❤ #ℂall #gIRLS In Surat By Surat @ℂall @Girls Hotel With...
Savita Shen $i11
 
Ocular injury ppt Upendra pal optometrist upums saifai etawah
Ocular injury  ppt  Upendra pal  optometrist upums saifai etawahOcular injury  ppt  Upendra pal  optometrist upums saifai etawah
Ocular injury ppt Upendra pal optometrist upums saifai etawah
pal078100
 

Recently uploaded (20)

New Drug Discovery and Development .....
New Drug Discovery and Development .....New Drug Discovery and Development .....
New Drug Discovery and Development .....
 
Pulmonary Thromboembolism - etilogy, types, medical- Surgical and nursing man...
Pulmonary Thromboembolism - etilogy, types, medical- Surgical and nursing man...Pulmonary Thromboembolism - etilogy, types, medical- Surgical and nursing man...
Pulmonary Thromboembolism - etilogy, types, medical- Surgical and nursing man...
 
micro teaching on communication m.sc nursing.pdf
micro teaching on communication m.sc nursing.pdfmicro teaching on communication m.sc nursing.pdf
micro teaching on communication m.sc nursing.pdf
 
Are There Any Natural Remedies To Treat Syphilis.pdf
Are There Any Natural Remedies To Treat Syphilis.pdfAre There Any Natural Remedies To Treat Syphilis.pdf
Are There Any Natural Remedies To Treat Syphilis.pdf
 
Evaluation of antidepressant activity of clitoris ternatea in animals
Evaluation of antidepressant activity of clitoris ternatea in animalsEvaluation of antidepressant activity of clitoris ternatea in animals
Evaluation of antidepressant activity of clitoris ternatea in animals
 
Charaka Samhita Sutra sthana Chapter 15 Upakalpaniyaadhyaya
Charaka Samhita Sutra sthana Chapter 15 UpakalpaniyaadhyayaCharaka Samhita Sutra sthana Chapter 15 Upakalpaniyaadhyaya
Charaka Samhita Sutra sthana Chapter 15 Upakalpaniyaadhyaya
 
Physiology of Chemical Sensation of smell.pdf
Physiology of Chemical Sensation of smell.pdfPhysiology of Chemical Sensation of smell.pdf
Physiology of Chemical Sensation of smell.pdf
 
For Better Surat #ℂall #Girl Service ❤85270-49040❤ Surat #ℂall #Girls
For Better Surat #ℂall #Girl Service ❤85270-49040❤ Surat #ℂall #GirlsFor Better Surat #ℂall #Girl Service ❤85270-49040❤ Surat #ℂall #Girls
For Better Surat #ℂall #Girl Service ❤85270-49040❤ Surat #ℂall #Girls
 
New Directions in Targeted Therapeutic Approaches for Older Adults With Mantl...
New Directions in Targeted Therapeutic Approaches for Older Adults With Mantl...New Directions in Targeted Therapeutic Approaches for Older Adults With Mantl...
New Directions in Targeted Therapeutic Approaches for Older Adults With Mantl...
 
24 Upakrama.pptx class ppt useful in all
24 Upakrama.pptx class ppt useful in all24 Upakrama.pptx class ppt useful in all
24 Upakrama.pptx class ppt useful in all
 
ARTHROLOGY PPT NCISM SYLLABUS AYURVEDA STUDENTS
ARTHROLOGY PPT NCISM SYLLABUS AYURVEDA STUDENTSARTHROLOGY PPT NCISM SYLLABUS AYURVEDA STUDENTS
ARTHROLOGY PPT NCISM SYLLABUS AYURVEDA STUDENTS
 
Ozempic: Preoperative Management of Patients on GLP-1 Receptor Agonists
Ozempic: Preoperative Management of Patients on GLP-1 Receptor Agonists  Ozempic: Preoperative Management of Patients on GLP-1 Receptor Agonists
Ozempic: Preoperative Management of Patients on GLP-1 Receptor Agonists
 
Ophthalmology Clinical Tests for OSCE exam
Ophthalmology Clinical Tests for OSCE examOphthalmology Clinical Tests for OSCE exam
Ophthalmology Clinical Tests for OSCE exam
 
The Normal Electrocardiogram - Part I of II
The Normal Electrocardiogram - Part I of IIThe Normal Electrocardiogram - Part I of II
The Normal Electrocardiogram - Part I of II
 
Prix Galien International 2024 Forum Program
Prix Galien International 2024 Forum ProgramPrix Galien International 2024 Forum Program
Prix Galien International 2024 Forum Program
 
KDIGO 2024 guidelines for diabetologists
KDIGO 2024 guidelines for diabetologistsKDIGO 2024 guidelines for diabetologists
KDIGO 2024 guidelines for diabetologists
 
TEST BANK for Operations Management, 14th Edition by William J. Stevenson, Ve...
TEST BANK for Operations Management, 14th Edition by William J. Stevenson, Ve...TEST BANK for Operations Management, 14th Edition by William J. Stevenson, Ve...
TEST BANK for Operations Management, 14th Edition by William J. Stevenson, Ve...
 
basicmodesofventilation2022-220313203758.pdf
basicmodesofventilation2022-220313203758.pdfbasicmodesofventilation2022-220313203758.pdf
basicmodesofventilation2022-220313203758.pdf
 
Phone Us ❤85270-49040❤ #ℂall #gIRLS In Surat By Surat @ℂall @Girls Hotel With...
Phone Us ❤85270-49040❤ #ℂall #gIRLS In Surat By Surat @ℂall @Girls Hotel With...Phone Us ❤85270-49040❤ #ℂall #gIRLS In Surat By Surat @ℂall @Girls Hotel With...
Phone Us ❤85270-49040❤ #ℂall #gIRLS In Surat By Surat @ℂall @Girls Hotel With...
 
Ocular injury ppt Upendra pal optometrist upums saifai etawah
Ocular injury  ppt  Upendra pal  optometrist upums saifai etawahOcular injury  ppt  Upendra pal  optometrist upums saifai etawah
Ocular injury ppt Upendra pal optometrist upums saifai etawah
 

Introduction to Data Analysis for Nurse Researchers

  • 1. Prof. Rupa Varma Principal, MKSSS, Sitabai Nargundkar College of Nursing For Women, Nagpur Introduction to Data Analysis
  • 2. • We nurses during period of our study, learn best method of nursing process • After graduation, we go through, research papers presented at conferences and in current journals to know new methods for nursing practices • Training in statistics has been recognized as indispensible for students • If we want to establish cause and effect relationship, we need statistics • If we want to measure state of health and also burden of disease in community, we need statistics.
  • 3. • Data can be defined as a systematic record. • It is the different values of that quantity represented together in a set. • It is a collection of facts and figures to be used for a specific purpose such as a survey or analysis. • When arranged in an organized form, can be called information.
  • 4. Analysis- • Analysis is the process of organizing and synthesizing the data so as to answer reserch questions and hypothesis. • Analysis is the process of breaking a complex topic into smaller parts to gain better understanding of it.
  • 5. • Almost end of the ladder of research process. • After collection of data we enter into exciting phase of research process- Analysis, Presentation and interpretation. • Data analysis is the reduction and organization of a body of data to produce results that can be interpreted by the researcher; • A variety of quantitative and qualitative metods may be used, depending upon the nature of the data to be analyzed and the design of the study.
  • 6. • Data analysis is the most complex and mysterious of all of the phases of a qualitative project, and the one that receives the least thoughtful discussion in the literature • Data after collection has to be processed and analyzed in accordance with the outline down for the purpose at the time of developing research plan. • In process of analysis, relationships or differences supporting or conflicting with hypotheses are subjected to statistical tests of significance, to conclude the study.
  • 7. • Research consists of two larger steps 1) Gathering the data 2) Analysis of gathered data • But, no amount of analysis can validly extract from the data factors which are not present.
  • 8. Types of data: Qualitative & Quantitative Data Qualitative Quantitative It was great fun Discrete-5….. Continuous 3.345
  • 9. 1) Qualitative Data: • They represent some characteristics or attributes. • They depict descriptions that may be observed but cannot be computed or calculated. • For example, data on attributes such as intelligence, honesty, wisdom, cleanliness, and creativity collected using the students of your class a sample would be classified as qualitative. • They are more exploratory than conclusive in nature.
  • 10. 2) Quantitative Data: • These can be measured and not simply observed. • They can be numerically represented and calculations can be performed on them. • For example, data on the number of students playing different sports from your class gives an estimate of how many of the total students play which sport. • This information is numerical and can be classified as quantitative.
  • 11.
  • 12. • It is intermediary stage between data collection and data interpretation. • Steps  Identifying or compiling data structures  Editing the data Coding Organizing the Data Classifying the data Analyzing the data Tabulation of data
  • 13. • The collected data may be adequate, valid and reliable to any extent, it does not serve any worthwhile purpose unless it is carefully edited, systematically analyzed, intelligently interpreted and rationally concluded.
  • 14. • It means putting together or composing the collected data. • It includes arranging all the collected data in a sequence. • In orderly and organized manner.
  • 15. • Monitor the data for quality and comprehensiveness. • Each piece of data should be checked for accuracy and completeness.
  • 16. • Coding is translating answers into numerical value. • Assigning numbers to various categories of a variable that can be entered into database in a form which can be analyzed easily. • Coding of all the forms should be done on daily basis in order to manage the work. • In case of open ended question, it is to be placed in various categories and each category is assigned a code. • Coding of open ended question require lot of efforts from researcher.
  • 17. a. Selecting software package b. Entering the data c. Cleaning the data/ managing missing value
  • 18. a) Selecting a software package: • Except in small studies, the researchers always make use of computer for analysis of data. • SPSS (Statistical Package for social Sciences) is prefferred by majority of the researchers. b) Entering the Data: • The Data can be entered directly from the questionnaires. • It is always good to have two persons entering the data to prevent errors and mistakes.
  • 19. c) Data Cleaning and managing the missing value: • After completing whole data entry, the reseaecher must take out the print of that file. • Checking the data for error is called cleaning. • If any respondant may not have given an answer for a question. • Some data analysis programs have a mechanism for handling missing values, giving them a code or not using that case in the data analysis.
  • 20. • The calssification of data implies that the collected raw data is categorized into common groups having common features. • It can be according to the numerical characteristics or according to attributes. • The Numeical characteristics are classified on the basis of class intervals. • As per attributes, the data is classified on the basis of common characteristics like literacy, sex, marital status, etc.
  • 21. • First the discriptive statistics is employed to obtain the frequencies of discriptive variables. • This is followed by application of inferential statestics to test the hypothesis, research question or objectives.
  • 22. • Tabulation is the orderly arrangement of data in rows and columns. • It conserves space. • It facilitates rocess of comparison and summerization. • It also facilitates detection of errors and ommissions and establishes the basis of various statestical computation.
  • 23. Computing the data Editing the data Coding the data Selecting the software Entering the data Data cleaning and managing the missing valve Classification of data Analysis of data-descriptive & inferential statistical tests Tabulation of data
  • 24. • Quantitative data analysis is the process of using statistical meyhods to describe, summerize and campare the data. • It provides quantifiable and easy to understand results. • First it is importantto identify level of measurement associated with quantitative data.
  • 25. • It is very important to understand the scales or levels of measurements before learning about the analysis of data. • There are four levels of measurements: 1. Nominal Measurement 2. Ordilnal Measurement 3. Interval Measurement 4. Ratio Measurement
  • 26.
  • 27. Nominal Measurement Ordilnal Measurement Interval Measurement Ratio Measurement Qualitative measures- Calssify into nonnumeric Catagogies Quantitative measures- Measurement is numerical
  • 28. The Nominal scale, sometimes called qualitative type, that differentiate between Items or subjects only on the basis of their names or categories or qualities Examples Include Gender, nationality, language, style, Marital status, student ID, state of residence.
  • 29. An ordinal scale not only classifies subject but also ranks them in terms of the degree to which they possess a characteristics of interest. An ordinal scale indicates relative position The order of ranking is iposed on categories Example: Health Staus A) Poor B) Fair C) Good D) Excellent
  • 30. There is specification of ranking of objects on an attribute of the distance between those objects. There is, more or less, equal numerical distance between intervals Example: Temperature A) 100- 800 B) 40o-500
  • 31. This is the highest level of measurement and has the properties of other three levels. Has absolute zero point. Examples: Biophysical Parameters a) Weight b) Height c) Volume d) Bood Presure
  • 32. • There are two specific types of quantitative data analysis methods- descriptive and inferential method. 1) Descriptive Statistics • Descriptive Statistics are used to summerize and describe data. • It constitute the frequency distribution of the data, measures of central tendancy and measures of dispersion.
  • 33. Classification of descriptive analysis 1) Frequency and percentage distribution 2) Measures of central tendacy • Mean • Median • Mode 3) Measures of dispers or variability • Range • Standard Deviation
  • 34. 1) Frequency and percentage distribution • It is the frequency of occurance of score or value in given set of data. • The scores or values may be systematically arrenged from highest to lowest or lowest to highest. • It is better to show percentage also along with each frequency score. Age (Yrs) Frequency (f) Percentage (%) 21 5 10 22 15 30 23 20 40 24 5 10 25 5 10 N = 50= ∑f ∑%= 100 Frequency distribution of patient's age
  • 35. 2) Measures of central tendacy MEAN • Add all the numbers then divided by the amount of numbers • 9,3,1,8,3,6(30 ÷ 6=5),mean is 5 MEDIAN • Order the set of numbers, the median is the middle number • 9,3,1,8,3,6(1,3,3,6,8,9) median is 4.5 MODE • The most common number • 9,3,1,8,3,6 mode is 3
  • 36. 3) Measures of dispers or variability a) Range The distance between the highest score and the lowest score in a distribution. When to use  Sample description is desired.  Variance or standard deviation Cannot be computed.  Have ordinal data.  Presenting your results to people with little .
  • 37. Cont... 2) Standard Deviation The most commonly used measure of variability that indicates the average to which the scores deviate from the mean. Uses • Biological studies • Fitting a normal curve to a frequency distribution • Measure of dispersion
  • 38. Cont... 2) Inferential Statestics • Inferential Statistics are numerical values that enable the researcher to draw conclusion about a population based on the characteristics of a population sample. • The two main types of inferential statestics are Nonparametric and Paramrtric.
  • 39.
  • 40. cont.. • Examples of nonparametric tests includethe Chi square test, the Cochran Q test, the Fisher exact test • Examples of parametric test include the test, 1-way analysis of variance (ANOVA), repeated-measures ANOVA, Person correlation, simple linear and nonlinear regression, and multivariate linear and nonlinear regressions.
  • 41. • The analysis of data in qualitative research is the most challenging exercise. • The basis of analysis of qualitative data lies in coading and thematic analysis. • Thematic analysis is most commonly used method. • In thematic method data is carefully looked at and common issued that recur are identified. • This leads to identification of main thems that summerize all the views that have been colcted.
  • 42. Step 1: Read The interview verbatim carefully. Step 2: Decide the codes and themes thhat are covered in data Step 3: Mark the quotations (Paragraphs, lines or words) Step 4: Assign the codes. Step 5: Make a list of items uner one theme from across the interviews Step 6: Check the relationships between rhems Step 7: Interprit the patterns Step 8: Mention the quotes in reports.