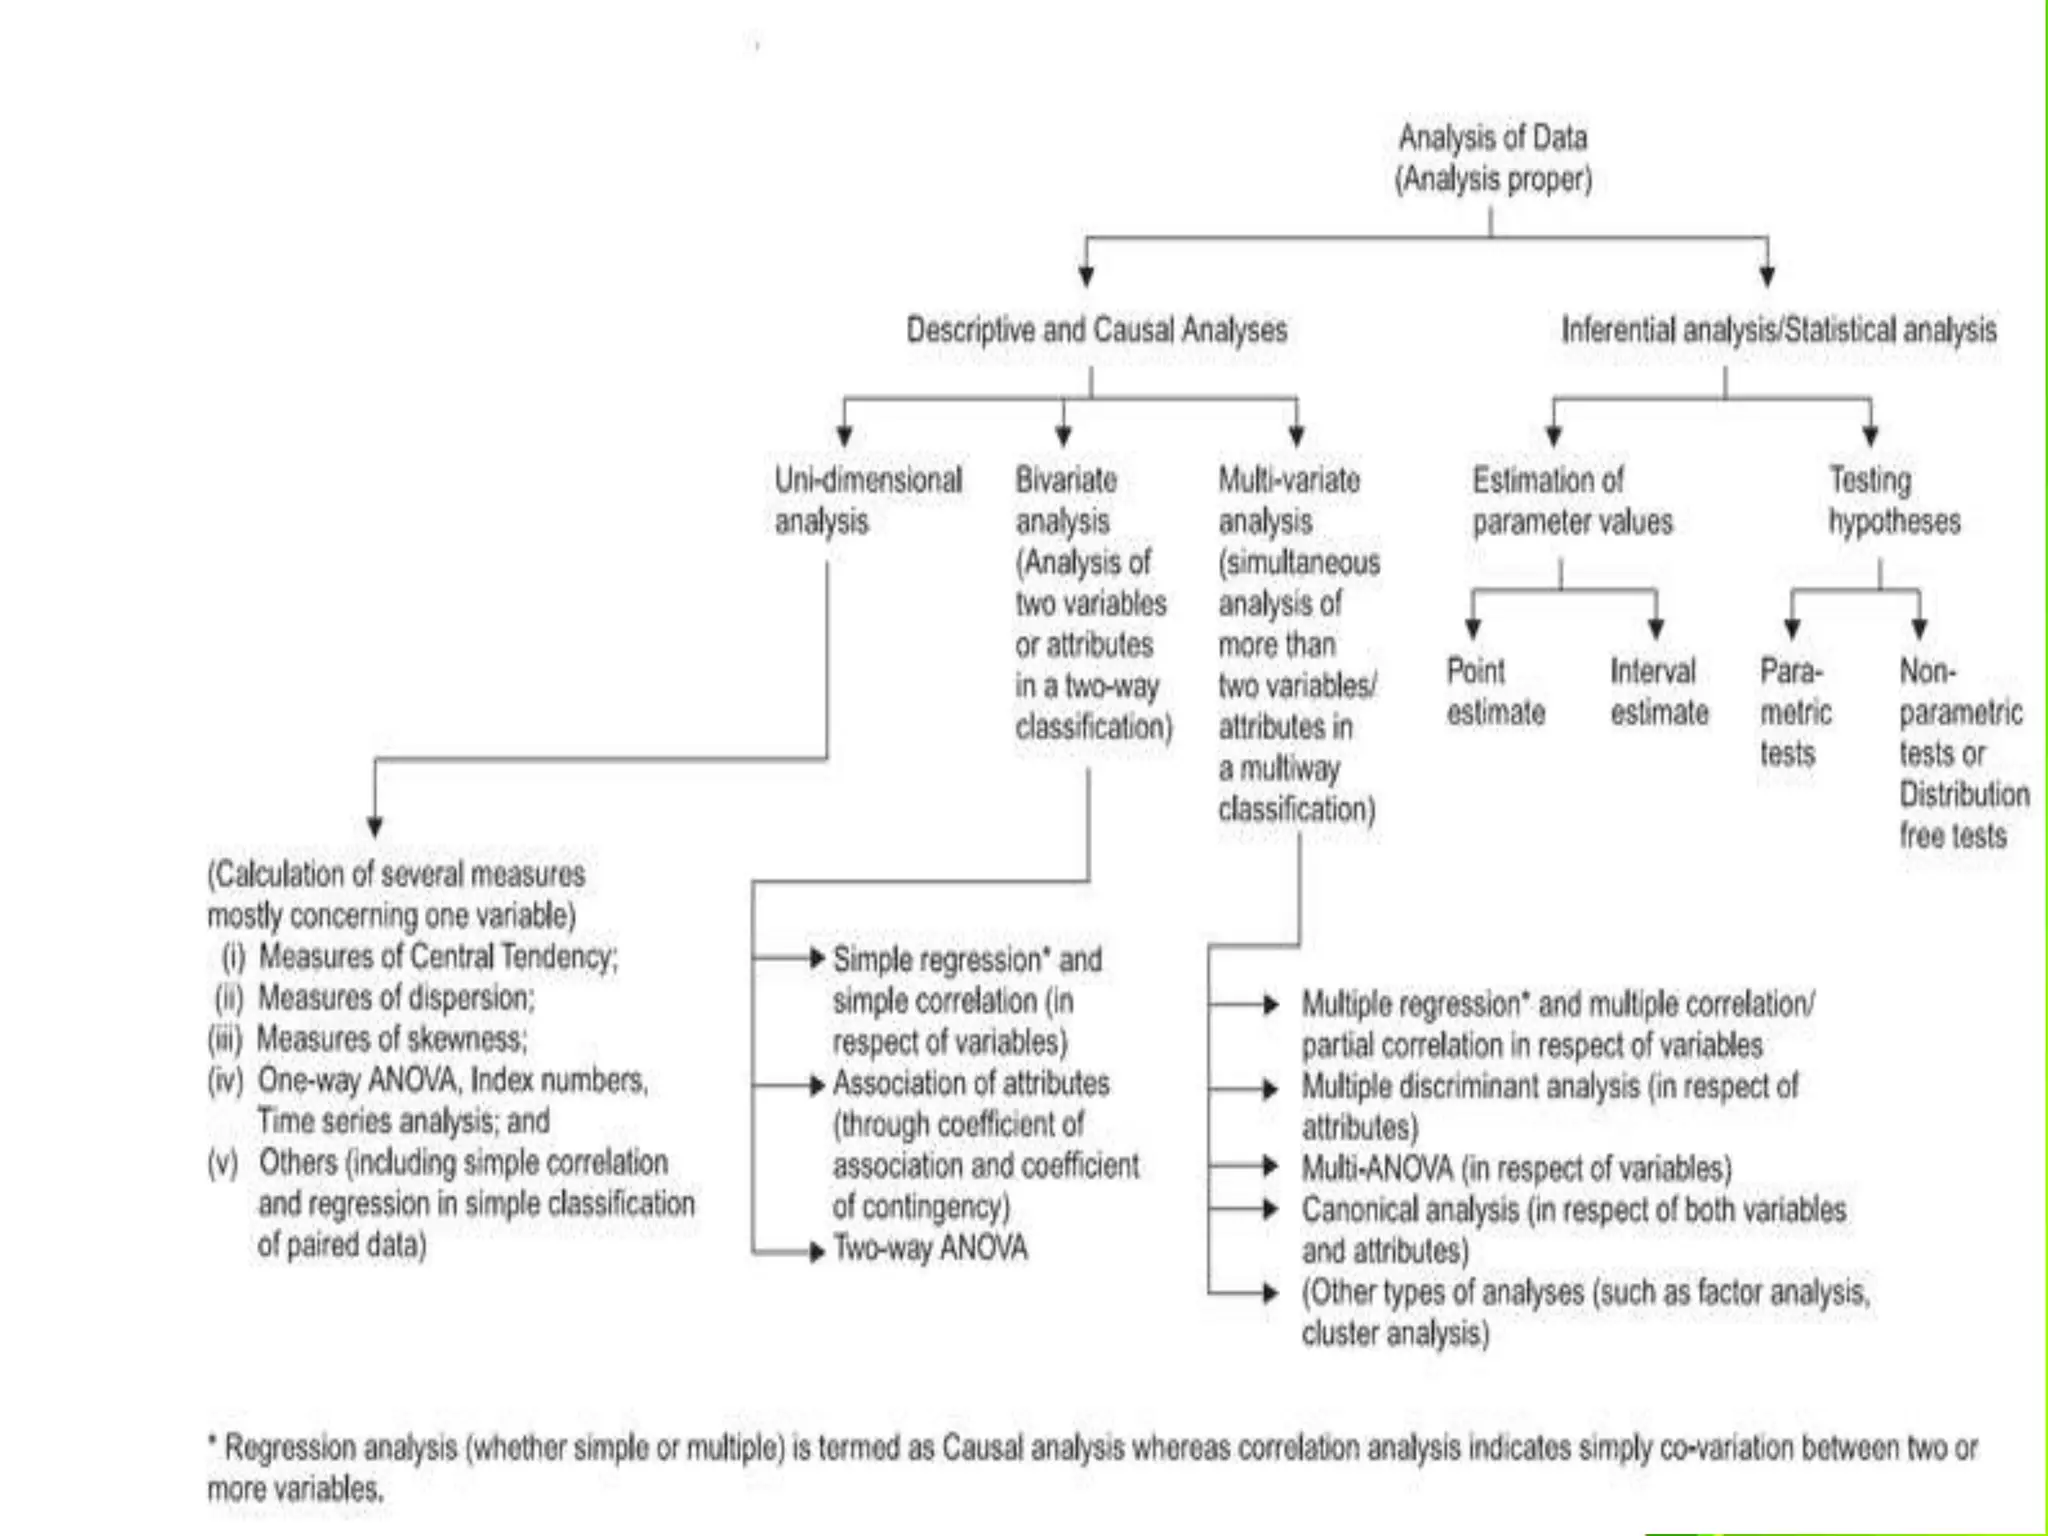
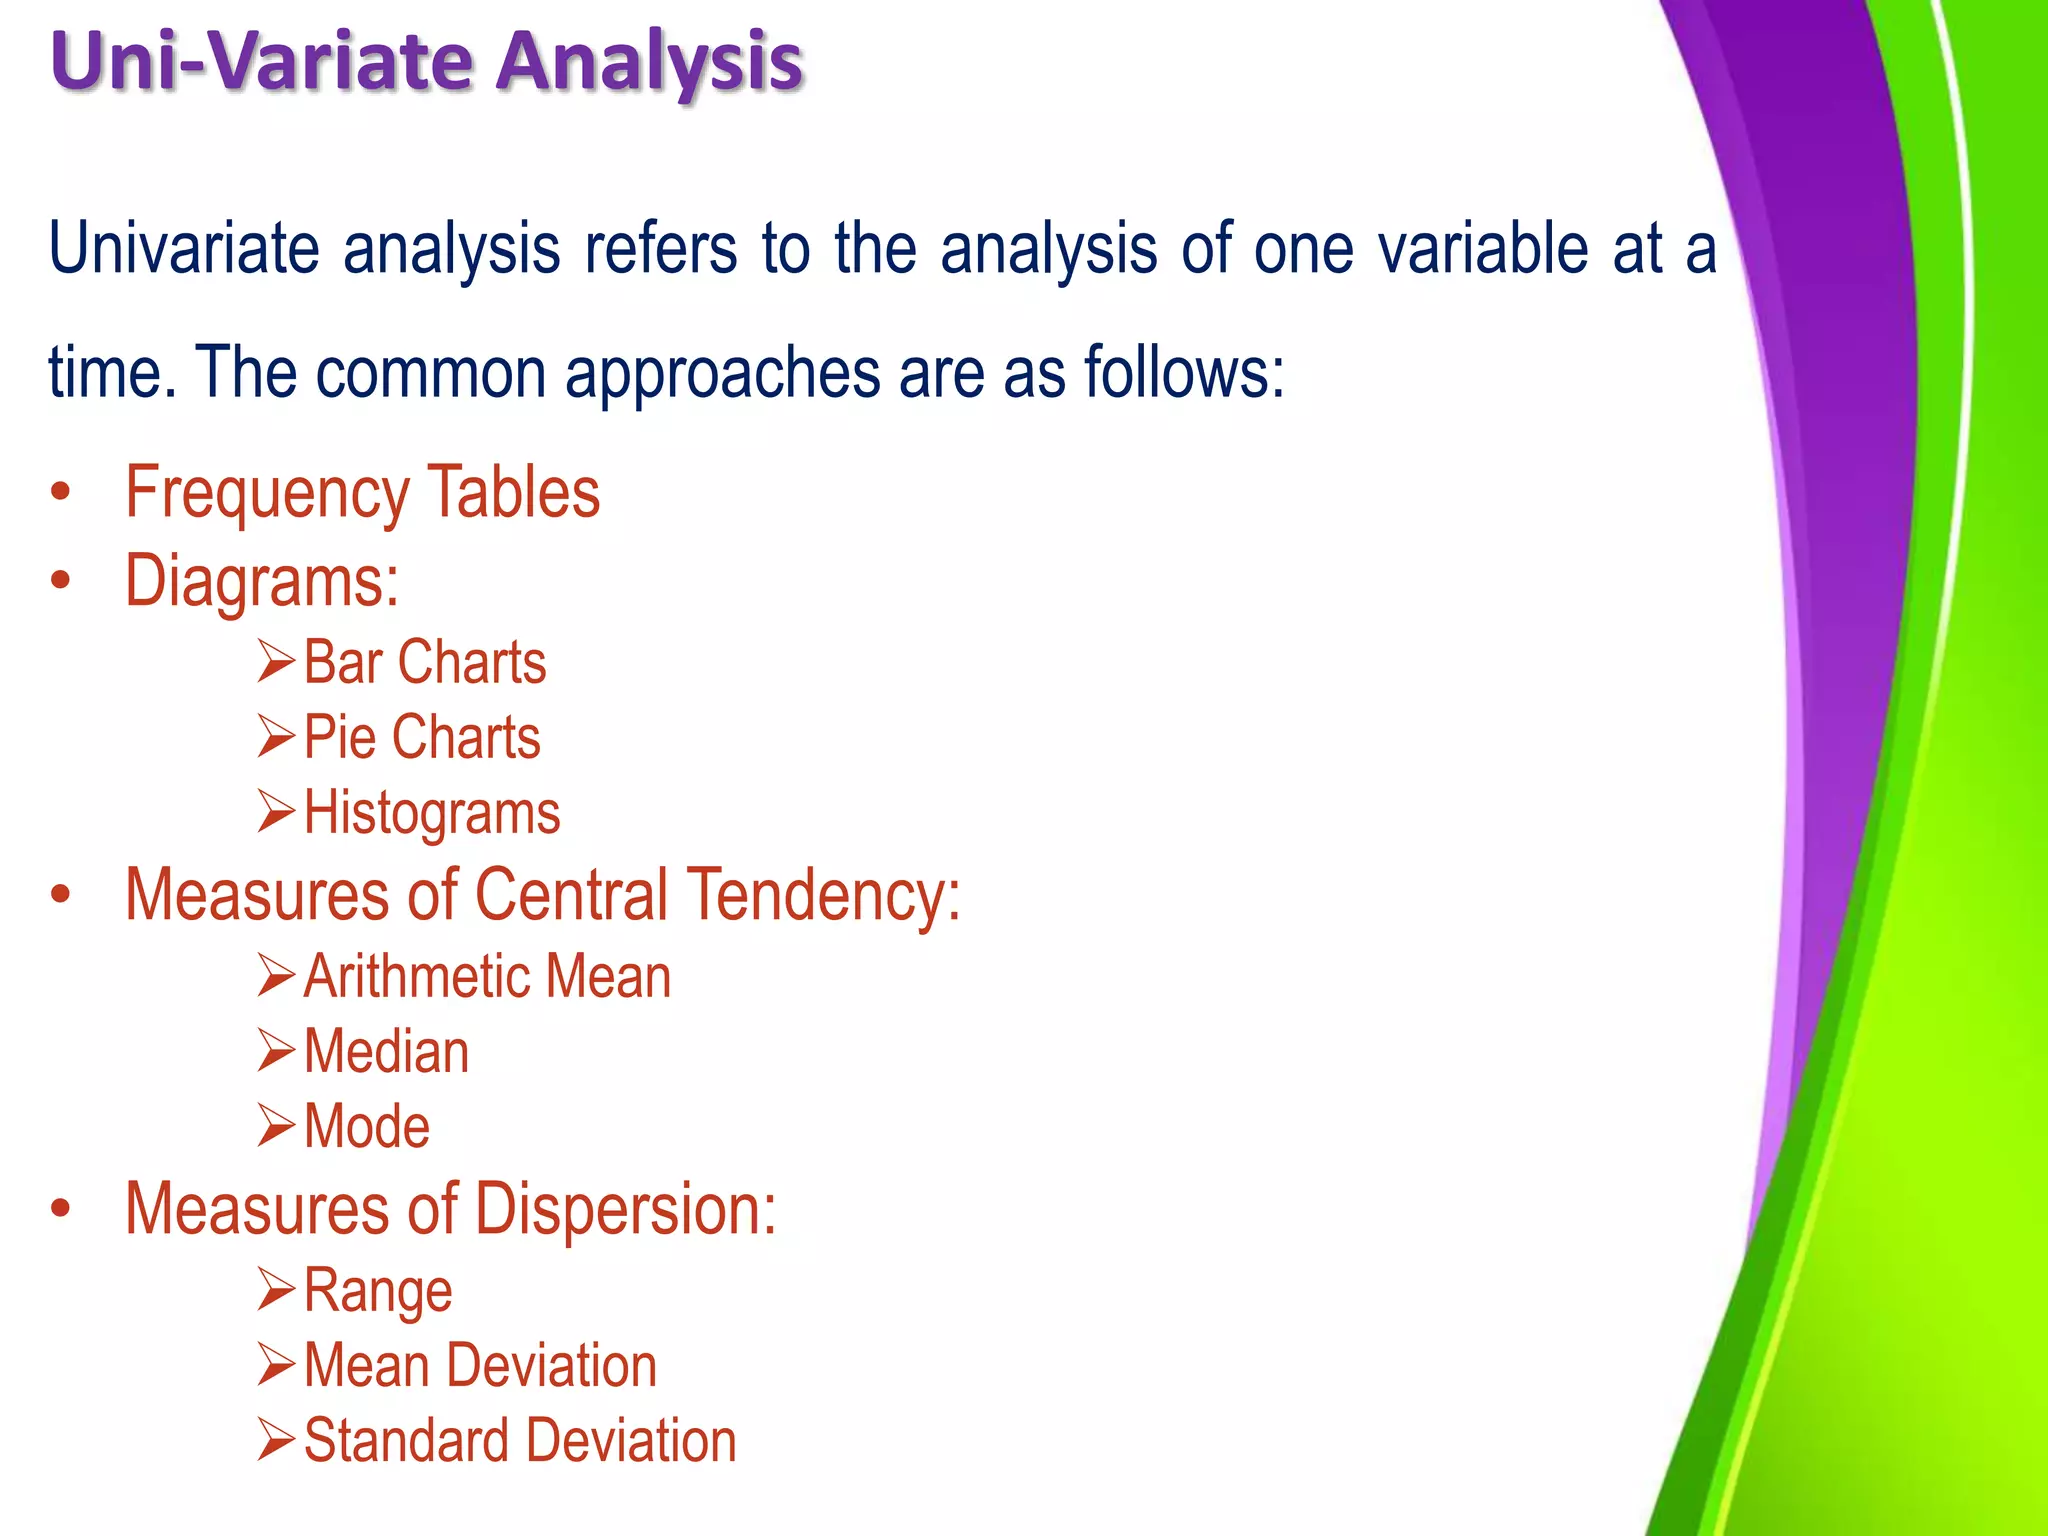
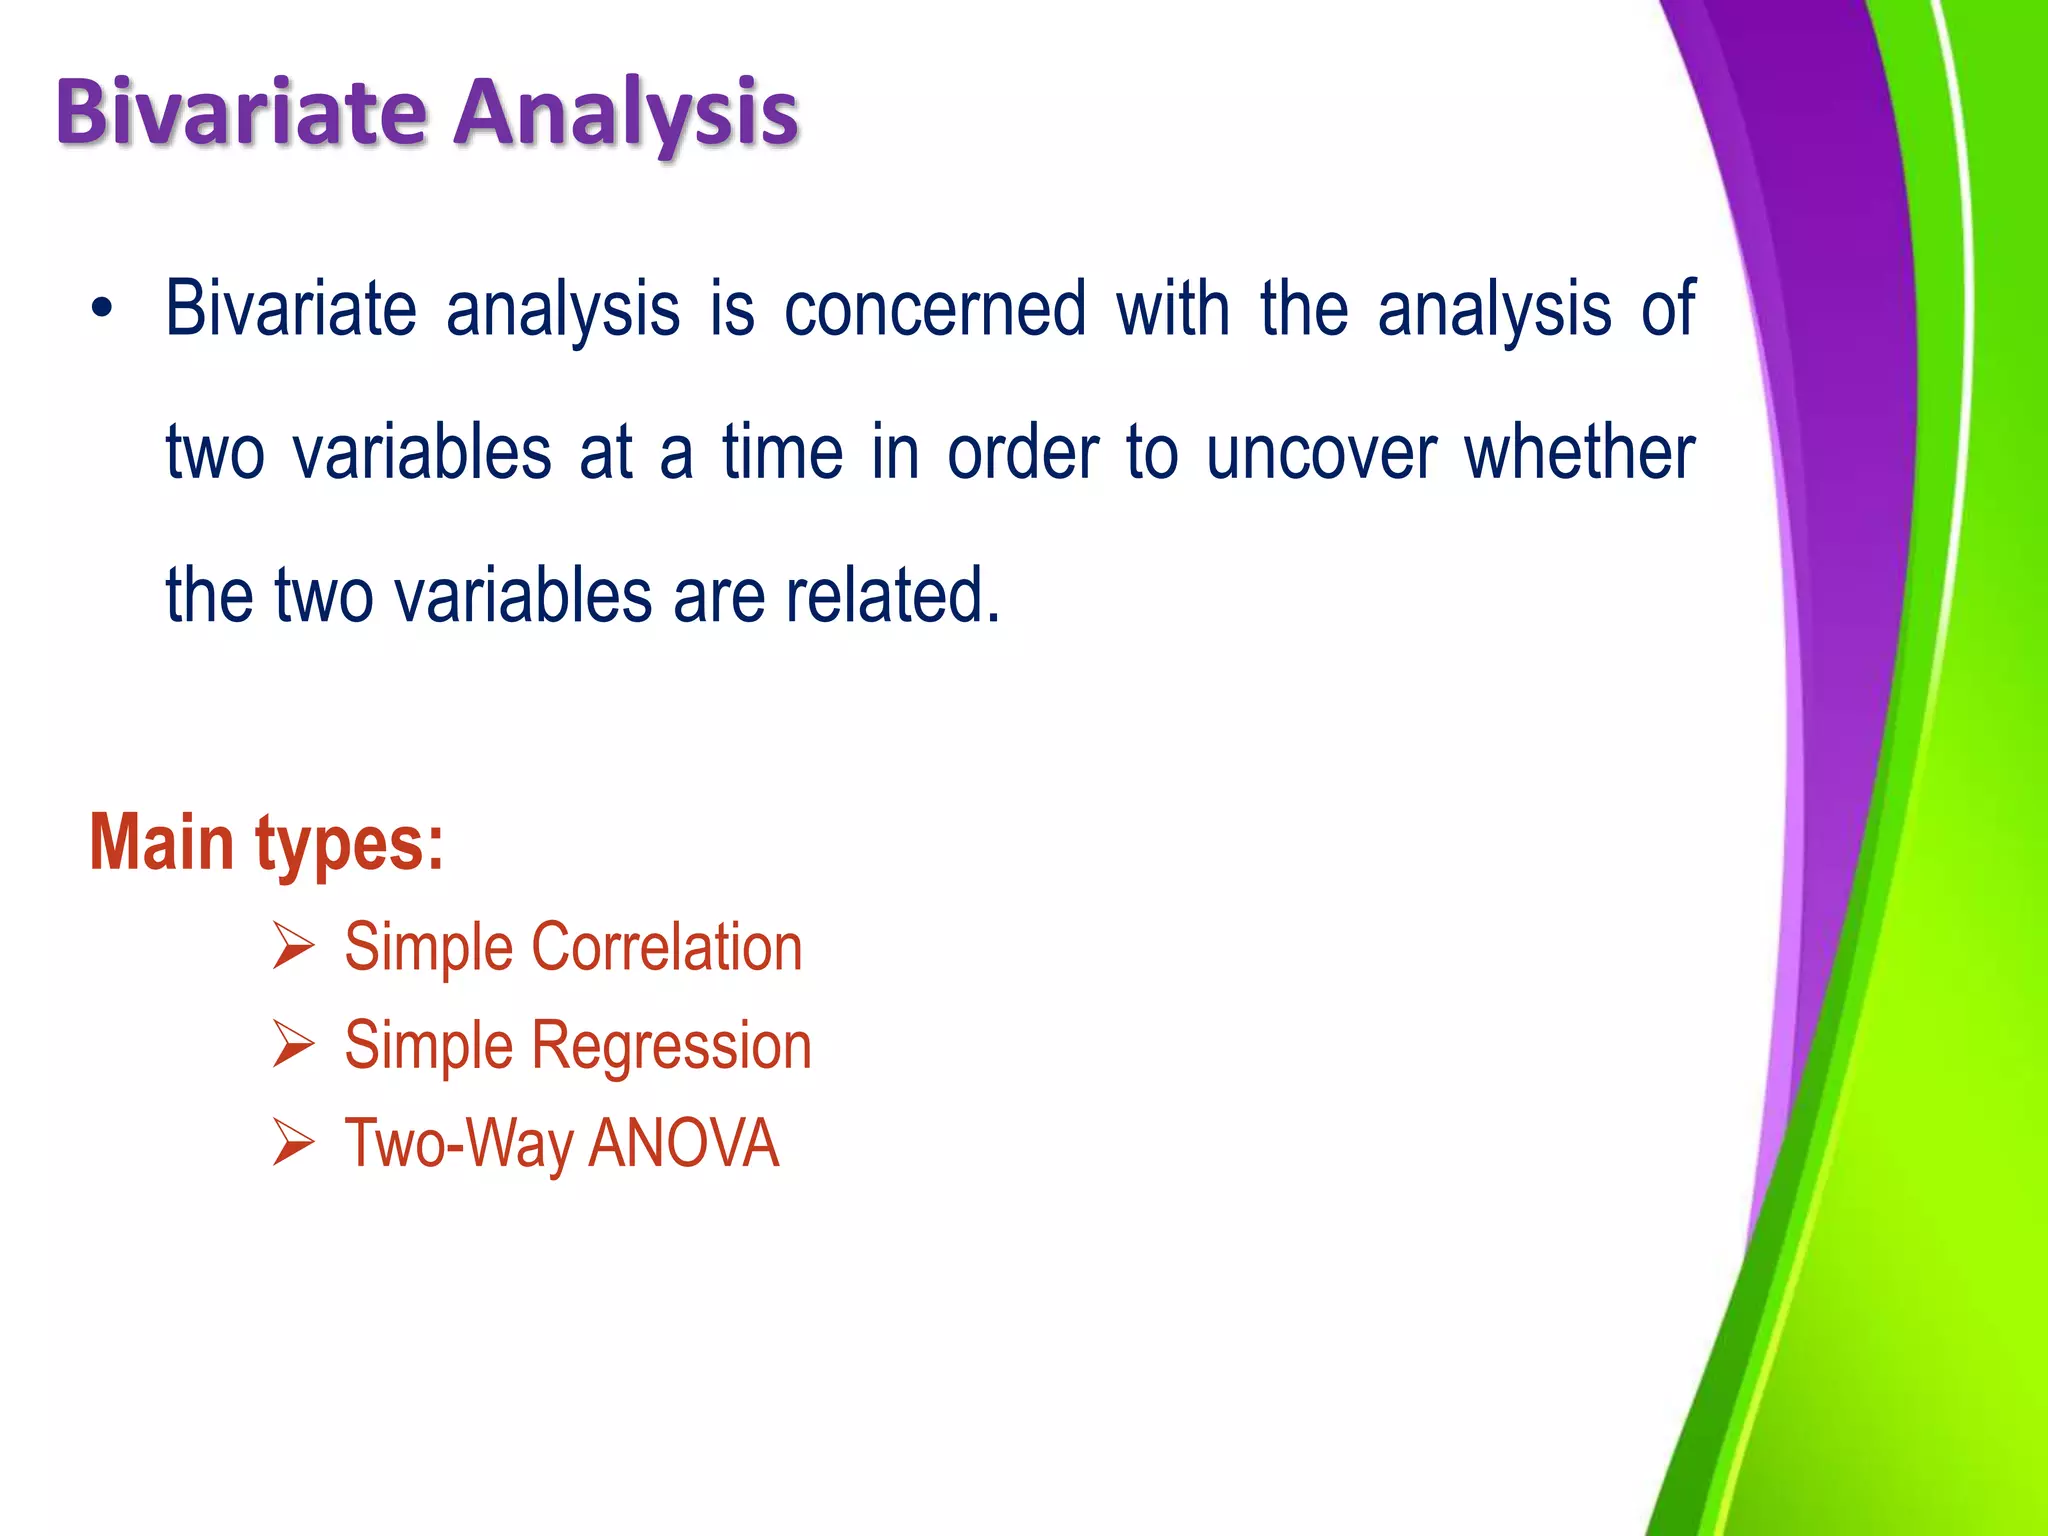
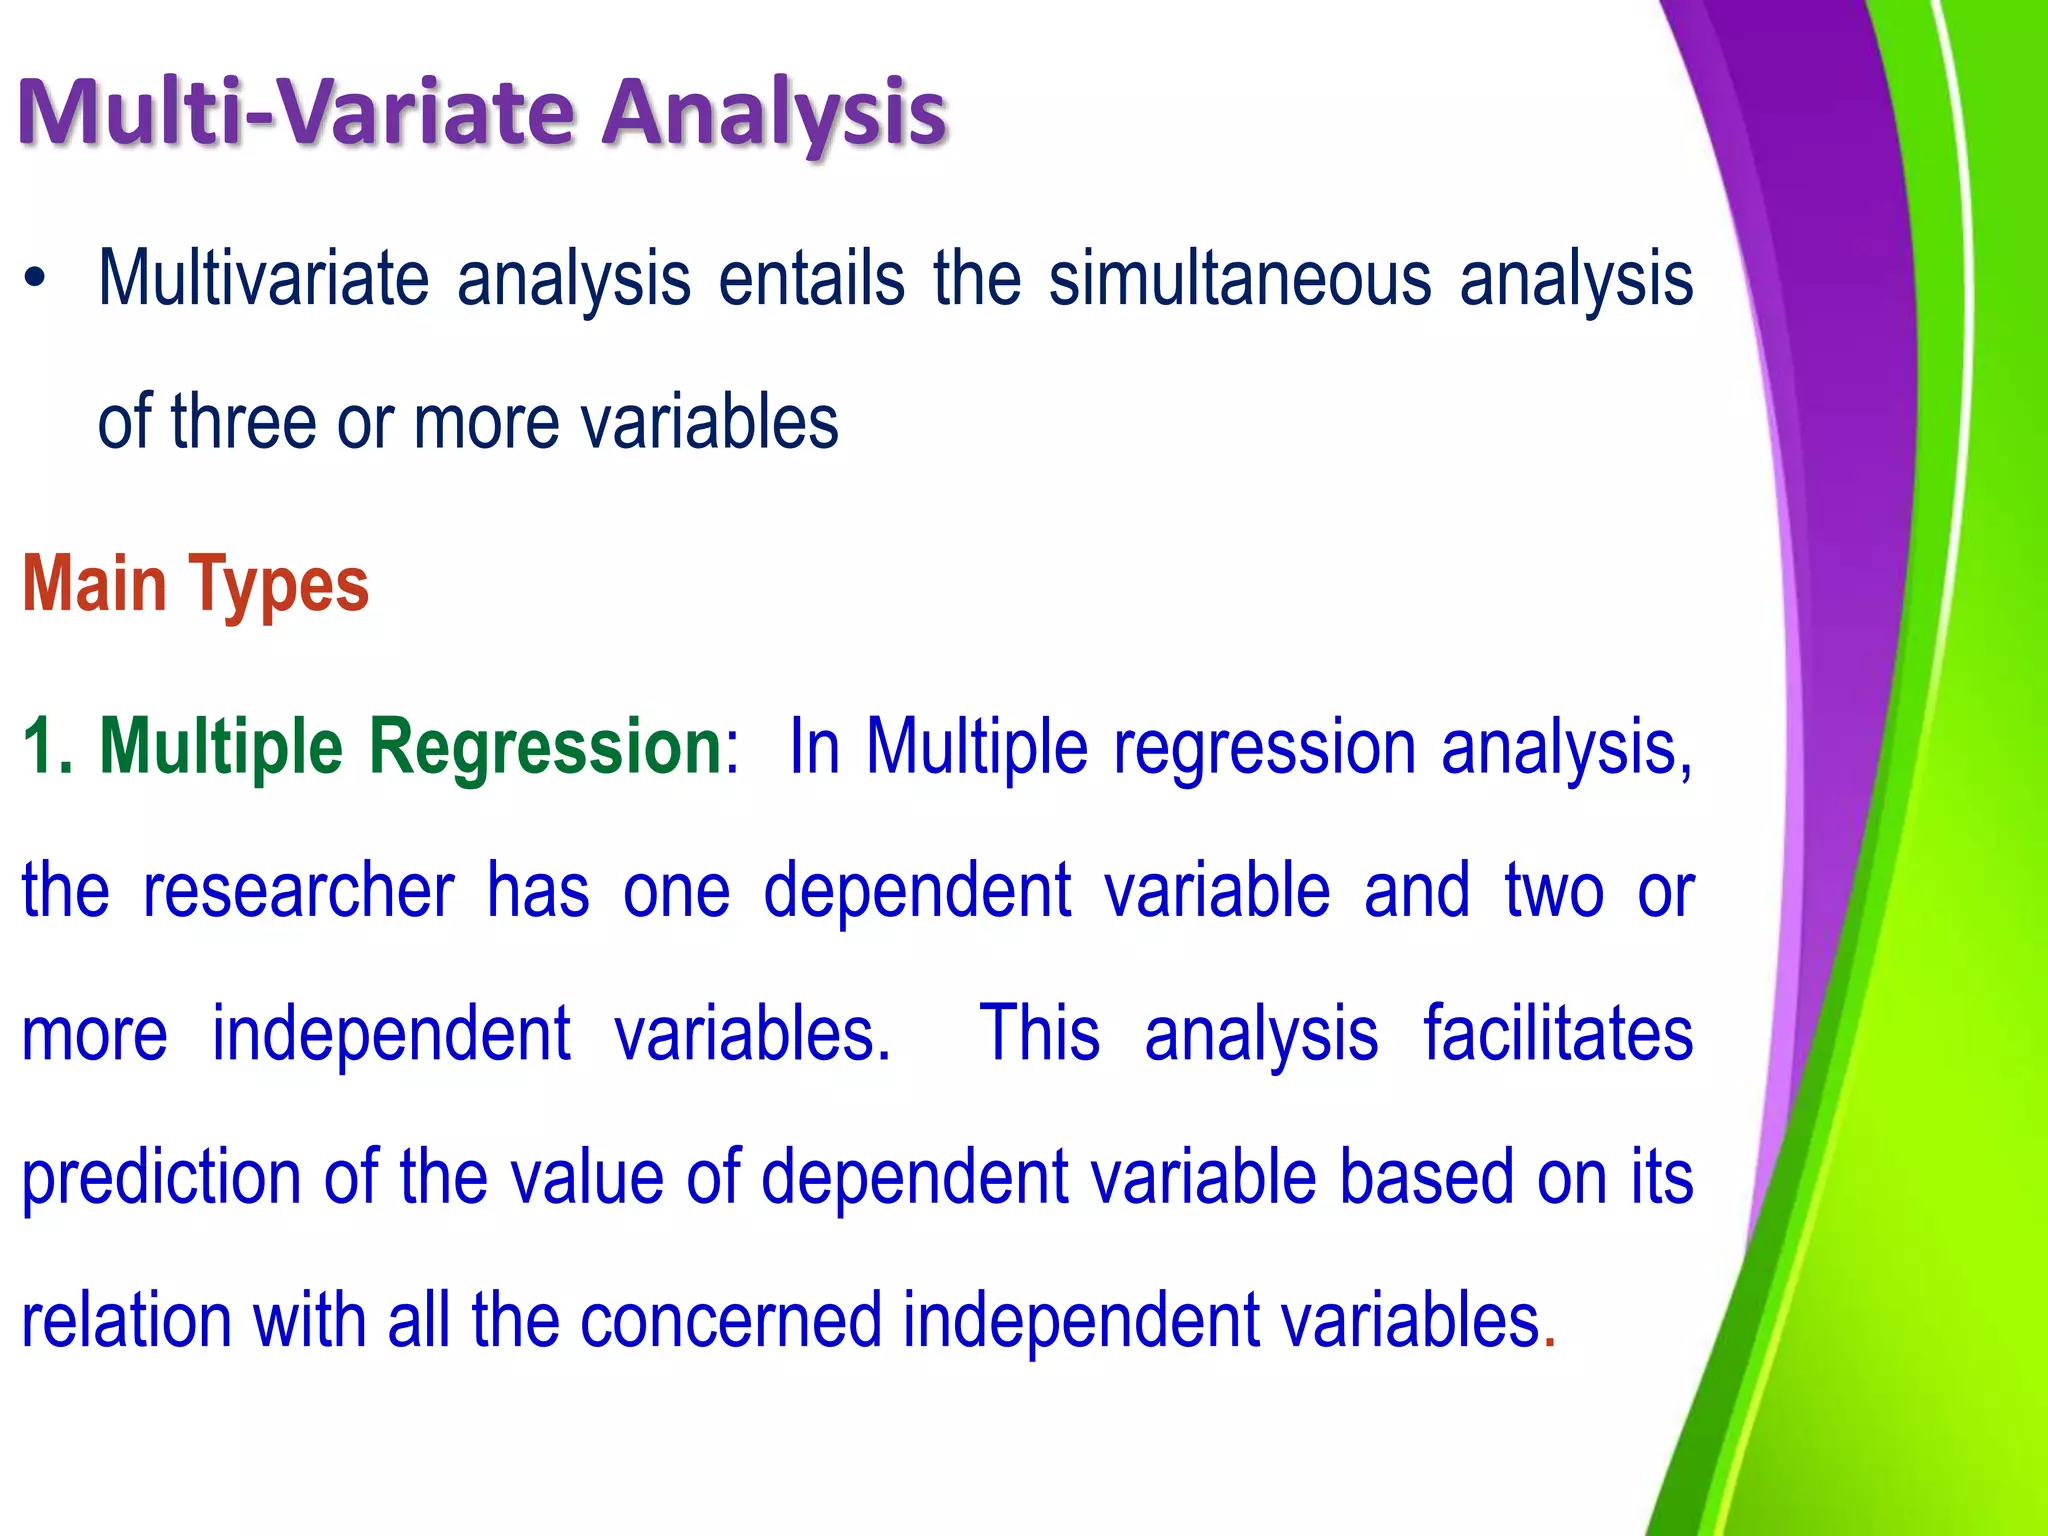
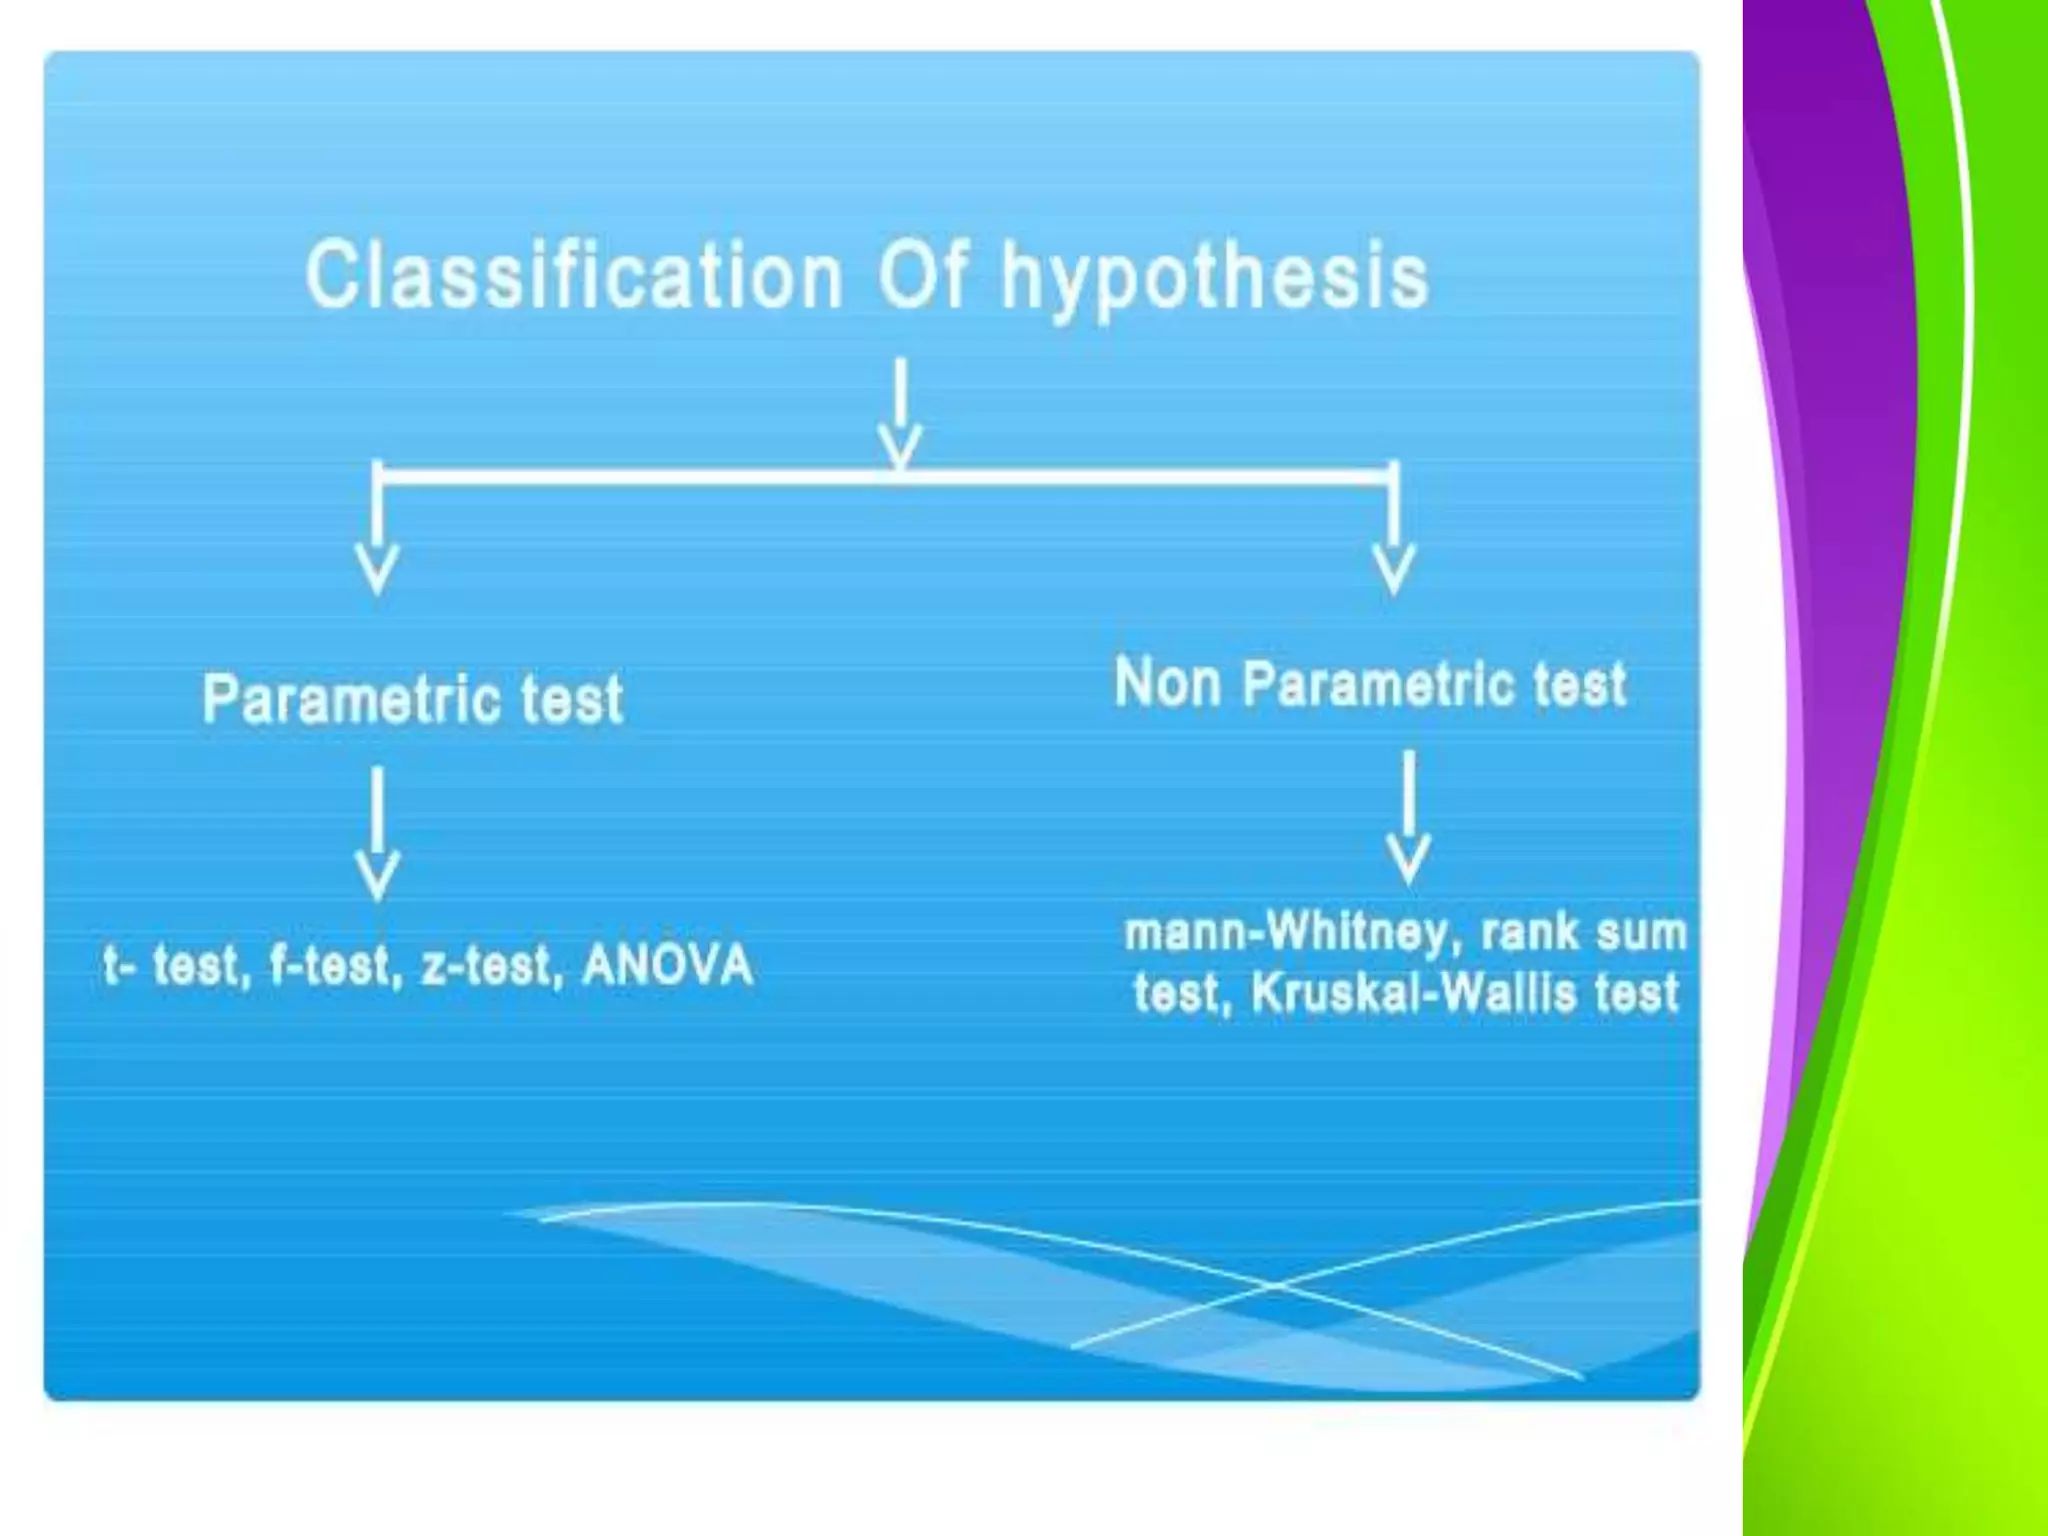
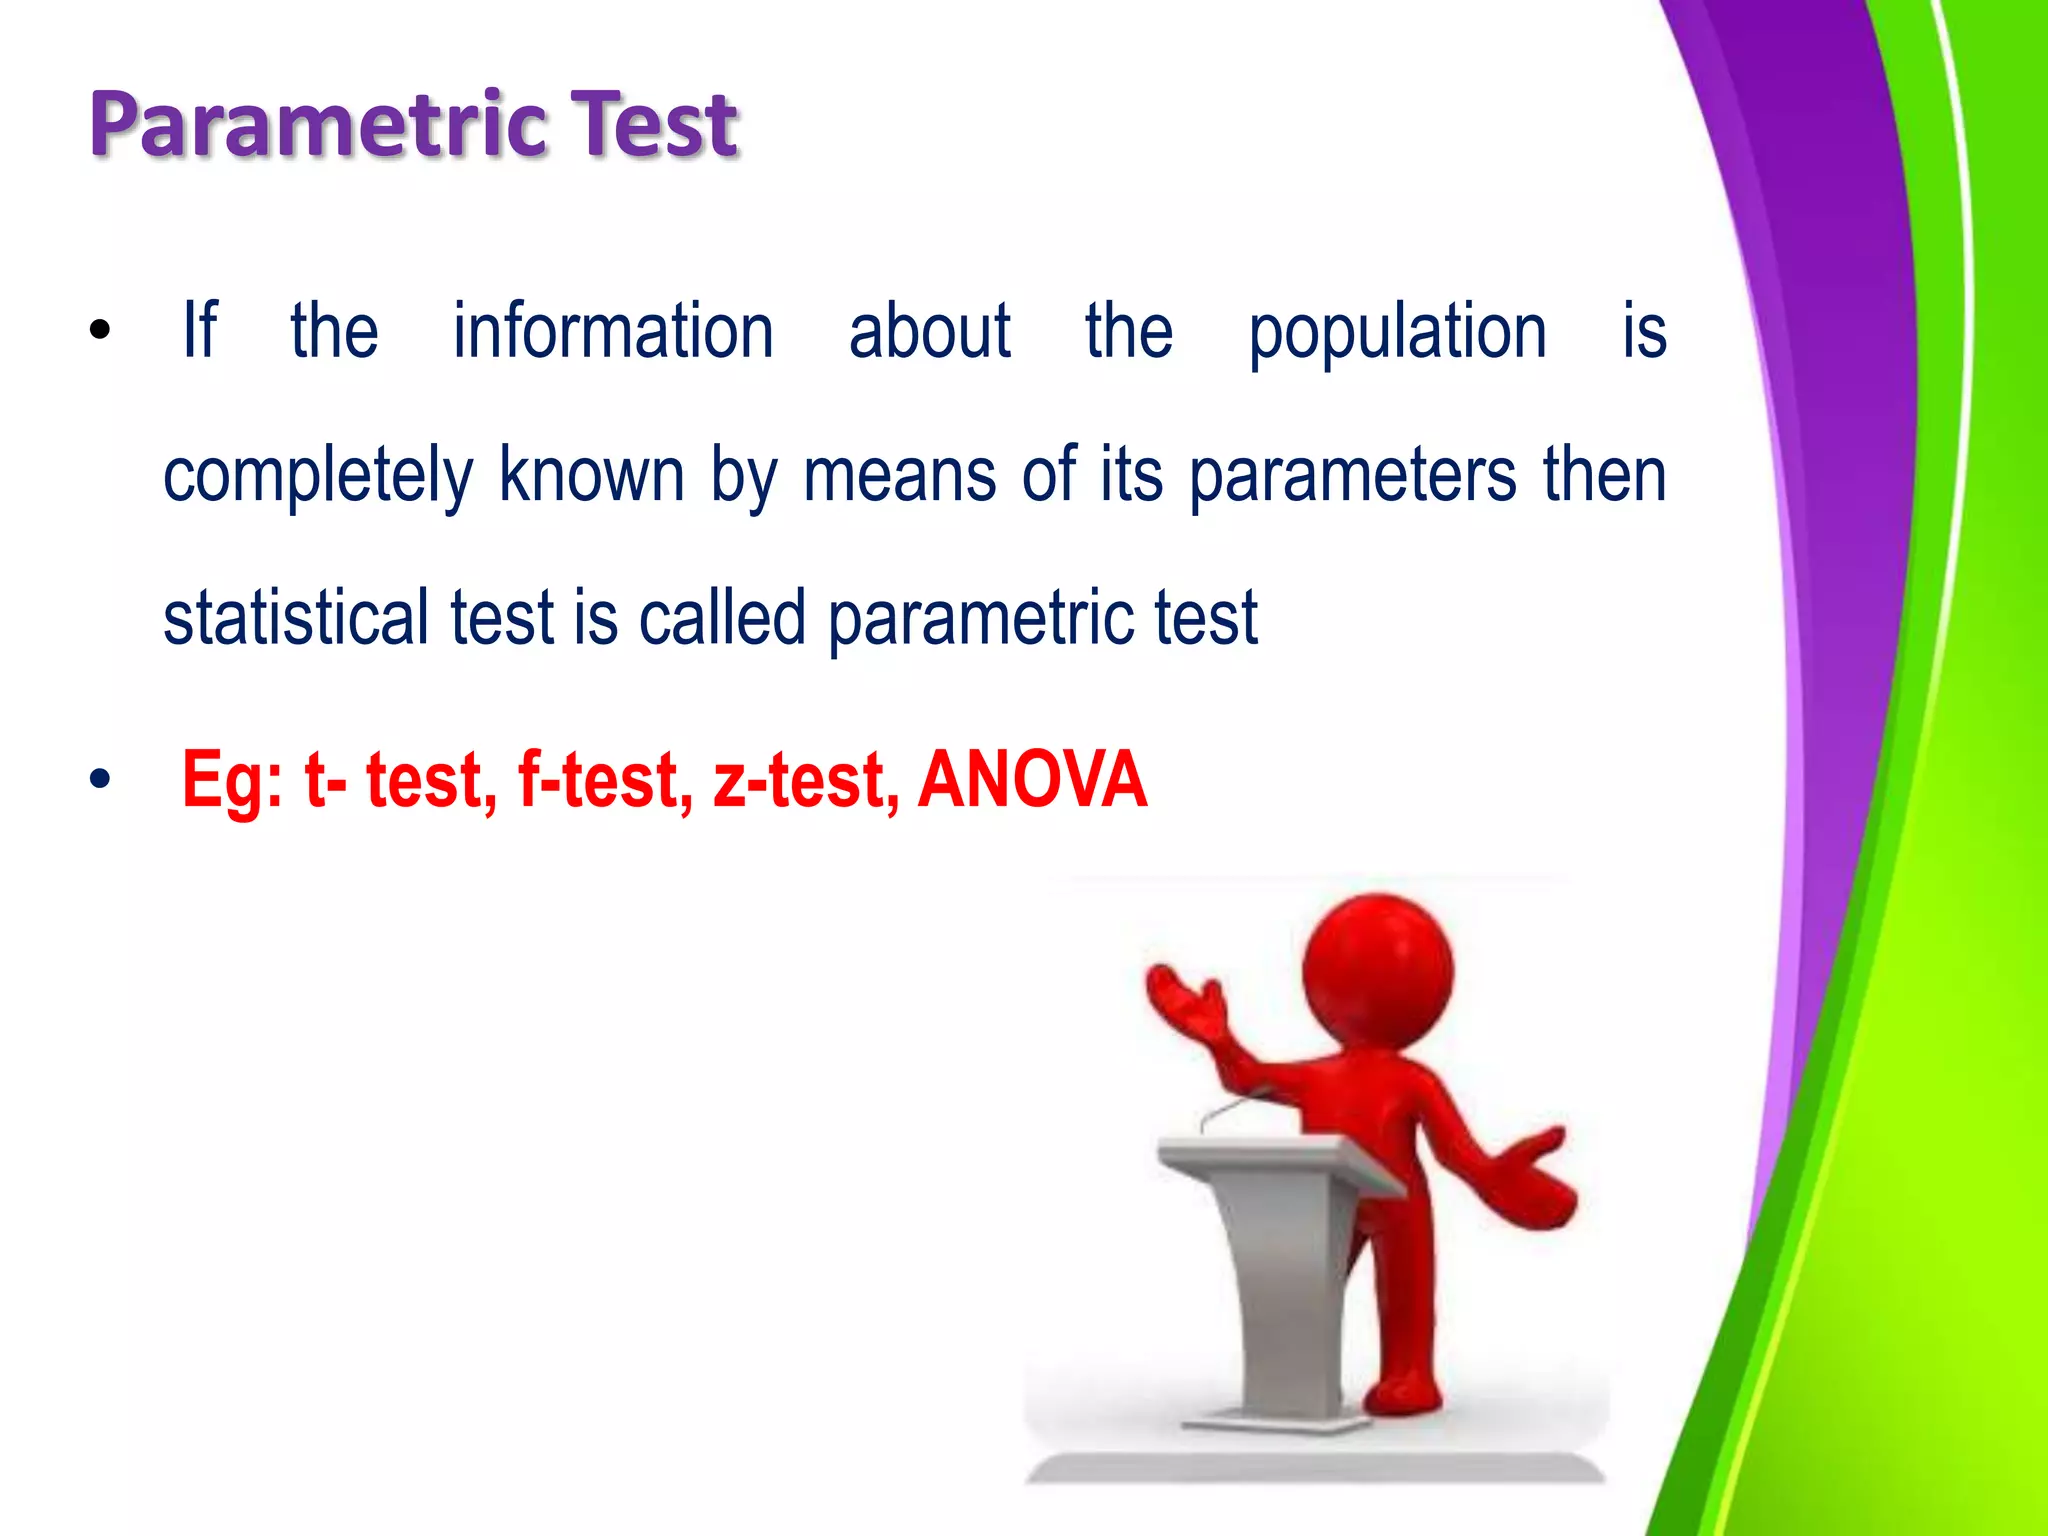
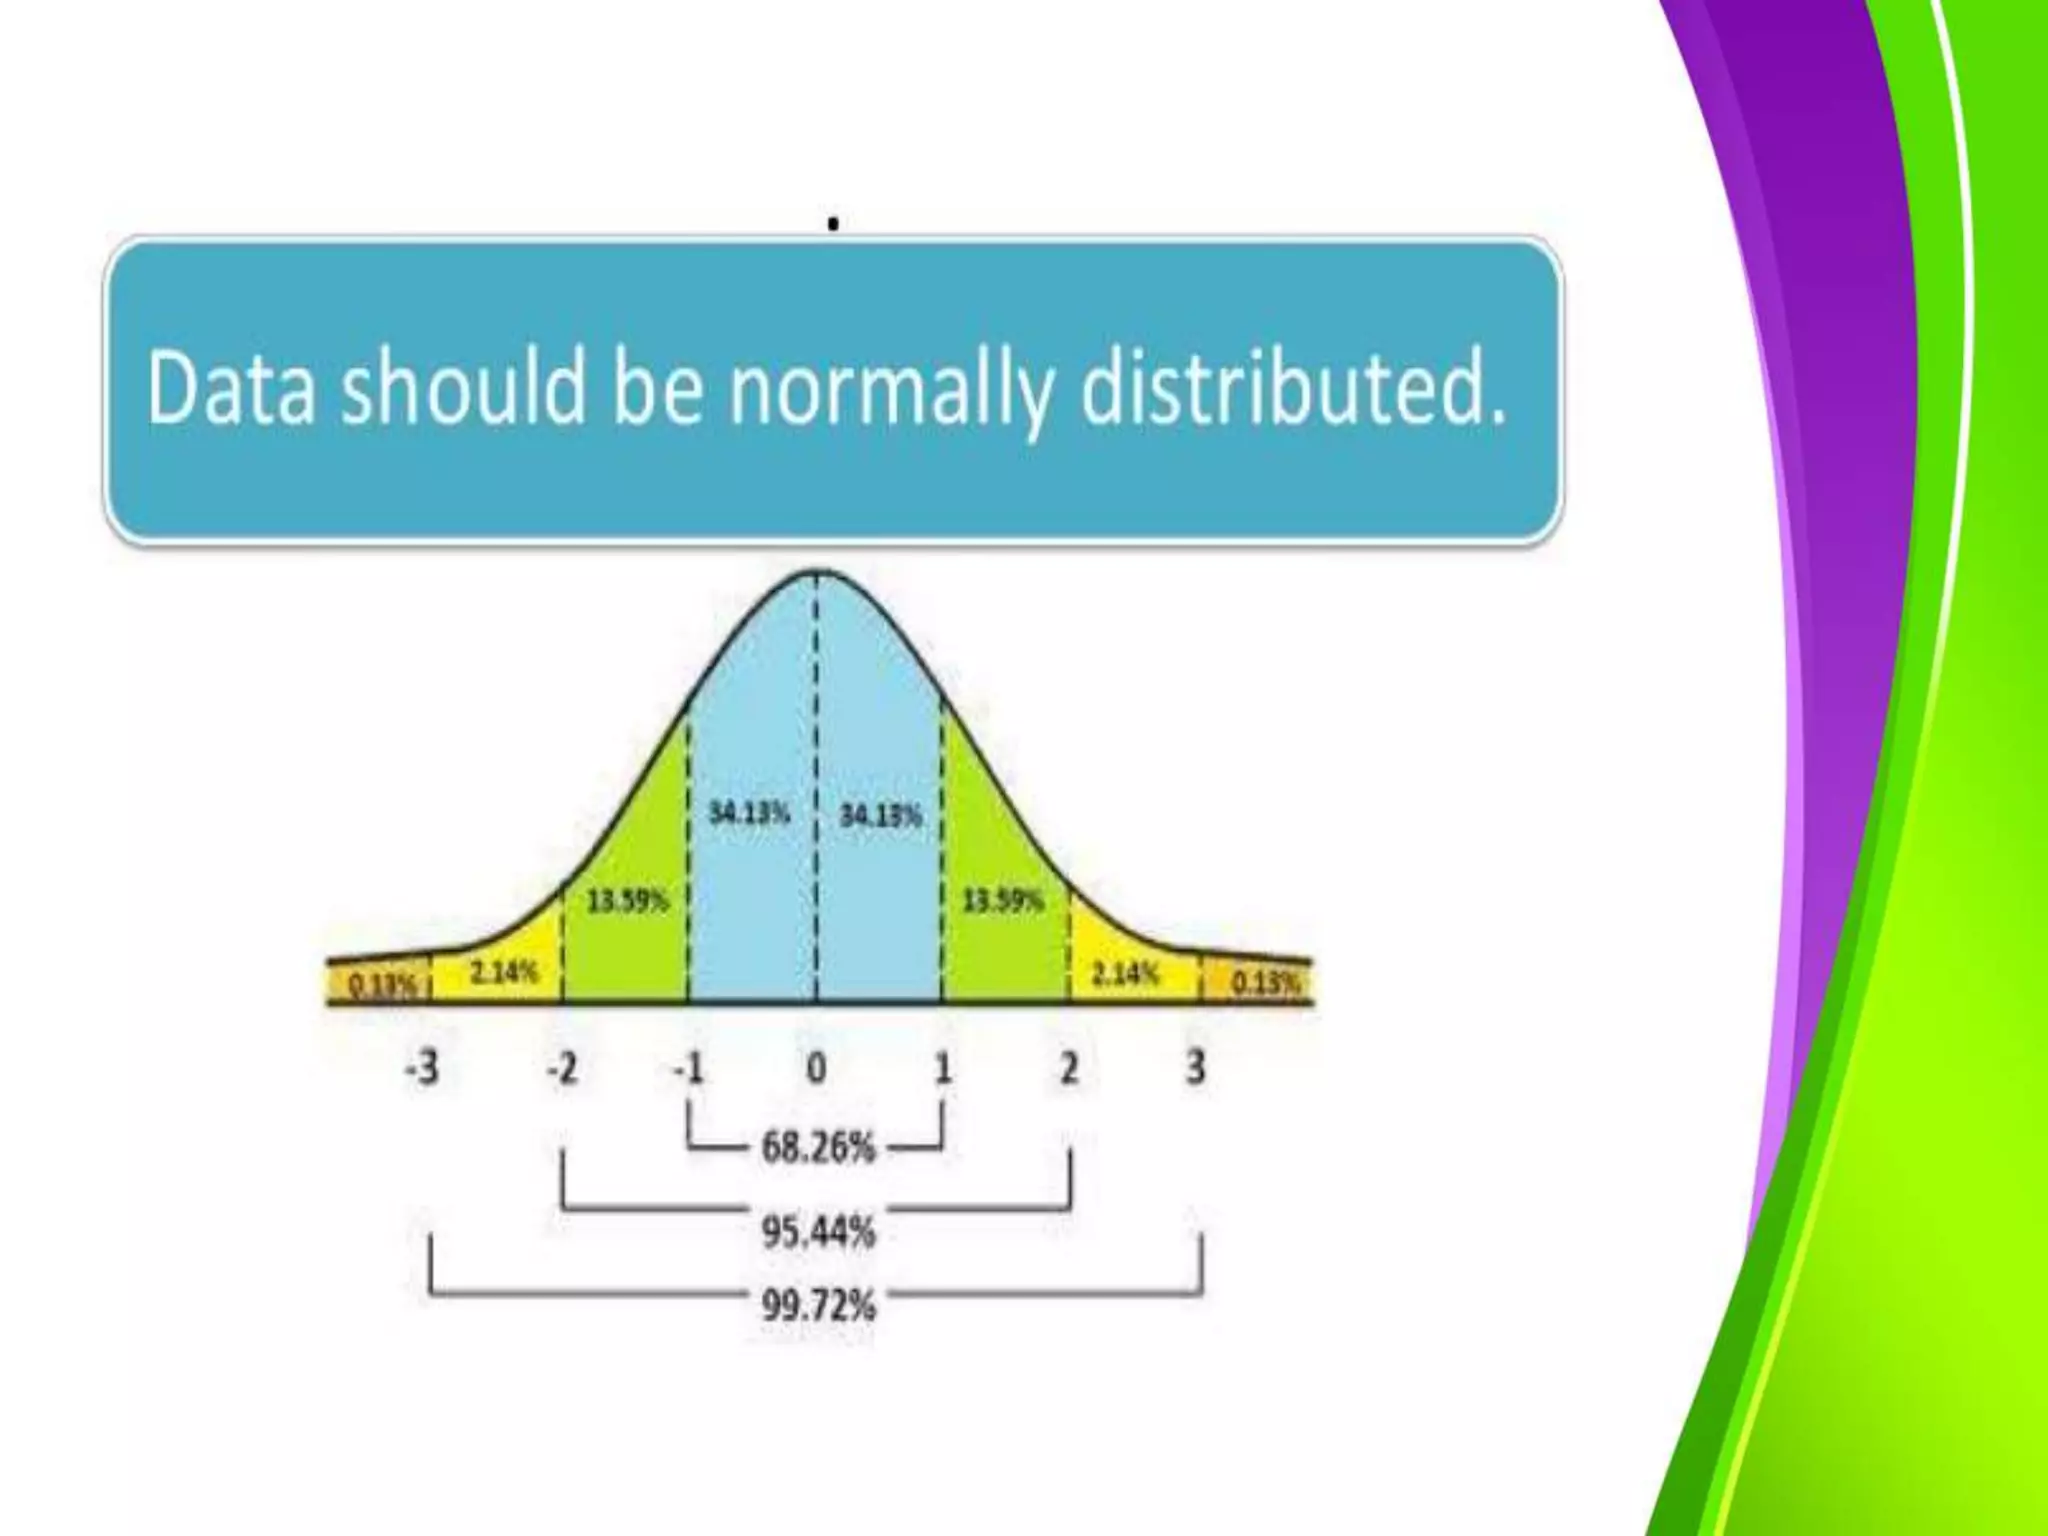
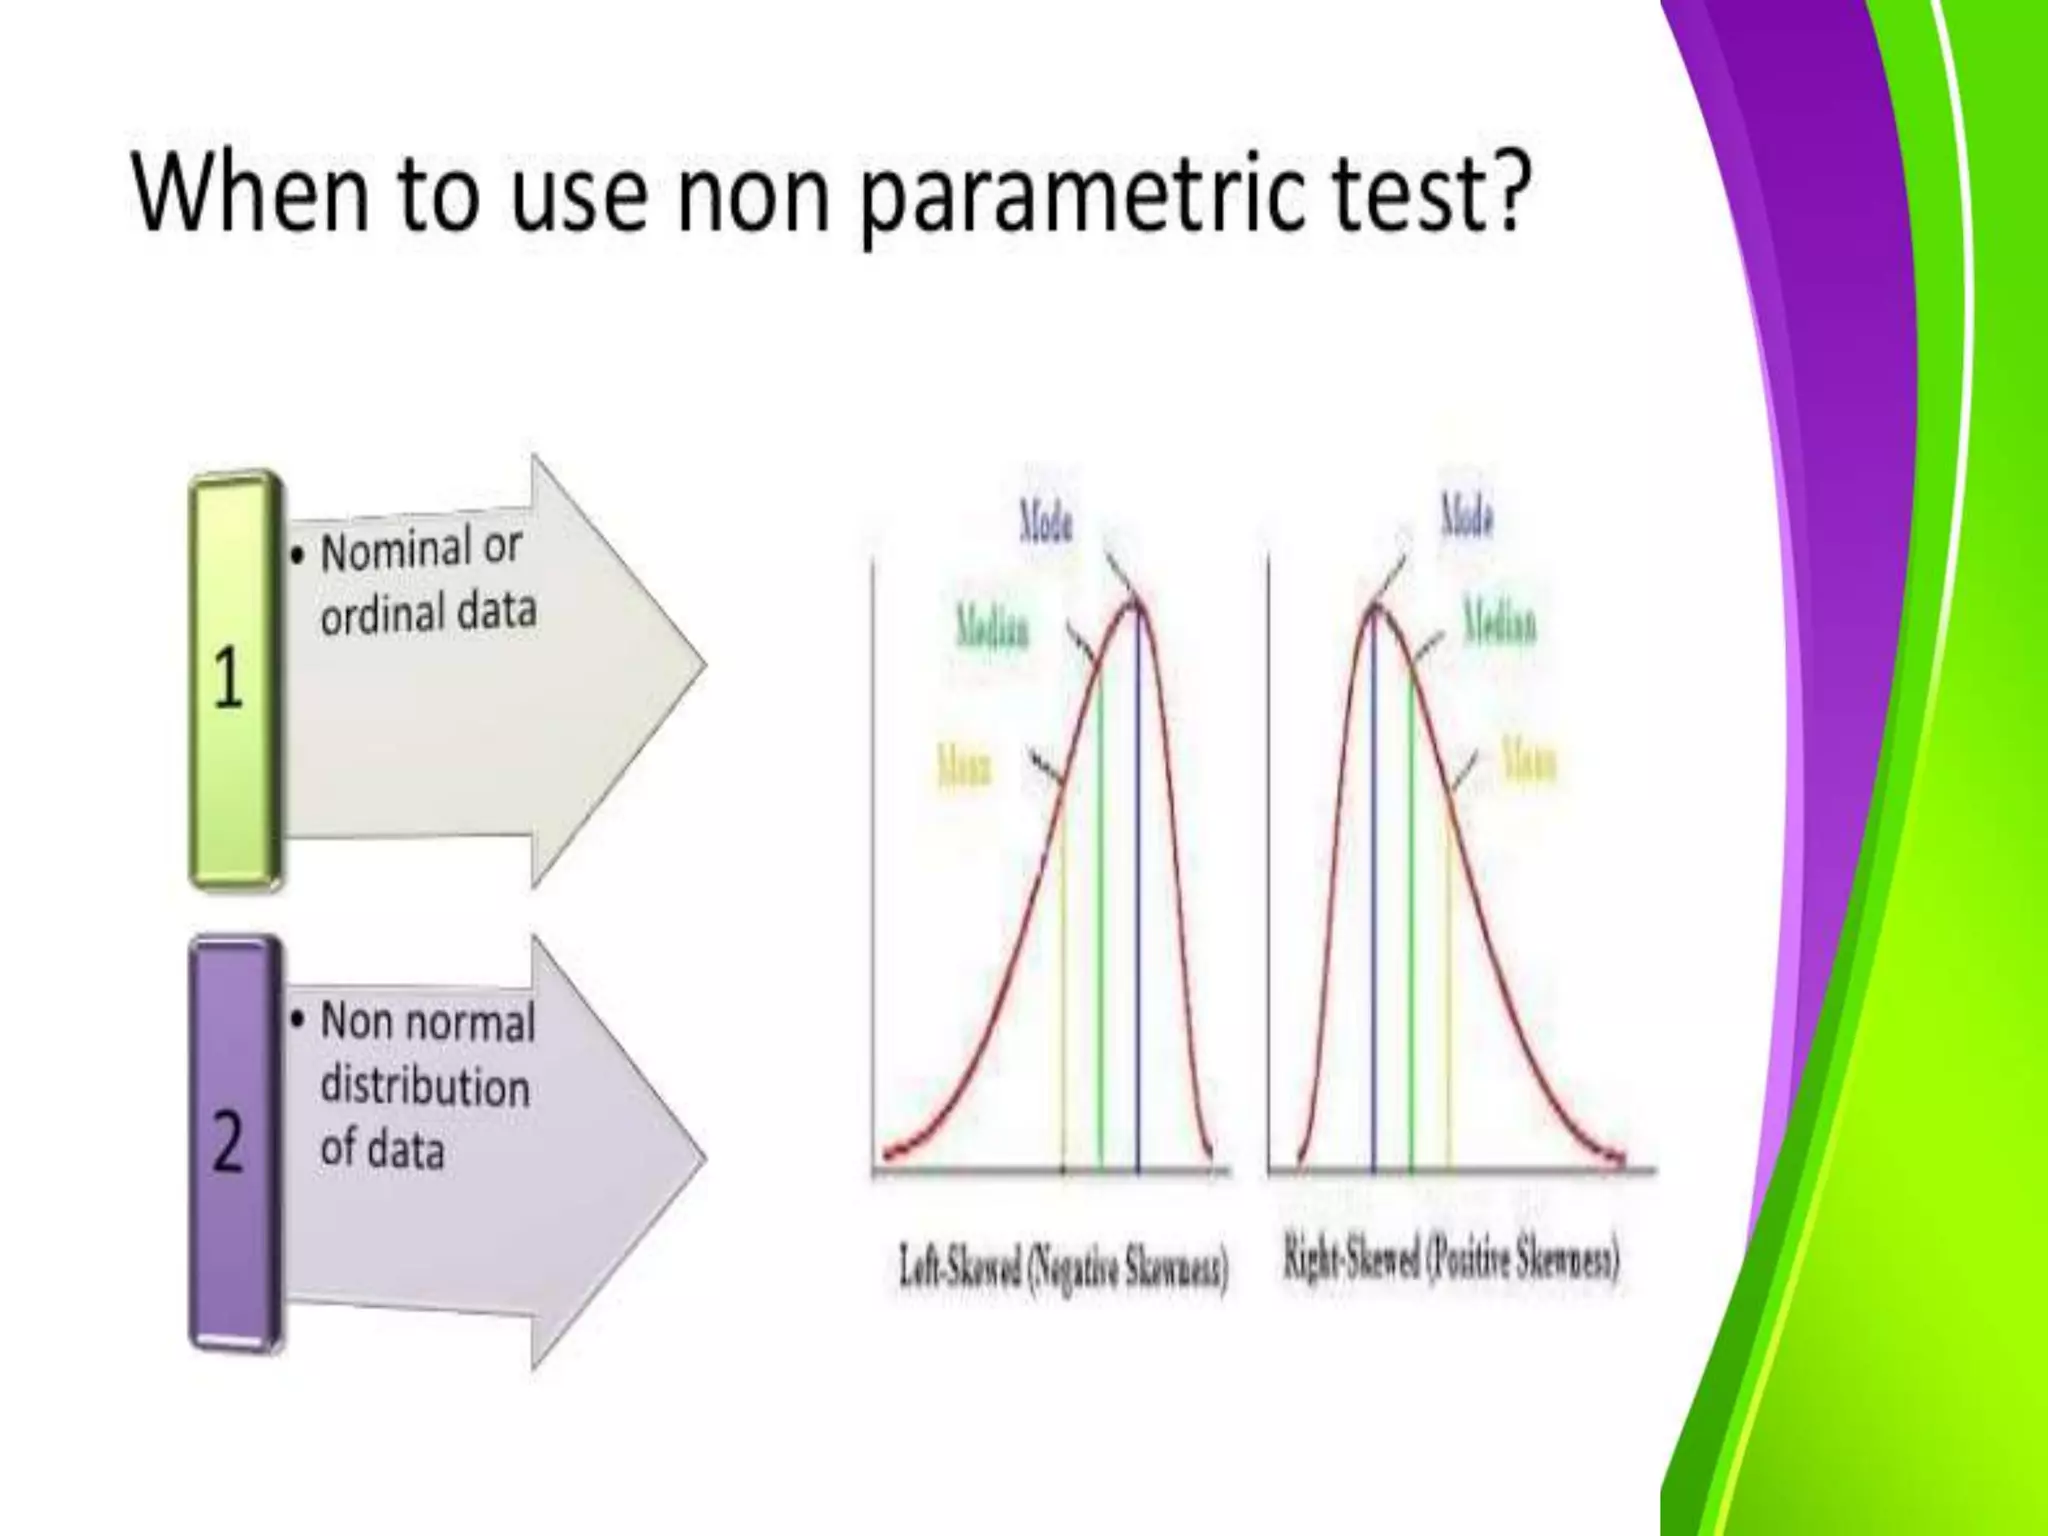
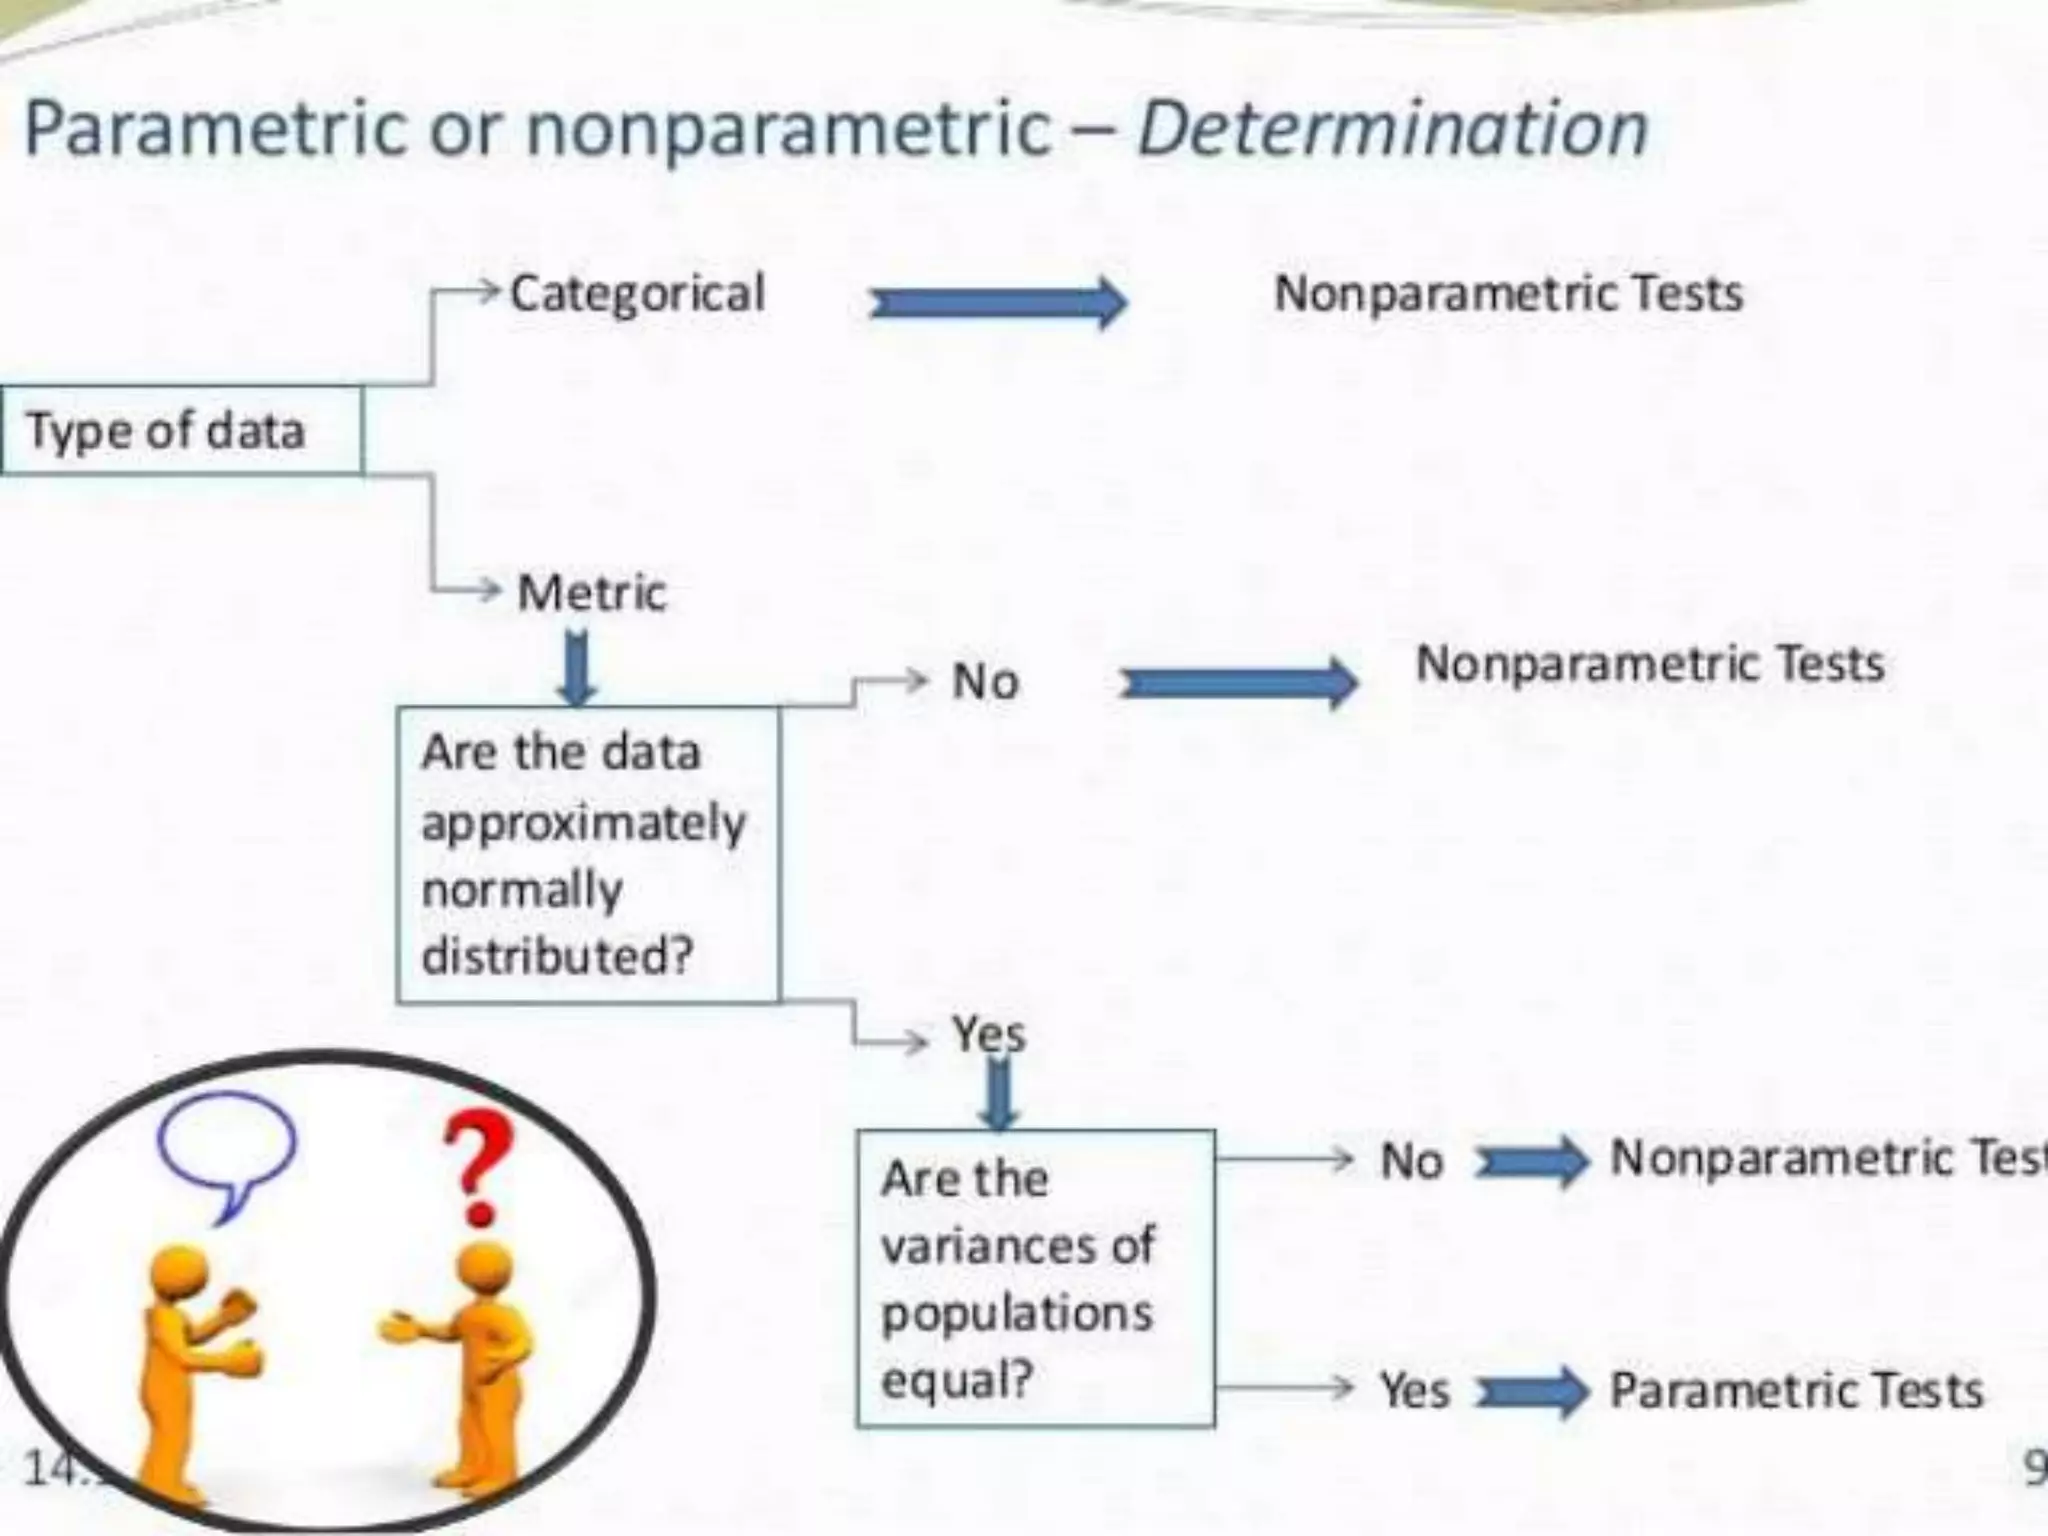
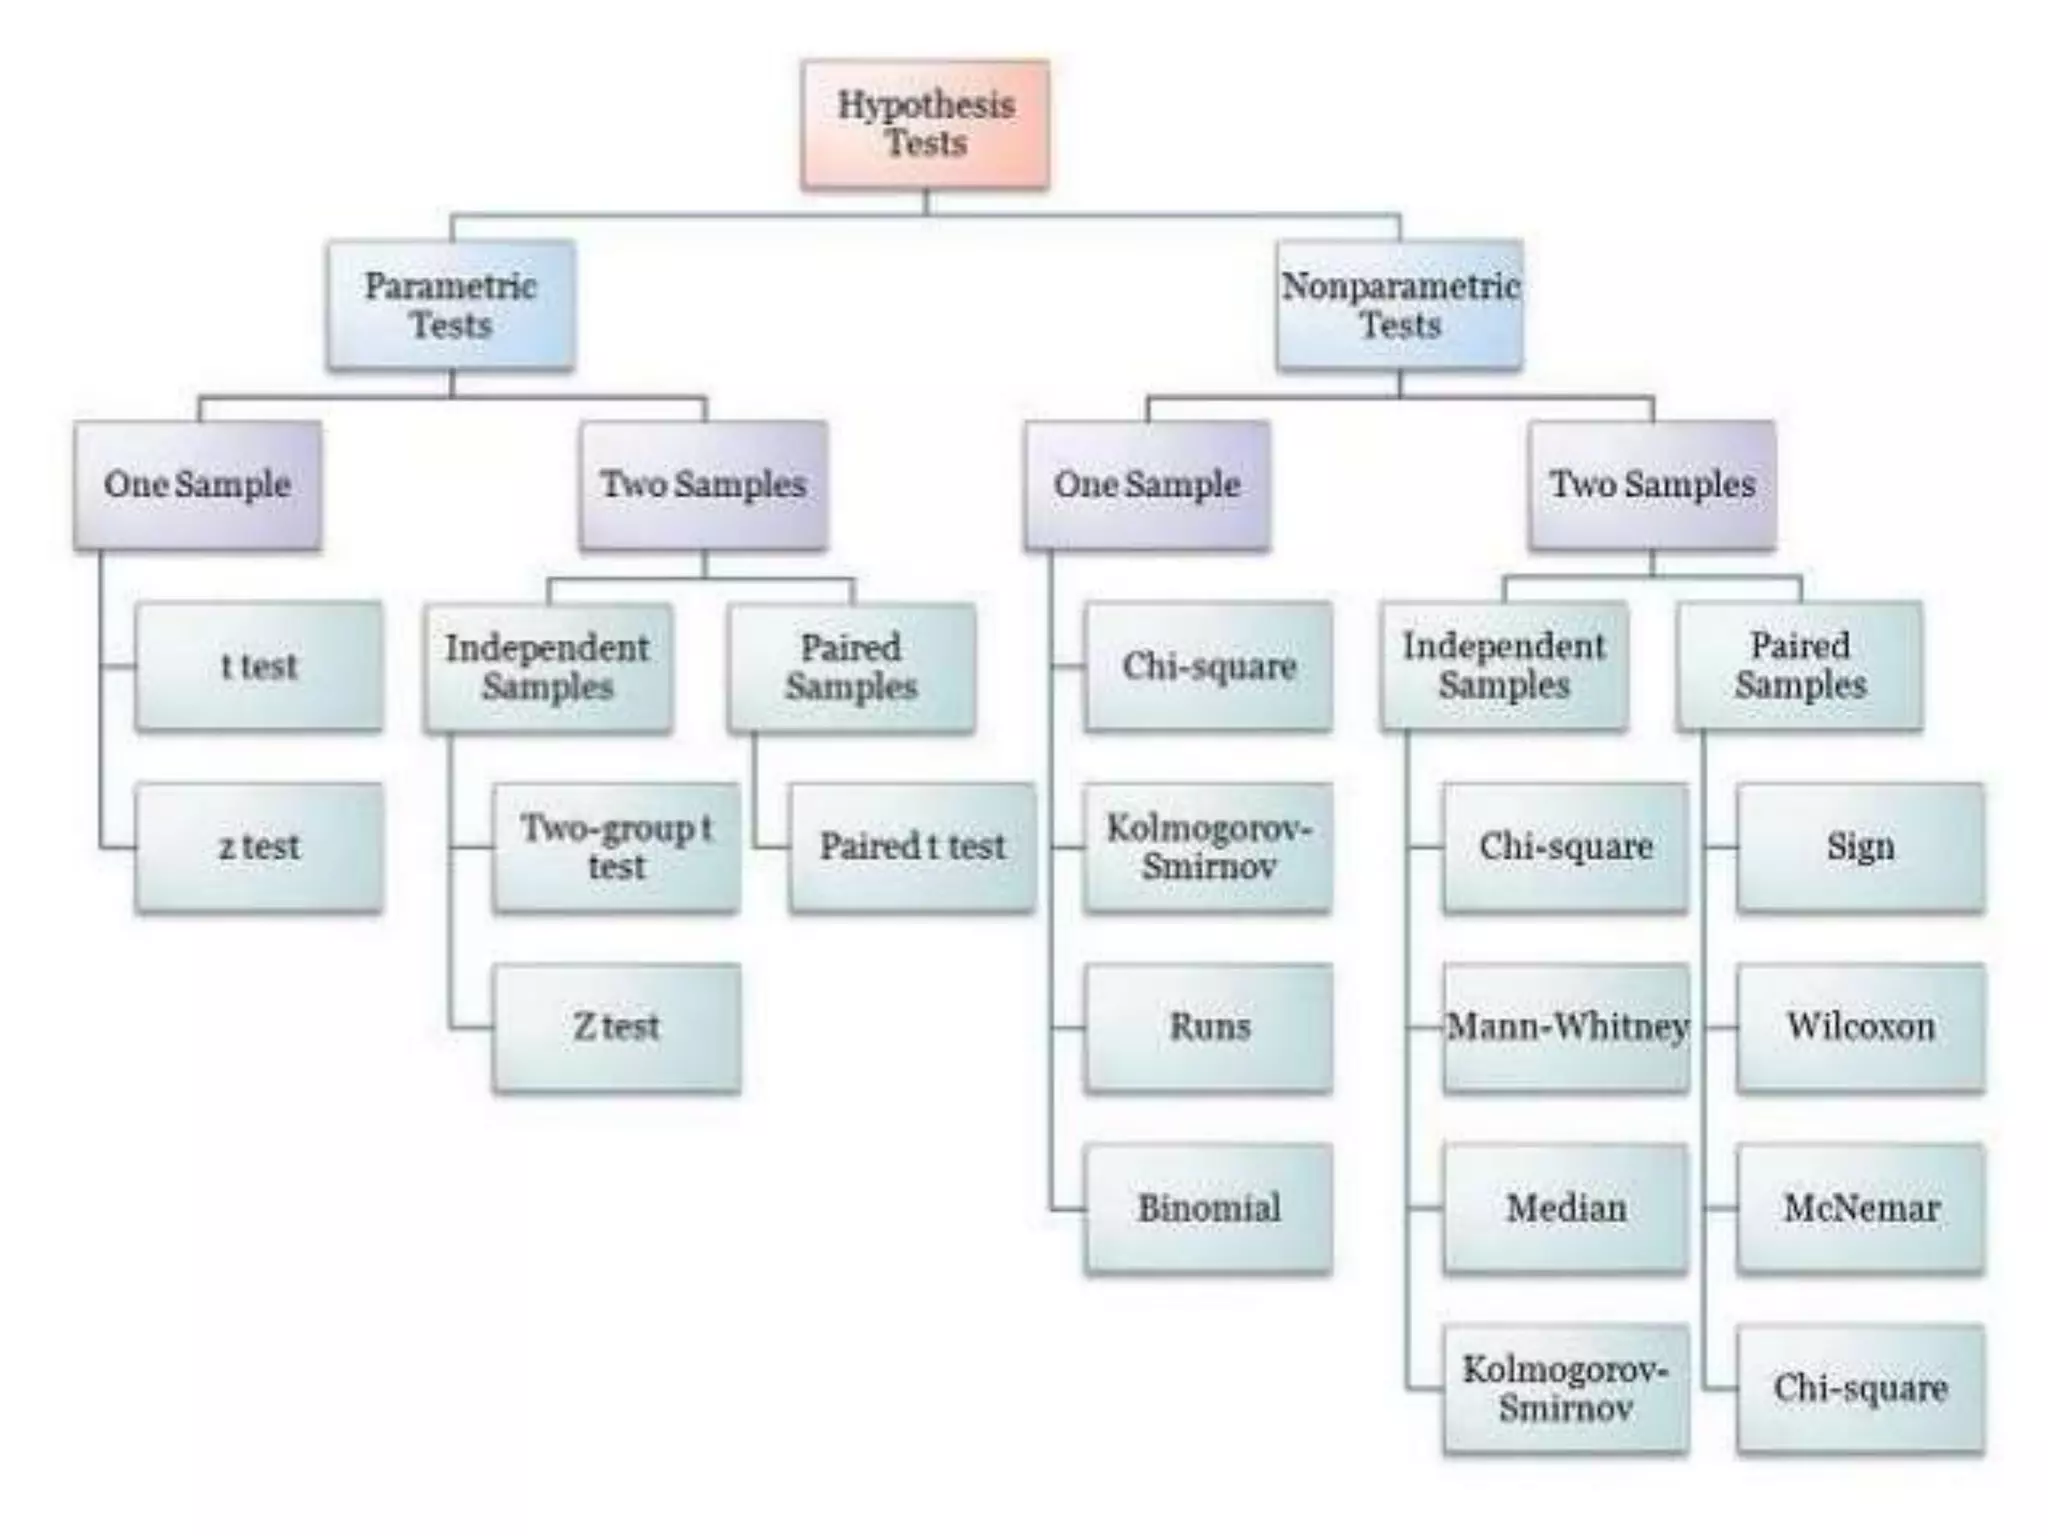
This document discusses different types of data analysis, including descriptive analysis, causal analysis, inferential analysis, univariate analysis, bivariate analysis, and multivariate analysis. Descriptive analysis examines variable distributions to provide profiles and characteristics. Causal analysis assesses relationships between variables. Inferential analysis tests hypotheses and estimates population values. Univariate analysis examines one variable, while bivariate and multivariate analyze two or more variables, including correlation, regression, and ANOVA tests. Parametric tests assume known population parameters, while nonparametric tests do not require known parameters.
2. Meaning
Analysis of data means critical
examination of the tabulated data to
determine the inherent facts and
characteristics of the object under
study. This, in turn, will help in
determining the patterns of
relationships among the variables
relating to it.
3. Definition
“Analysis of data involves a number of closely related
operations that are performed with the purpose of
summarizing the collected data and organizing these in such a
manner that they will yield answer to the research questions
or suggest hypothesis or questions if no such questions or
hypothesis had initiated the study”
- Prof. Wilkinse and Bhandarkar
4. Characteristics of Analysis of Data
• It demands a deep and intensive knowledge
on the part of the research about the data to
be analyzed.
• A systematic analysis reveals the hidden
characteristics of data to draw valid
generalization.
• The data to be interpreted should be
reproducible.
• The data to be interpreted should be readily
disposed to quantitative treatment.
5.
6. Types of Data Analysis
• Data analysis depends upon the nature of
research that the researcher is undertaking.
Analysis of data can be categorized as:
I. Descriptive & Causal Analysis and
II. Inferential or Statistical Analysis.
7. Descriptive Analysis
• Descriptive analysis deals with the study of variables. In
other words, the study of distribution of variables is
termed as a descriptive analysis.
• According to C Emory, “descriptive analysis is largely
the study of distribution of one variable. This study
provides us with profiles of companies, work groups,
persons and other subjects on any multiple
characteristics such as size, composition, efficiency,
preferences, etc.”
8. • Illustration: The researcher is collecting data from various
law colleges in India to map the job preferences of the
students in the final year of LL.B. In such a research job
preferences like litigation, corporate, further studies,
judiciary etc. becomes the variable.
• Under it statistical tools like percentage and means are
used and the data is then represented through a graph.
The data analysis may be having one variable also
known as one-dimensional analysis or two variables/
bivariate analysis or more than two variables also
described as multivariate analysis.
9. Uni-Variate Analysis
Univariate analysis refers to the analysis of one variable at a
time. The common approaches are as follows:
• Frequency Tables
• Diagrams:
Bar Charts
Pie Charts
Histograms
• Measures of Central Tendency:
Arithmetic Mean
Median
Mode
• Measures of Dispersion:
Range
Mean Deviation
Standard Deviation
10. Bivariate Analysis
• Bivariate analysis is concerned with the analysis of
two variables at a time in order to uncover whether
the two variables are related.
Main types:
Simple Correlation
Simple Regression
Two-Way ANOVA
11. Multi-Variate Analysis
• Multivariate analysis entails the simultaneous analysis
of three or more variables
Main Types
1. Multiple Regression: In Multiple regression analysis,
the researcher has one dependent variable and two or
more independent variables. This analysis facilitates
prediction of the value of dependent variable based on its
relation with all the concerned independent variables.
12. 2. Multi-ANOVA:
• When the researcher has a single dependent
variable that cannot be measured but can be
classified into two or more groups on the basis
of some attribute, we have multiple
discriminant analysis.
• With the help of this analysis we can predict an
entity’s possibility of belonging to a particular
group based on several predictor variables. In
Multivariate analysis of variance, we find out
the ratio between within – group variance and
among group variance.
13. 3. Canonical analysis: It facilitates simultaneous
prediction of a set of dependent variables. This
analysis can be used in the case of both measurable
and non measurable variables.
14. Causal Analysis
• Causal analysis is concerned with the study of how one or more
variables affect changes in another variables.
• It assess functional relationship existing between the variables.
• This analysis can be termed as correlation analysis.
• It is considered relatively more important in experimental
researchers. Whereas in social and business researchers our
interest lies in understanding and controlling relationships
between variables then with determining causes per se and as
such we consider correlation analysis is relatively more
important.
15. Inferential Analysis
• Inferential analysis is concerned with the various tests of significance for
testing hypotheses in order to determine with what validity data can be said to
indicate some conclusion or conclusions. It is also concerned with the
estimation of population values. It is mainly on the basis of inferential
analysis that the task of interpretation (i.e., the task of drawing inferences and
conclusions) is performed.
Illustration:
• The researcher is studying the access to justice system in India and his
hypothesis beings that the India justice delivery system favors the haves and
marginalizes the have not’s. The data collected is from various stages in the
delivery system like police station, courts of justice, litigants etc. Once the data
is collected, proceeded then the researcher does inferential analysis to test the
validity of the hypotheses.
16.
17. Parametric Test
• If the information about the population is
completely known by means of its parameters then
statistical test is called parametric test
• Eg: t- test, f-test, z-test, ANOVA
18.
19.
20.
21. Nonparametric test
• If there is no knowledge about the population or
paramters, but still it is required to test the hypothesis
of the population. Then it is called non-parametric test
• Eg: mann-Whitney, rank sum test, Kruskal-Wallis
test