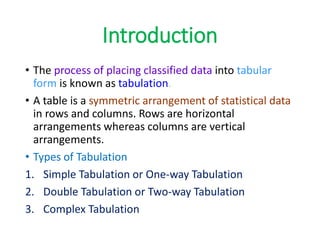
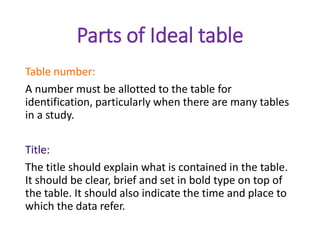
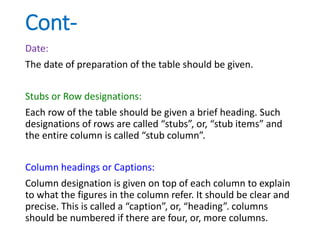
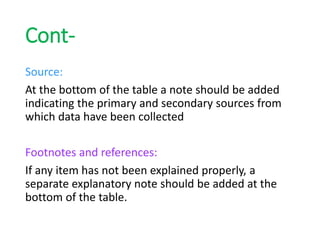
Tabulation
By:
Dodiya Nikunj
(15BPE028)
Content
1. Introduction
2. Objectives
3. Importance of tabulations
4. Characteristics of good table
5. Parts of table
6. Conclusion
7. Reference
Introduction
• The process of placing classified data into tabular
form is known as tabulation.
• A table is a symmetric arrangement of statistical data
in rows and columns. Rows are horizontal
arrangements whereas columns are vertical
arrangements.
• Types of Tabulation
1. Simple Tabulation or One-way Tabulation
2. Double Tabulation or Two-way Tabulation
3. Complex Tabulation
Objectives
• To carry out investigations
• To do comparisons
• To locate omissions and errors in the data
• To use space economically
• To study the trends
• To simplify data
• To use it as future references
Importance of tabulation
• Under tabulation, data is divided into various parts
and for each part there are totals and sub totals.
Therefore, relationship between different parts can
be easily known.
• Since data are arranged in a table with a title and a
number so these can be easily identified and used
for the required purpose
• Tabulation makes the data brief. Therefore, it can
be easily presented in the form of graphs.
• Tabulation presents the numerical figures in an
attractive form.
Importance of tabulation
• Tabulation makes complex data simple and as a
result of this, it becomes easy to understand the
data.
• This form of the presentation of data is helpful
in finding mistakes.
• Tabulation is useful in condensing the collected
data.
Importance of tabulation
• Tabulation makes it easy to analyze the data
from tables.
• Tabulation is a very cheap mode to present the
data. It saves time as well as space.
• Tabulation is a device to summaries the large
scattered data. So, the maximum information
may be collected from these tables.
Characteristics of good table
There are no hard and fast rules for the tabulation of
data but for constructing good table, following
general rules should be observed while tabulating
statistical data.
• The table should suit the size of the paper and,
therefore, the width of the column should be decided
before hand.
• Number of columns and rows should neither be too
large nor too small.
• As far as possible figures should be approximated
before tabulation. This would reduce unnecessary
details.
Cont-
• Items should be arranged either in alphabetical,
chronological or geographical order or according to
size.
• The sub-total and total of the items of the table
must be written.
• Percentages are given in the tables if necessary.
• Ditto marks should not be used in a table because
sometimes it create confusion.
• Table should be simple and attractive.
Cont-
• A table should be logical, well-balanced in length
and breadth and the comparable columns should
be placed side by side.
• Light/heavy/thick or double rulings may be used
to distinguish sub columns, main columns and
totals.
• For large data more than one table may be used.
Parts of Ideal table
Table number:
A number must be allotted to the table for
identification, particularly when there are many tables
in a study.
Title:
The title should explain what is contained in the table.
It should be clear, brief and set in bold type on top of
the table. It should also indicate the time and place to
which the data refer.
Cont-
Date:
The date of preparation of the table should be given.
Stubs or Row designations:
Each row of the table should be given a brief heading. Such
designations of rows are called “stubs”, or, “stub items” and
the entire column is called “stub column”.
Column headings or Captions:
Column designation is given on top of each column to explain
to what the figures in the column refer. It should be clear and
precise. This is called a “caption”, or, “heading”. columns
should be numbered if there are four, or, more columns.
Cont-
Body of the table:
The data should be arranged in such a way that any figure can
be located easily. Various types of numerical variables should
be arranged in an ascending order, i.e., from left to right in
rows and from top to bottom in columns. Column and row
totals should be given.
Unit of measurement:
If the unit of measurement is uniform throughout the table, it
is stated at the top right-hand corner of the table along with
the title. If different rows and columns contain figures in
different units, the units may be stated along with “stubs”, or,
“captions”. Very large figures may be rounded up but the
method of rounding should be explained.
Cont-
Source:
At the bottom of the table a note should be added
indicating the primary and secondary sources from
which data have been collected
Footnotes and references:
If any item has not been explained properly, a
separate explanatory note should be added at the
bottom of the table.
Conclusions
• Thus,In the process of tabulation of data,
unnecessary details are avoided and data are
presented systematically in columns and
rows in a concise form. All tabular data re
presented in such a manner that they
become more meaningful and can be easily
understood by a common man.
Reference
• https://en.m.wiktionary.org/wiki/tabulation
• https://www.emathzone.com/tutorials/basic-
statistics/tabulation-of-data.html
• https://www.slideshare.net/mobile/NirmalSin
gh33/tabulation-41860260
• https://blog.socialcops.com/academy/resourc
es/cross-tabulation-how-why/
Thank you

Tabulation

  • 1.
  • 2.
    Content 1. Introduction 2. Objectives 3.Importance of tabulations 4. Characteristics of good table 5. Parts of table 6. Conclusion 7. Reference
  • 3.
    Introduction • The processof placing classified data into tabular form is known as tabulation. • A table is a symmetric arrangement of statistical data in rows and columns. Rows are horizontal arrangements whereas columns are vertical arrangements. • Types of Tabulation 1. Simple Tabulation or One-way Tabulation 2. Double Tabulation or Two-way Tabulation 3. Complex Tabulation
  • 4.
    Objectives • To carryout investigations • To do comparisons • To locate omissions and errors in the data • To use space economically • To study the trends • To simplify data • To use it as future references
  • 5.
    Importance of tabulation •Under tabulation, data is divided into various parts and for each part there are totals and sub totals. Therefore, relationship between different parts can be easily known. • Since data are arranged in a table with a title and a number so these can be easily identified and used for the required purpose • Tabulation makes the data brief. Therefore, it can be easily presented in the form of graphs. • Tabulation presents the numerical figures in an attractive form.
  • 6.
    Importance of tabulation •Tabulation makes complex data simple and as a result of this, it becomes easy to understand the data. • This form of the presentation of data is helpful in finding mistakes. • Tabulation is useful in condensing the collected data.
  • 7.
    Importance of tabulation •Tabulation makes it easy to analyze the data from tables. • Tabulation is a very cheap mode to present the data. It saves time as well as space. • Tabulation is a device to summaries the large scattered data. So, the maximum information may be collected from these tables.
  • 8.
    Characteristics of goodtable There are no hard and fast rules for the tabulation of data but for constructing good table, following general rules should be observed while tabulating statistical data. • The table should suit the size of the paper and, therefore, the width of the column should be decided before hand. • Number of columns and rows should neither be too large nor too small. • As far as possible figures should be approximated before tabulation. This would reduce unnecessary details.
  • 9.
    Cont- • Items shouldbe arranged either in alphabetical, chronological or geographical order or according to size. • The sub-total and total of the items of the table must be written. • Percentages are given in the tables if necessary. • Ditto marks should not be used in a table because sometimes it create confusion. • Table should be simple and attractive.
  • 10.
    Cont- • A tableshould be logical, well-balanced in length and breadth and the comparable columns should be placed side by side. • Light/heavy/thick or double rulings may be used to distinguish sub columns, main columns and totals. • For large data more than one table may be used.
  • 11.
    Parts of Idealtable Table number: A number must be allotted to the table for identification, particularly when there are many tables in a study. Title: The title should explain what is contained in the table. It should be clear, brief and set in bold type on top of the table. It should also indicate the time and place to which the data refer.
  • 12.
    Cont- Date: The date ofpreparation of the table should be given. Stubs or Row designations: Each row of the table should be given a brief heading. Such designations of rows are called “stubs”, or, “stub items” and the entire column is called “stub column”. Column headings or Captions: Column designation is given on top of each column to explain to what the figures in the column refer. It should be clear and precise. This is called a “caption”, or, “heading”. columns should be numbered if there are four, or, more columns.
  • 13.
    Cont- Body of thetable: The data should be arranged in such a way that any figure can be located easily. Various types of numerical variables should be arranged in an ascending order, i.e., from left to right in rows and from top to bottom in columns. Column and row totals should be given. Unit of measurement: If the unit of measurement is uniform throughout the table, it is stated at the top right-hand corner of the table along with the title. If different rows and columns contain figures in different units, the units may be stated along with “stubs”, or, “captions”. Very large figures may be rounded up but the method of rounding should be explained.
  • 14.
    Cont- Source: At the bottomof the table a note should be added indicating the primary and secondary sources from which data have been collected Footnotes and references: If any item has not been explained properly, a separate explanatory note should be added at the bottom of the table.
  • 15.
    Conclusions • Thus,In theprocess of tabulation of data, unnecessary details are avoided and data are presented systematically in columns and rows in a concise form. All tabular data re presented in such a manner that they become more meaningful and can be easily understood by a common man.
  • 16.
    Reference • https://en.m.wiktionary.org/wiki/tabulation • https://www.emathzone.com/tutorials/basic- statistics/tabulation-of-data.html •https://www.slideshare.net/mobile/NirmalSin gh33/tabulation-41860260 • https://blog.socialcops.com/academy/resourc es/cross-tabulation-how-why/
  • 17.