The above document involves Processing and analysis of data is an essential step followed after data collection from primary and secondary sources such as questionaries and surveys. the steps involved in data processing and data processing.
Introduction
• Necessity ofData Processing and Analysis
• Essential following data collection from sources like surveys and questionnaires.
• Ensures the availability of all relevant data for meaningful comparisons and analysis.
• Crucial for any specific study to derive accurate and useful insights.
• Defining Data Processing
• Involves transforming raw, collected data into a structured and usable format.
• Encompasses key stages such as editing, coding, classification, and tabulation.
tabulation.
• Prepares the data, making it amenable for subsequent analysis.
• Defining Data Analysis
• Refers to the application of various statistical and logical techniques.
• Aims to interpret the processed data effectively.
• Ultimately serves to answer specific research questions.
3.
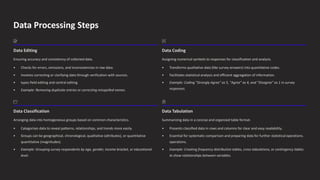
Data Processing Steps
DataEditing
Ensuring accuracy and consistency of collected data.
• Checks for errors, omissions, and inconsistencies in raw data.
• Involves correcting or clarifying data through verification with sources.
• types field editing and central editing
• Example: Removing duplicate entries or correcting misspelled names.
Data Coding
Assigning numerical symbols to responses for classification and analysis.
• Transforms qualitative data (like survey answers) into quantitative codes.
• Facilitates statistical analysis and efficient aggregation of information.
• Example: Coding "Strongly Agree" as 5, "Agree" as 4, and "Disagree" as 1 in survey
responses.
Data Classification
Arranging data into homogeneous groups based on common characteristics.
• Categorizes data to reveal patterns, relationships, and trends more easily.
• Groups can be geographical, chronological, qualitative (attributes), or quantitative
quantitative (magnitudes).
• Example: Grouping survey respondents by age, gender, income bracket, or educational
level.
Data Tabulation
Summarizing data in a concise and organized table format.
• Presents classified data in rows and columns for clear and easy readability.
• Essential for systematic comparison and preparing data for further statistical operations.
operations.
• Example: Creating frequency distribution tables, cross-tabulations, or contingency tables
to show relationships between variables.
4.
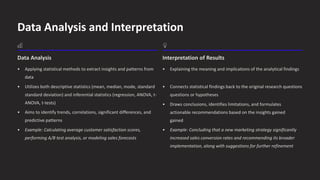
Data Analysis andInterpretation
Data Analysis
• Applying statistical methods to extract insights and patterns from
data
• Utilizes both descriptive statistics (mean, median, mode, standard
standard deviation) and inferential statistics (regression, ANOVA, t
ANOVA, t-
-
tests)
• Aims to identify trends, correlations, significant differences, and
predictive patterns
• Example: Calculating average customer satisfaction scores,
performing A/B test analysis, or modeling sales forecasts
Interpretation of Results
• Explaining the meaning and implications of the analytical findings
• Connects statistical findings back to the original research questions
questions or hypotheses
• Draws conclusions, identifies limitations, and formulates
actionable recommendations based on the insights gained
gained
• Example: Concluding that a new marketing strategy significantly
increased sales conversion rates and recommending its broader
implementation, along with suggestions for further refinement
5.
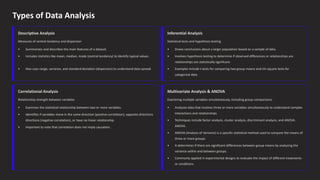
Types of DataAnalysis
Descriptive Analysis
Measures of central tendency and dispersion
• Summarizes and describes the main features of a dataset.
• Includes statistics like mean, median, mode (central tendency) to identify typical values.
• Also uses range, variance, and standard deviation (dispersion) to understand data spread.
Inferential Analysis
Statistical tests and hypothesis testing
• Draws conclusions about a larger population based on a sample of data.
• Involves hypothesis testing to determine if observed differences or relationships are
relationships are statistically significant.
• Examples include t-tests for comparing two group means and chi-square tests for
categorical data.
Correlational Analysis
Relationship strength between variables
• Examines the statistical relationship between two or more variables.
• Identifies if variables move in the same direction (positive correlation), opposite directions
directions (negative correlation), or have no linear relationship.
• Important to note that correlation does not imply causation.
Multivariate Analysis & ANOVA
Examining multiple variables simultaneously, including group comparisons.
• Analyzes data that involves three or more variables simultaneously to understand complex
interactions and relationships.
• Techniques include factor analysis, cluster analysis, discriminant analysis, and ANOVA.
ANOVA.
• ANOVA (Analysis of Variance) is a specific statistical method used to compare the means of
three or more groups.
• It determines if there are significant differences between group means by analyzing the
variance within and between groups.
• Commonly applied in experimental designs to evaluate the impact of different treatments
or conditions.