By:-
-Ankita Shrestha
-Luna Regmi
-Nilu Sharma
-Sujita Thapa
-Shivam Mudbhari
Emba 2nd semester
Unit 4: DATA REDUCTION AND ANALYSIS
Unit 5: Writing Research Report
Unit 4: Data Reduction and analysis
Data preparation
Data preparation includes editing, coding, and data entry, this is the activity that ensures the accuracy
of the of the data and their conversion from raw form to reduced and classified forms that are more
appropriate for analysis. Preparing a descriptive statistical summary is another preliminary step leading
to an understanding of the collected data. It is the step where data entry errors may be revealed and
corrected
Editing
Editing detects errors and omission, corrects them when possible and certifies that maximum data
qualify standards are achieved. The editors purpose is to guarantee that the data are accurate.
-consistent with the intent of the questions and other information in the survey
-uniformly entered
-Complete
-Arranged to simplify coding and tabulation.
Coding
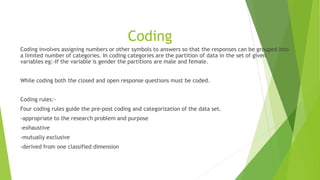
Coding involves assigning numbers or other symbols to answers so that the responses can be grouped into
a limited number of categories. In coding categories are the partition of data in the set of given
variables eg:-If the variable is gender the partitions are male and female.
While coding both the closed and open response questions must be coded.
Coding rules:-
Four coding rules guide the pre-post coding and categorization of the data set.
-appropriate to the research problem and purpose
-exhaustive
-mutually exclusive
-derived from one classified dimension
Transcribing
Data transformation, a variation of data coding, is a process of changing the original numerical
representation of quantitative value to another value.
It is done to avoid problems in the next stage of data analysis process.
For example:-
Economist often use a logarithm transformation so that the data are more evenly distributed.
Tabulating
Tabulation is a systematic and logical representation of numeric data in rows and columns ta
facilitate comparison and statistical analysis. It help in statistical analysis as well as
interpretation.
Objective of tabulation
-to simplify complex data
-to bring out essential features of data
-to facilitate comparison
-to facilitate statistical analysis
-to save space
Cross tabulation
Cross tabulation is a method to qualitatively analyze the relationship between multiple variables in a
table. It is also known as contingency tables or cross tables.
Cross tabulation is a process of comparing data from two or more categorical values such as gender
and selection by one’s company for overseas assignment.
-cross tabulation is used with demographic variables and study’s target variables.
-cross tabulation is first step for identifying relationship between the variables.
Cross tabulation shows how correlation chains from one variable grouping to another and is used in
statistical analysis to find patterns or trends with in raw data.
Example of cross tabulation
Simple table Cross Tabulation
Gender Car Type
M SUV
F SEDAN
F SUV
M SUV
F SUV
M SEDAN
M SEDAN
F SUV
TYPE OF CAR
GENDER SUV SEDAN TOTAL
M 2 2 4
F 3 1 4
TOTAL 5 3 8
• Cross table can correlate different variables row wise column wise and it is easy to
analyze and save the time .
Hypothesis testing
Hypothesis testing usually explains the nature of certain relationship established, the
differences among the groups or the independence of two or more factors in a situation.
The purpose of hypothesis testing is to determine the accuracy of the your hypothesis due to
the fact that you have collected the sample of data not a census.
Example:-
A marketing manager wants to know if the sales of the company will increase if he doubles the
advertising rupees. Here, the manager would like to know the nature of the relationship that
may be established between advertise and sales by testing the hypothesis. If the advertising
increases the sales also will increase.
Measures of association
Researchers are often interested in estimating the degree of association between nominal variables or categorical
variables , such as association between the sex and state of anxiety or between attitudes toward a social issue. A
measure of association is a numerical value that tells us how strongly related, the two variables are.
There are several characteristics of good measure of association.
-the range from the value 0 to 1 (no relationship to strongest possible relationship)
-for variable that have an underlying order from low to high they can be positive or negative.
-some measure specify which variable is dependent and which is independent.
Some measures used to find out relationship between variables are
-Interval and ratio
-Ordinal
-Nominal
Multivariate analysis
It is the more complex form of statistical analysis and uses only when there are more than two
variables in data set.
Multivariate analysis “those statistical technique used which focus upon, and bring out in bold relief,
the structure of simultaneous relationship among three or more phenomena”.
The choice of technique used is guided by number of dependent and independent variables involved
and whether they are measured on metric and non metric scales.
Multivariate analysis includes cluster analysis, factor analysis, discriminant analysis, MANOVA,
conjoint analysis.
Example of multivariate analysis
• A doctor has collected data on cholesterol, blood pressure and weight .She also
collected data on eating habits of the subject( how many ounces of red meat,
fish ,dairy product and chocolate consumed per week).She wants to investigate
the relationship between the three measures of health and eating habits.
This is instance of multivariate analysis and researcher would required to
understand the relationship of each variables with each other.
Past Question:
2020 (Spring)(-Write short notes on coding
(slide no:5)

Unit 4 Data Reduction.pdf

  • 1.
    By:- -Ankita Shrestha -Luna Regmi -NiluSharma -Sujita Thapa -Shivam Mudbhari Emba 2nd semester Unit 4: DATA REDUCTION AND ANALYSIS Unit 5: Writing Research Report
  • 2.
    Unit 4: DataReduction and analysis
  • 3.
    Data preparation Data preparationincludes editing, coding, and data entry, this is the activity that ensures the accuracy of the of the data and their conversion from raw form to reduced and classified forms that are more appropriate for analysis. Preparing a descriptive statistical summary is another preliminary step leading to an understanding of the collected data. It is the step where data entry errors may be revealed and corrected
  • 4.
    Editing Editing detects errorsand omission, corrects them when possible and certifies that maximum data qualify standards are achieved. The editors purpose is to guarantee that the data are accurate. -consistent with the intent of the questions and other information in the survey -uniformly entered -Complete -Arranged to simplify coding and tabulation.
  • 5.
    Coding Coding involves assigningnumbers or other symbols to answers so that the responses can be grouped into a limited number of categories. In coding categories are the partition of data in the set of given variables eg:-If the variable is gender the partitions are male and female. While coding both the closed and open response questions must be coded. Coding rules:- Four coding rules guide the pre-post coding and categorization of the data set. -appropriate to the research problem and purpose -exhaustive -mutually exclusive -derived from one classified dimension
  • 6.
    Transcribing Data transformation, avariation of data coding, is a process of changing the original numerical representation of quantitative value to another value. It is done to avoid problems in the next stage of data analysis process. For example:- Economist often use a logarithm transformation so that the data are more evenly distributed.
  • 7.
    Tabulating Tabulation is asystematic and logical representation of numeric data in rows and columns ta facilitate comparison and statistical analysis. It help in statistical analysis as well as interpretation. Objective of tabulation -to simplify complex data -to bring out essential features of data -to facilitate comparison -to facilitate statistical analysis -to save space
  • 8.
    Cross tabulation Cross tabulationis a method to qualitatively analyze the relationship between multiple variables in a table. It is also known as contingency tables or cross tables. Cross tabulation is a process of comparing data from two or more categorical values such as gender and selection by one’s company for overseas assignment. -cross tabulation is used with demographic variables and study’s target variables. -cross tabulation is first step for identifying relationship between the variables. Cross tabulation shows how correlation chains from one variable grouping to another and is used in statistical analysis to find patterns or trends with in raw data.
  • 9.
    Example of crosstabulation Simple table Cross Tabulation Gender Car Type M SUV F SEDAN F SUV M SUV F SUV M SEDAN M SEDAN F SUV TYPE OF CAR GENDER SUV SEDAN TOTAL M 2 2 4 F 3 1 4 TOTAL 5 3 8 • Cross table can correlate different variables row wise column wise and it is easy to analyze and save the time .
  • 10.
    Hypothesis testing Hypothesis testingusually explains the nature of certain relationship established, the differences among the groups or the independence of two or more factors in a situation. The purpose of hypothesis testing is to determine the accuracy of the your hypothesis due to the fact that you have collected the sample of data not a census. Example:- A marketing manager wants to know if the sales of the company will increase if he doubles the advertising rupees. Here, the manager would like to know the nature of the relationship that may be established between advertise and sales by testing the hypothesis. If the advertising increases the sales also will increase.
  • 11.
    Measures of association Researchersare often interested in estimating the degree of association between nominal variables or categorical variables , such as association between the sex and state of anxiety or between attitudes toward a social issue. A measure of association is a numerical value that tells us how strongly related, the two variables are. There are several characteristics of good measure of association. -the range from the value 0 to 1 (no relationship to strongest possible relationship) -for variable that have an underlying order from low to high they can be positive or negative. -some measure specify which variable is dependent and which is independent. Some measures used to find out relationship between variables are -Interval and ratio -Ordinal -Nominal
  • 12.
    Multivariate analysis It isthe more complex form of statistical analysis and uses only when there are more than two variables in data set. Multivariate analysis “those statistical technique used which focus upon, and bring out in bold relief, the structure of simultaneous relationship among three or more phenomena”. The choice of technique used is guided by number of dependent and independent variables involved and whether they are measured on metric and non metric scales. Multivariate analysis includes cluster analysis, factor analysis, discriminant analysis, MANOVA, conjoint analysis.
  • 13.
    Example of multivariateanalysis • A doctor has collected data on cholesterol, blood pressure and weight .She also collected data on eating habits of the subject( how many ounces of red meat, fish ,dairy product and chocolate consumed per week).She wants to investigate the relationship between the three measures of health and eating habits. This is instance of multivariate analysis and researcher would required to understand the relationship of each variables with each other.
  • 14.
    Past Question: 2020 (Spring)(-Writeshort notes on coding (slide no:5)