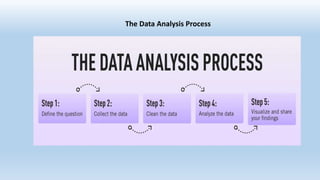
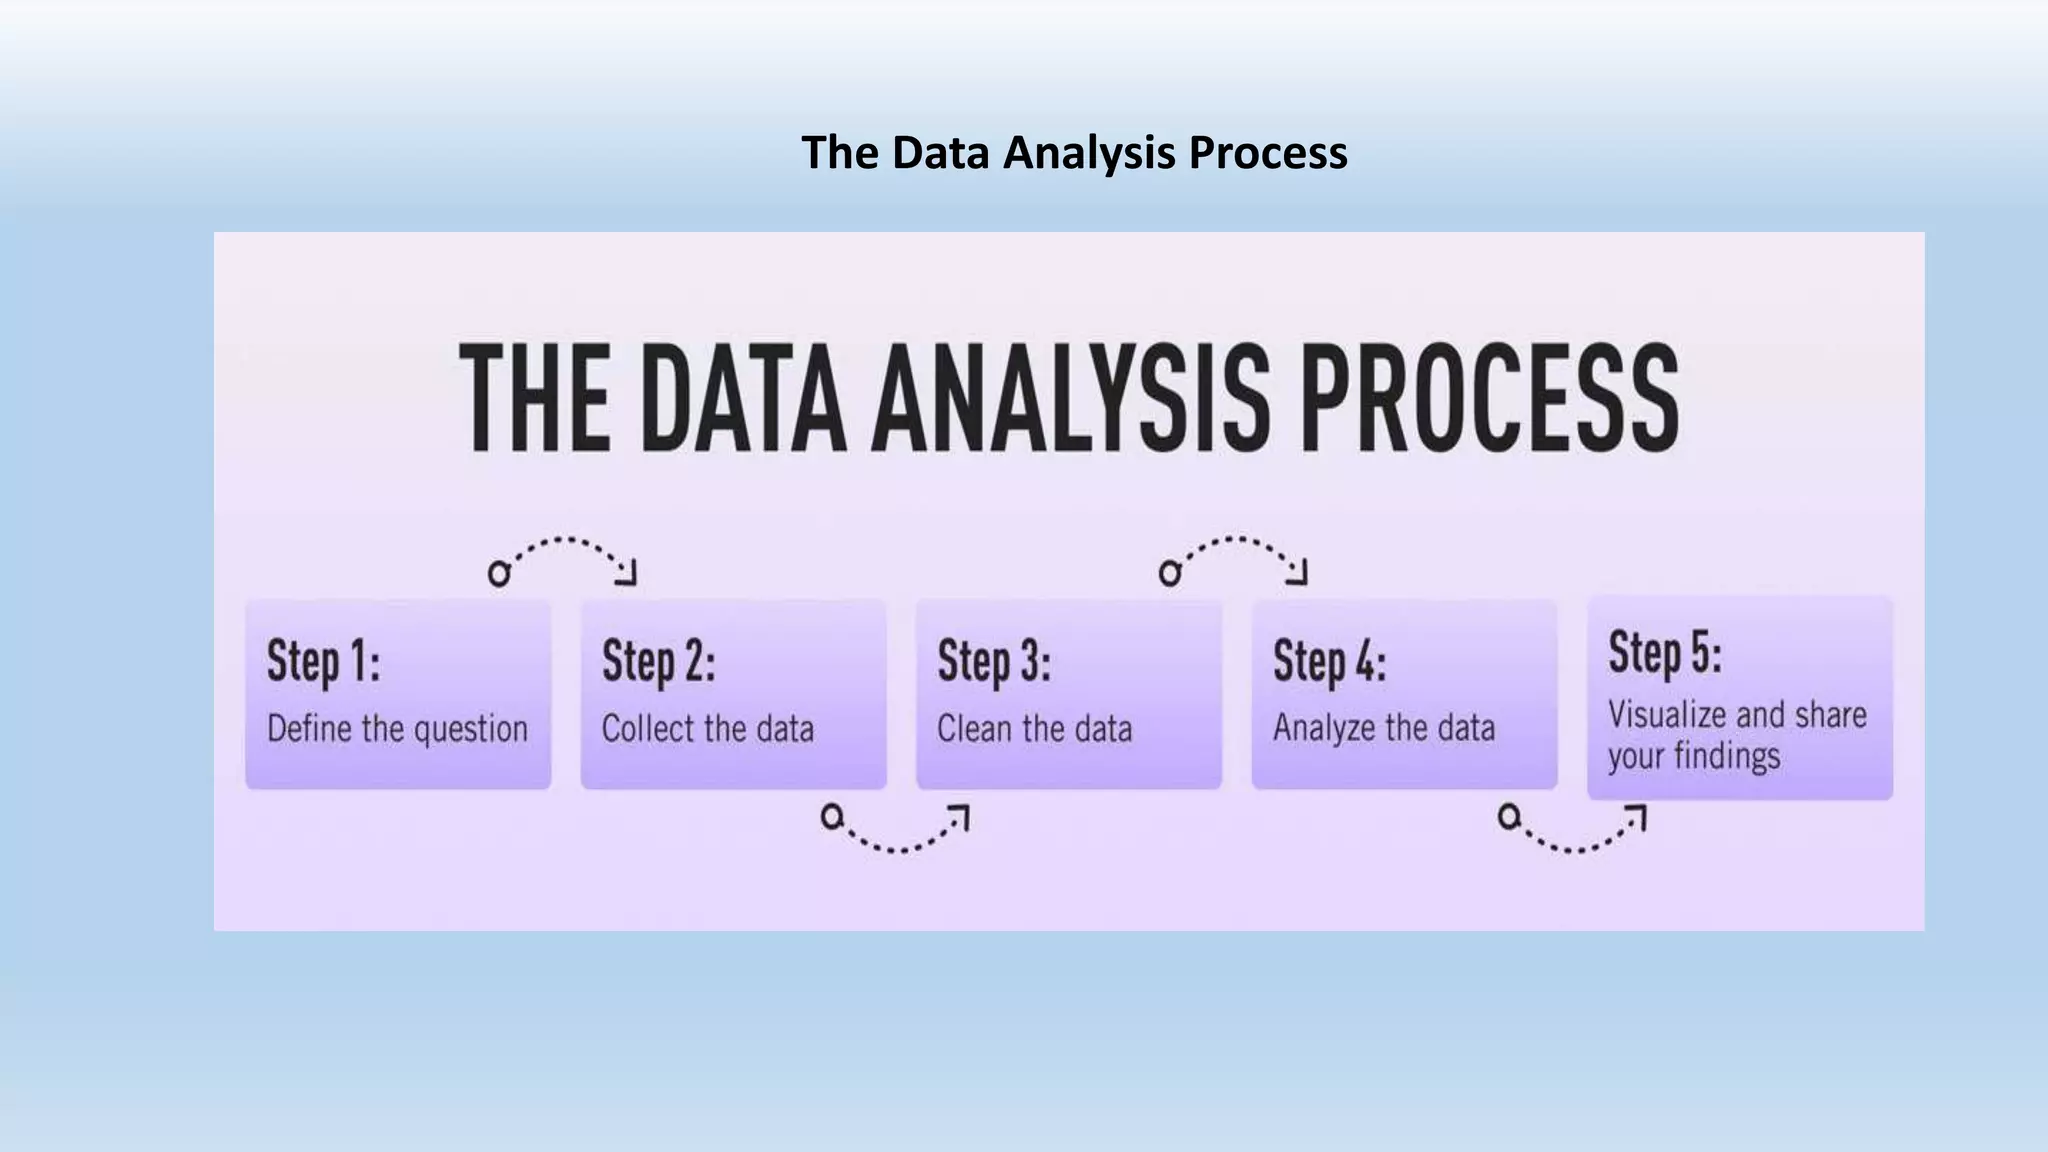
The Data Analysis Process
1. Step one: Defining the question
The first step in any data analysis process is to define your objective. In
data analytics jargon, this is sometimes called the ‘problem statement’.
Defining your objective means coming up with a hypothesis and
figuring how to test it. Start by asking: What business problem am I
trying to solve?
For instance, your organization’s senior management might pose an
issue, such as: “Why are we losing customers?”
A data analyst’s job is to understand the business and its goals in
enough depth that they can frame the problem the right way.
2. Step two: Collecting the data
Once you’ve established your objective, you’ll need to create a strategy
for collecting and aggregating the appropriate data. A key part of this is
determining which data you need.
This might be quantitative (numeric) data, e.g. sales figures, or
qualitative (descriptive) data, such as customer reviews. All data fit into
one of three categories: first-party, second-party, and third-party data.
3. Step three: Cleaning the data
• Once you’ve collected your data, the next step is to get it ready for analysis.
This means cleaning, or ‘scrubbing’ it, and is crucial in making sure that
you’re working with high-quality data. Key data cleaning tasks include:
• Removing major errors, duplicates, and outliers—all of which are
inevitable problems when aggregating data from numerous sources.
• Removing unwanted data points—extracting irrelevant observations that
have no bearing on your intended analysis.
• Bringing structure to your data—general ‘housekeeping’, i.e. fixing typos
or layout issues, which will help you map and manipulate your data more
easily.
• Filling in major gaps—as you’re tidying up, you might notice that
important data are missing. Once you’ve identified gaps, you can go about
filling them.
4. Step four: Analyzing the data
• Finally, you’ve cleaned your data.
• The type of data analysis you carry out largely depends on what your
goal is. But there are many techniques available.
• Univariate or bivariate analysis, time-series analysis, and regression
analysis are just a few you might have heard of. More important than
the different types, though, is how you apply them.
5. Step five: Sharing your results
This is more complex than simply sharing the raw results of your
work—it involves interpreting the outcomes, and presenting them.
Data analysts commonly use reports, dashboards, and interactive
visualizations to support their findings.
There are lot of data visualization tools available, suited to different
experience levels. Popular tools requiring little or no coding skills
include Google Charts, Tableau, Data wrapper, and Infogram.
6. Summary
• Define the question—What business problem are you trying to solve?
Frame it as a question to help you focus on finding a clear answer.
• Collect data—Create a strategy for collecting data. Which data sources are
most likely to help you solve your business problem?
• Clean the data—Explore, scrub, tidy, de-dupe, and structure your data as
needed. Do whatever you have to! But don’t rush…take your time!
• Analyze the data—Carry out various analyses to obtain insights. Focus on
the four types of data analysis: descriptive, diagnostic, predictive, and
prescriptive.
• Share your results—How best can you share your insights and
recommendations? A combination of visualization tools and
communication is key.

Steps in data analysis.pptx

  • 1.
  • 2.
    1. Step one:Defining the question The first step in any data analysis process is to define your objective. In data analytics jargon, this is sometimes called the ‘problem statement’. Defining your objective means coming up with a hypothesis and figuring how to test it. Start by asking: What business problem am I trying to solve? For instance, your organization’s senior management might pose an issue, such as: “Why are we losing customers?” A data analyst’s job is to understand the business and its goals in enough depth that they can frame the problem the right way.
  • 3.
    2. Step two:Collecting the data Once you’ve established your objective, you’ll need to create a strategy for collecting and aggregating the appropriate data. A key part of this is determining which data you need. This might be quantitative (numeric) data, e.g. sales figures, or qualitative (descriptive) data, such as customer reviews. All data fit into one of three categories: first-party, second-party, and third-party data.
  • 4.
    3. Step three:Cleaning the data • Once you’ve collected your data, the next step is to get it ready for analysis. This means cleaning, or ‘scrubbing’ it, and is crucial in making sure that you’re working with high-quality data. Key data cleaning tasks include: • Removing major errors, duplicates, and outliers—all of which are inevitable problems when aggregating data from numerous sources. • Removing unwanted data points—extracting irrelevant observations that have no bearing on your intended analysis. • Bringing structure to your data—general ‘housekeeping’, i.e. fixing typos or layout issues, which will help you map and manipulate your data more easily. • Filling in major gaps—as you’re tidying up, you might notice that important data are missing. Once you’ve identified gaps, you can go about filling them.
  • 5.
    4. Step four:Analyzing the data • Finally, you’ve cleaned your data. • The type of data analysis you carry out largely depends on what your goal is. But there are many techniques available. • Univariate or bivariate analysis, time-series analysis, and regression analysis are just a few you might have heard of. More important than the different types, though, is how you apply them.
  • 6.
    5. Step five:Sharing your results This is more complex than simply sharing the raw results of your work—it involves interpreting the outcomes, and presenting them. Data analysts commonly use reports, dashboards, and interactive visualizations to support their findings. There are lot of data visualization tools available, suited to different experience levels. Popular tools requiring little or no coding skills include Google Charts, Tableau, Data wrapper, and Infogram.
  • 7.
    6. Summary • Definethe question—What business problem are you trying to solve? Frame it as a question to help you focus on finding a clear answer. • Collect data—Create a strategy for collecting data. Which data sources are most likely to help you solve your business problem? • Clean the data—Explore, scrub, tidy, de-dupe, and structure your data as needed. Do whatever you have to! But don’t rush…take your time! • Analyze the data—Carry out various analyses to obtain insights. Focus on the four types of data analysis: descriptive, diagnostic, predictive, and prescriptive. • Share your results—How best can you share your insights and recommendations? A combination of visualization tools and communication is key.