Downloaded 135 times

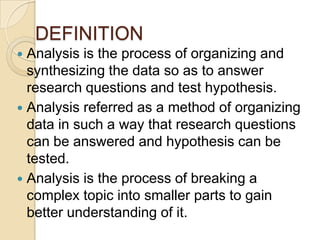


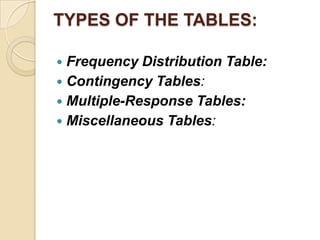
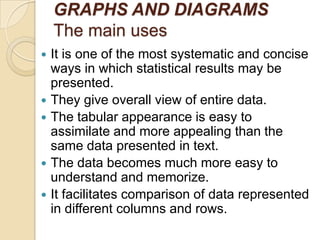
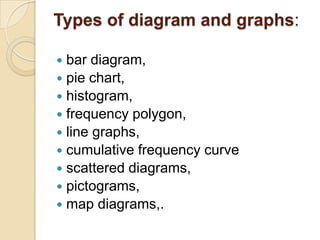
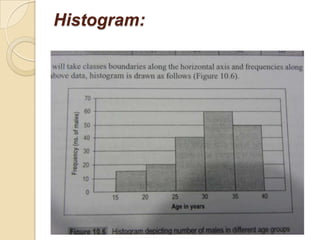
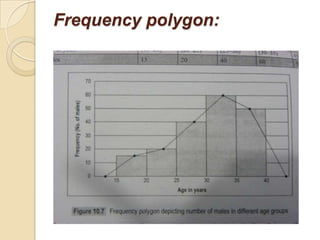
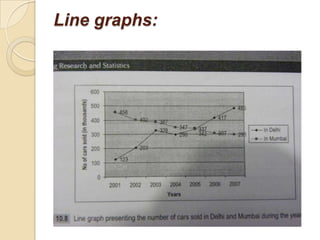
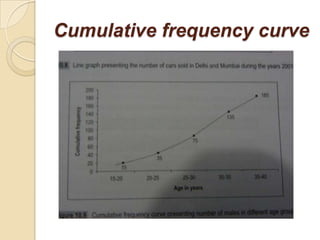


This document outlines the process of quantitative data analysis. It discusses defining analysis, the steps including data preparation, describing data, drawing inferences, and interpreting results. Descriptive statistics are also covered, such as measures to condense data through tables, charts and graphs. Specific graphs explained include bar diagrams, pie charts, histograms, frequency polygons, line graphs and more. The document provides details on quantitative data analysis methodology.