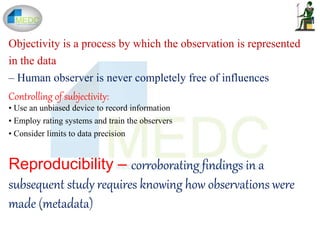
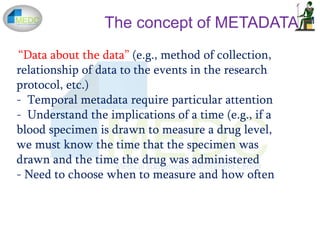
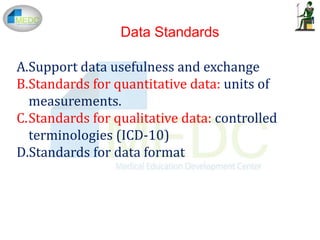
Downloaded 740 times


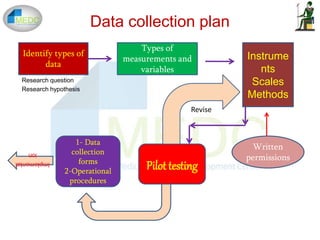


![Types of Data
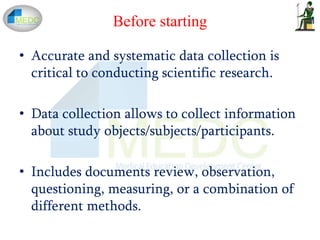
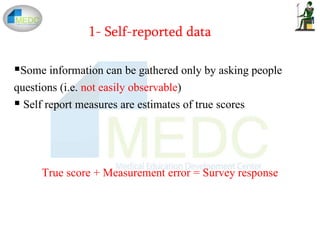
I- Quantitative data - measurements that can be manipulated
mathematically
• Precision - body temperature, serum chloride , absolute
eosinophil count.
II- Qualitative data - conceptual entities rather than numeric
values (subject gender and race, signs and symptoms,
diagnoses)
• May represent concepts that relate to quantitative data
[“blood pressure” is numeric, but the procedures themselves
are qualitative]
III- Ordinal data look like numbers (e.g., urine protein
measurements “0”, “1+”, “2+”, etc.)
IV- Signal data - quantitative in nature but are treated as
qualitative (e.g., electrocardiogram tracings)](https://image.slidesharecdn.com/datacollectionfinal-161221060532/85/Data-collection-24-320.jpg)
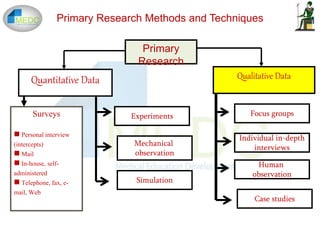
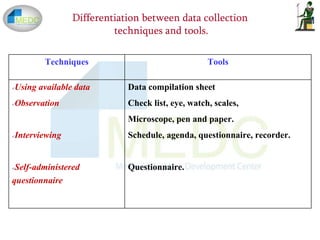


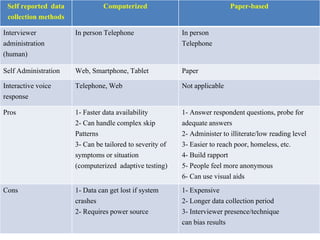


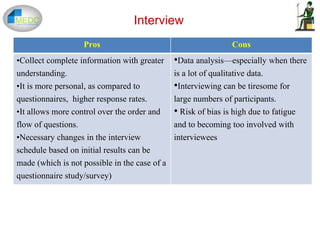


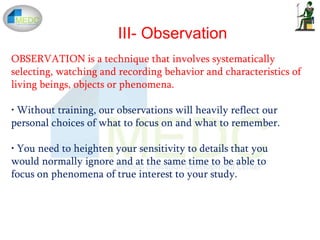


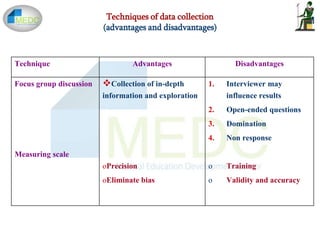


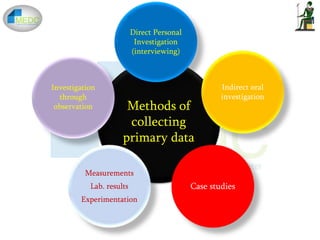
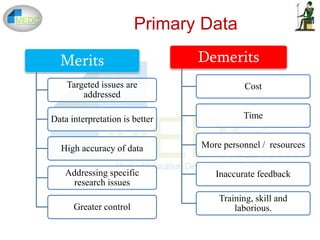
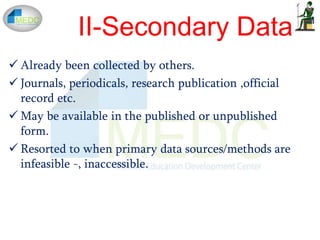
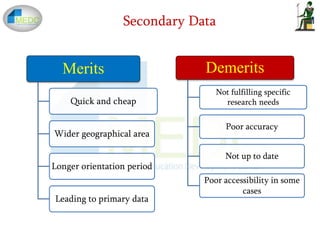
This document discusses various methods and instruments for collecting data in research studies. It begins by defining data and explaining why data collection is important. It then covers primary and secondary sources of data, as well as internal and external sources. The main methods of collecting primary data discussed are direct personal investigation through interviews, indirect oral investigation, case studies, measurements, and observation. Secondary data sources include published and unpublished sources. The document also discusses self-reported data collection methods like surveys, interviews, and questionnaires. Other methods covered include document review, focus groups, and observation. Mixed methods are also briefly discussed.


![Medical statistics Basic concept and applications [Square one]](https://cdn.slidesharecdn.com/ss_thumbnails/medicalstatisticsl123m-131208222631-phpapp02-thumbnail.jpg?width=640&height=640&fit=bounds)


![Hypothalamus short ppt by Dr. Neha [PT].pptx](https://cdn.slidesharecdn.com/ss_thumbnails/hypothalamusbydr-260124145759-b9f94a93-thumbnail.jpg?width=640&height=640&fit=bounds)


