Downloaded 124 times
![Applications Of Colorimeter
• Estimation of biochemical compounds in blood,
plasma, serum, CSF, urine, etc.:
– Glucose
– Urea
– Creatinine
– UricAcid
– Bilirubin
– Lipids
– Total Proteins
– Enzymes [e.g.ALT, AST,ALP]
– Minerals [Calcium, Phosphorus etc.] etc….](https://image.slidesharecdn.com/colorimetryspectrophotometry-210523064656/85/Colorimetry-spectrophotometry-33-320.jpg)
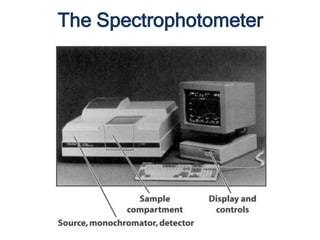
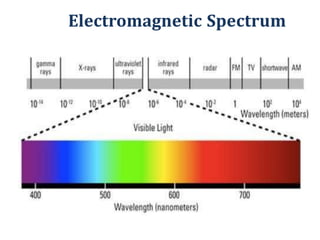
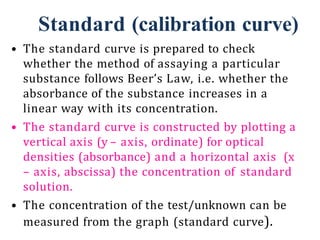
![Introduction
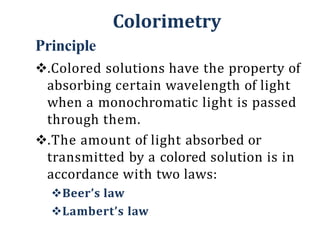
• Spectrophotometer:
a) Single-beam
b) Double-beam
4
[41
]](https://image.slidesharecdn.com/colorimetryspectrophotometry-210523064656/85/Colorimetry-spectrophotometry-38-320.jpg)
![Instruments
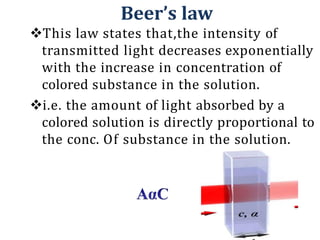
• Light source: provide a sufficient of light which is
suitable for marking a measurement.
• The light source typically yields a high output of
polychromatic light over a wide range of the
spectrum.[4]
42](https://image.slidesharecdn.com/colorimetryspectrophotometry-210523064656/85/Colorimetry-spectrophotometry-39-320.jpg)
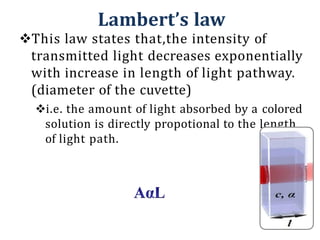
![Common monochromators:
⚫Filter
⚫Prism
⚫Diffraction grating
⚫Interference filter
• Monochromator : Accepts polychromatic input light from
a lamp and outputs monochromatic light.
• Monochromator consists of these parts:
I. Entrance slit
II.Collimating lens or mirror
III.Dispersion element
IV.Focusing lens or mirror
V.Exit slit [6]
43](https://image.slidesharecdn.com/colorimetryspectrophotometry-210523064656/85/Colorimetry-spectrophotometry-40-320.jpg)
![Instruments
• Dispersion devices: Aspecial plate with hundreds
of parallel grooved lines.
• The grooved lines act to separate the white light into
the visible light spectrum.
44
The more lines
the smaller
the wavelength
resolution.[5]](https://image.slidesharecdn.com/colorimetryspectrophotometry-210523064656/85/Colorimetry-spectrophotometry-41-320.jpg)
![Instruments
• Focusing devices: Combinations of lenses, slits,
and mirrors.
• relay and focus light through the instrument.[2]
45](https://image.slidesharecdn.com/colorimetryspectrophotometry-210523064656/85/Colorimetry-spectrophotometry-42-320.jpg)
![Instruments
• Cuvettes: designed to hold samples for spectroscopic
experiments. made of Plastic, glass or optical grade
quartz
• should be as clear as possible, without impurities that
might affect a spectroscopic reading.[2]
46](https://image.slidesharecdn.com/colorimetryspectrophotometry-210523064656/85/Colorimetry-spectrophotometry-43-320.jpg)
![Instruments
• Detectors: Convert radiant energy (photons) into an
electrical signal.
The photocell and phototube are the simplest
photodetectors, producing current proportional to the
intensity of the light striking Them .[1],[2]
47](https://image.slidesharecdn.com/colorimetryspectrophotometry-210523064656/85/Colorimetry-spectrophotometry-44-320.jpg)
![Instruments
• Display devices: The data from a detector are
displayed by a readout device, such as an analog meter,
a light beam reflected on a scale, or a digital display , or
LCD .
• The output can also be transmitted to a computer or
printer. [3]
48](https://image.slidesharecdn.com/colorimetryspectrophotometry-210523064656/85/Colorimetry-spectrophotometry-45-320.jpg)
![Applications
1. Concentration measurement
– Prepare samples
– Make series of standard solutions of known concentrations
[4]
49](https://image.slidesharecdn.com/colorimetryspectrophotometry-210523064656/85/Colorimetry-spectrophotometry-46-320.jpg)
![Applications
– Set spectrophotometer to the λ of maximum light
absorption
– Measure the absorption of the unknown, and from the
standard plot, read the related concentration[4]
50](https://image.slidesharecdn.com/colorimetryspectrophotometry-210523064656/85/Colorimetry-spectrophotometry-47-320.jpg)
![Applications
2. Detection of Impurities
• UV absorption spectroscopy is one of the
best methods for determination of impurities in organic
molecules. [7]
51
Additional peaks can be
observed due to impurities
in the sample and it can be
compared with that of
standard raw material.](https://image.slidesharecdn.com/colorimetryspectrophotometry-210523064656/85/Colorimetry-spectrophotometry-48-320.jpg)
![Applications
3. Structure elucidation of organic compounds.
• From the location of peaks and combination of peaks
UV spectroscopy elucidate structure of organic
molecules:
o the presence or absence of unsaturation,
o the presence of hetero atoms.[7]
52](https://image.slidesharecdn.com/colorimetryspectrophotometry-210523064656/85/Colorimetry-spectrophotometry-49-320.jpg)
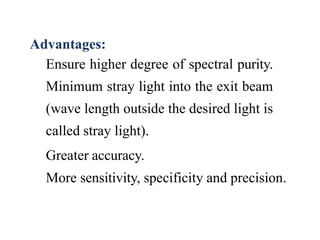
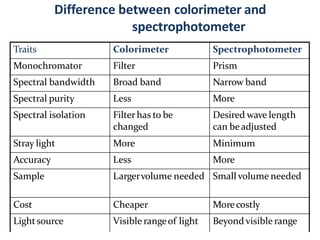

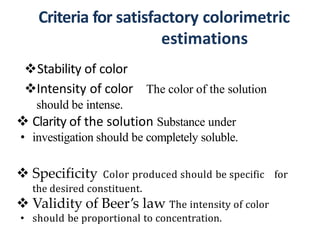
The document discusses colorimetry and spectrophotometry. Colorimetry uses photometric principles to measure the intensity of light absorbed or transmitted by colored compounds. It relies on Beer's Law, which states that absorbance is directly proportional to concentration. Spectrophotometry uses a monochromator to isolate specific wavelengths from a light source and measure absorption across the electromagnetic spectrum. It provides more accurate measurements than colorimetry due to its ability to select narrow bandwidths of light and minimize stray light. Both techniques are used to determine concentrations of analytes in solutions.


![CASE_PRESENTATION_ON_subdural_hematoma(SDH)[1 FINAL PPT]-1.pptx](https://cdn.slidesharecdn.com/ss_thumbnails/casepresentationonsubduralhematomasdh1finalppt-1-260129172522-d405d375-thumbnail.jpg?width=640&height=640&fit=bounds)


