SlideShare a Scribd company logo
Introduction
• Photometry is the most common analytical technique
used in the biochemical laboratory. It is designed to
measure the intensity of a beam of light.
• Photometric principles are applied to the several kinds
of analytical techniques:
(a) where absorbed or transmitted light is measured:
• Colorimetry
• Spectrophotometry
• Atomic absorption, and
• Turbidometry
(b) where emitted light is measured:
• Flame emission photometry
Introduction (cont.)
• The components of most photoelectric colorimeters are
basically the same and the basic method of operation is
also similar for all the instruments.
• In analytical chemistry, Colorimetry is a technique
“used to determine the concentration of colored
compounds (analytes) in sample solution” at visible
spectrum of light (400 – 800 nm).
Colorimetry
Principle:
Colored solutions have the property of absorbing certain
wavelength of light when a monochromatic light is passed
through them.
• The amount of light absorbed or transmitted by a
colored solution is in accordance with two laws:
– Beer’s law
– Lambert’s law
Beer’s law :
• When a monochromatic light passes through a colored
solution, amount of light transmitted decreases
exponentially with increase in concentration of colored
substance.
– i.e. the amount of light absorbed by a colored solution is
directly proportion to the conc. Of substance in the colored
solution.
Beer’s law
Beer’s law
Lambert’s law :
• The amount of light transmitted decreases
exponentially with increase in path length (diameter) of
the cuvette or thickness of colored solution through
which light passes.
– i.e. the amount of light absorbed by a colored solution
depends on path length of cuvette or thickness or depth of
the colored solution.
Relationship between absorbance and
transmittance
OD %T
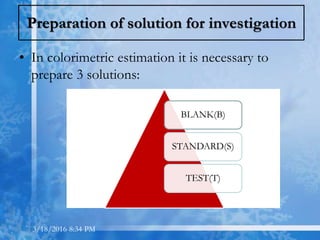
Preparation of solution for investigation
• In colorimetric estimation it is necessary to
prepare 3 solutions:
BLANK(B)
STANDARD(S)
TEST(T)
3/18/2016 8:34 PM
BLANK
To eliminate the effect of light
absorption by the reagent used
Water BLANK
Reagent BLANK
STANDARD
Solution of known concentration of
the substance
Both O.D and
concentration are
known
So concentration of
unknown can be
calculated
TEST
Test solution is made by
treating a specific volume of
the test sample with reagents
As per
procedure
Combined Beer’s- Lambert’s law
• Combined Beer’s- Lambert’s law is thus expressed as
amount of light transmitted through a colored solution
decreases exponentially with increases in conc. Of
colored solution & increase in conc. of colored solution
& increase in the path length of cuvette or thickness of
the colored solution.
• Combining the two laws:
A α C x L
A = K x C x L
Let AT=absorbance of the test solution
CT=concentration of the test solution
AS=absorbance of the standard solution
CS=concentration of the standard solution
AT
AS
K x CT x L
K x CS x L
=
AT
AS
CT
CS
=
CT =
AT
AS
x CS
AS = K x CS x LAT = K x CT x L
CT =
AT
AS
xCS
Concentration
of TEST sol.
Absorbance of TEST
Absorbance of STANDARD
Con. of STANDARDx=
Concentration
of TEST/100ml
Absorbance of TEST
Absorbance of STANDARD
Concn of Std X 100
x=
X ml
=
ODT
ODS
x CS
Concentration of
TEST /100ml
O.D of ‘T’- O.D of ‘B’
O.D of ‘S’- O.D of ‘B’
x=
Volume of ‘T’
Amount of ‘S’
Concentration of
TEST /100ml
x=
Volume of ‘T’
Amount of ‘S’T - B
S - B
x 100
x 100
Standard curve (calibration curve)
• The standard curve is prepared to check whether the
method of assaying a particular substance follows
Beer’s Law, i.e. whether the absorbance of the
substance increases in a linear way with its
concentration.
• The standard curve is constructed by plotting a vertical
axis (y – axis, ordinate) for optical densities
(absorbance) and a horizontal axis (x – axis, abscissa)
the concentration of standard solution.
• The concentration of the test/unknown can be
measured from the graph (standard curve).
Verification of Beer’s Law
• Prepare 1% standard solution of glucose, i.e. 1gm/dl
1000mg/100ml.
• Make different dilutions of standard solution using the general
formula given as following for obtaining different concentrations
of a solution by dilution with diluent (DW):
Tube no. Conc. (mg%) Amount of mL needed, (V1)
C1 x V1 = C2 x V2
DW (mL) Total vol. V2 (ml)
1 50 1000 x V1 = 50 x 2, V1= 0.1 1.9 2
2 100 1000 x V1 = 100 x 2, V1= 0.2 1.8 2
3 150 1000 x V1 = 150 x 2, V1= 0.3 1.7 2
4 200 1000 x V1 = 200 x 2, V1= 0.4 1.6 2
5 250 1000 x V1 = 250 x 2, V1= 0.5 1.5 2
6 300 1000 x V1 = 300 x 2, V1= 0.6 1.4 2
7 350 1000 x V1 = 350 x 2, V1= 0.7 1.3 2
8 400 1000 x V1 = 400 x 2, V1= 0.8 1.2 2
0.06 0.12 0.18 0.24 0.3 0.36 0.42 0.48
O.D2 50 100 150 200 250 300 350 400
0
50
100
150
200
250
300
350
400
450
CONC.OFGLUCOSE(mg/dL) OD of solution
Standard Curve / Calibration curve
Light spectrum and their wavelengths
Complimentary color
• Wavelength between 400nm to 760 nm form the visible
spectrum of light
• Light passed through a solution which selectivity absorbs
radiation at fixed wave lengths,then the color of the
transmitted light is complementary to that of the absored
light.
Colors and complimentary colors of visible
spectrum
Color of the
solution/ solution
color transmitted
Filter used/ color
absorbed
Wavelength (nm)
Yellow blue Violet 380 – 430
Yellow Blue 430 – 475
Orange Green blue 475 – 495
Red Blue green 495 – 505
Purple Green 505 – 555
Violet Yellow green 555 – 575
Blue yellow 575 – 600
Green blue Orange 600 – 650
Blue green Red 650 - 750
Colorimeter
Components of Colorimetry
1. Light source:
The light source is usually a tungten lamp, for
wavelength in the visible range (320 – 700nm) and a
deutarium or hydrogen lamps for ultraviolet light
(below 350nm).
a) Tungsten lamp  Visible range
b) Deutarium/hydrogen lamp (preferred)  UV Rays
c) Black body radiators (Nerst glower)  Infrared radiations
Light source
1. Tungsten lamp:
 filament mode of tungsten sealed in a glass envelope
 Filed with inert gas.
 Life time is limited due to gaseous tungsten formed by
sublimation.
Light source
Carbon arc lamp
• If sufficient intensity of light is not obtained
from tungsten lamp then carbon arc lamp can be
use as a source for color measurement.
Monochromators/Filters
• This is a means of selecting a sufficiently narrow wave
band
• Filter will absorb light of unwanted wavelength and
allow only monochromatic light to pass through.
– E.g.: a green filter absorbs all color, except green light which
is allowed to pass through.
Filter
Absorption filter Interference filter
Ex: Glass filter,Gelatin filter
Monochromators
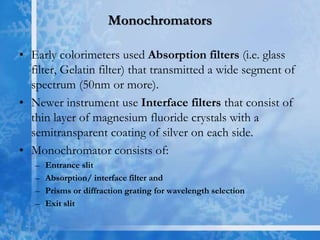
• Early colorimeters used Absorption filters (i.e. glass
filter, Gelatin filter) that transmitted a wide segment of
spectrum (50nm or more).
• Newer instrument use Interface filters that consist of
thin layer of magnesium fluoride crystals with a
semitransparent coating of silver on each side.
• Monochromator consists of:
– Entrance slit
– Absorption/ interface filter and
– Prisms or diffraction grating for wavelength selection
– Exit slit
Sample Holder/ Cuvette
• Cuvettes are rectangular cell , square cell or
circular one.
• Made up of optical glass for visible wavelength
(quartz or fused silica for UV).
• Common one is square, rectangular to avoid
refraction artifacts.
• Optical path (length) of cuvette is always1cm.
• Capacity may be 3ml/2ml/1ml depending upon
the thickness of the wall of the cuvette.
• For accurate and precise reading cuvette must be
transparent, clean, devoid of any scratches and
there should be no bubble adhering to the inner
surface of the filled cuvette.
Photosensitive detectors
• Detectors are the transducers, which convert light
energy to electrical enagery. A detector should be
possess follwing characteristics:
1.Should be sensitive
2.Should have linear response
3.Its noise level Should be low
4.Should have short response time
5.Should stable.
Photosensitive detectors
• Different detectors used are:
1. Barrier layer cells (photocells) – simplest
2. Photoemmisive cells
3. Photomultiplier tube (for low intensity lights)
4. Photoconductive cells (photodiodes) – newest.
Read out devices
• The detector response can be measured by any
of the following devices:
a) Galvanometer
b) Ammeter
c) Recorder
d) Digital readout.
The signal may be transmitted to computer or print
out devices.
Criteria for satisfactory colorimetric
estimations
• Stability of color
Color may be fade of air oxidation,
photochemical decomposition, temperature.
• Intensity of color
The color of the solution should be intense in
order to detect small amount of constituents
and for making accurate result in low
concentration.
Criteria for satisfactory colorimetric
estimations
• Clarity of the solution
Substance under investigation should be completely
soluble in the solvent, since turbid solution,
suspension or colloidal solution absorb as well as
scatter light.
• Reproducibility
The intensity of the colored solution must be
reproducible. The effect of order of adding reagent,
pH and other variable should be clearly studied
Criteria for satisfactory colorimetric
estimations
• Specificity
Color produced should be specific for the desired
constituent. If other constituents interfere with color
reaction they be removed or prevented from or
prevented from functioning through appropriate
treatment like use of other coloring agent, altering
the oxidation state.
• Validity of Beer’s law
The intensity of color should be proportional to
concentration. It can be easily assessed by plotting
absorbance Vs concentration, where a straight line
passing through origin should be obtained.
Glass/gel filter is placed in the filter slot
3/4th of cuvette is filled with distilled water
and placed in the cuvette slot
Instrument is switched ‘on’ and allowed to
warm-up for 4-5 minutes
Button is adjusted using ‘coarse’ and ‘fine’ knobs to
give zero optical activity in the galvanometer
Blank solution is placed in an identical cuvette and
the OD is read (‘B’)
Blank solution is transferred to the original test tube
Test solution is taken in the same cuvette and O.D.
is read (‘T’)
Test solution is transferred back to the original test
tube
Standard solution is taken in same cuvette and O.D.
is read (‘S’)
Standard solution is transferred back to the test
tube
Cuvette is washed
Applications Of Colorimeter
• Estimation of biochemical compounds in blood, plasma,
serum, CSF, urine, etc.:
– Glucose
– Urea
– Creatinine
– Uric Acid
– Bilirubin
– Lipids
– Total Proteins
– Enzymes [e.g. ALT, AST, ALP]
– Minerals [Calcium, Phosphorus etc.] etc….
Colorimetry

More Related Content

What's hot

Spectrophotometry
SpectrophotometrySpectrophotometry
Spectrophotometry
suniu
 
Spectrophotometry: basic concepts, instrumentation and application
Spectrophotometry: basic concepts, instrumentation and applicationSpectrophotometry: basic concepts, instrumentation and application
Spectrophotometry: basic concepts, instrumentation and application
Basil "Lexi" Bruno
 
Spectrophotometer
SpectrophotometerSpectrophotometer
Spectrophotometer
Asad Leo
 

What's hot (20)

Spectrophotometry
SpectrophotometrySpectrophotometry
Spectrophotometry
 
Colorimetery
ColorimeteryColorimetery
Colorimetery
 
Spetrophotometer
SpetrophotometerSpetrophotometer
Spetrophotometer
 
Spectrophotometry: basic concepts, instrumentation and application
Spectrophotometry: basic concepts, instrumentation and applicationSpectrophotometry: basic concepts, instrumentation and application
Spectrophotometry: basic concepts, instrumentation and application
 
Turbidimetry
TurbidimetryTurbidimetry
Turbidimetry
 
Colorimetry & spectrophotometry
Colorimetry & spectrophotometryColorimetry & spectrophotometry
Colorimetry & spectrophotometry
 
Colorimeter and spectrophotometer, Mass Spectrometer
Colorimeter and spectrophotometer, Mass SpectrometerColorimeter and spectrophotometer, Mass Spectrometer
Colorimeter and spectrophotometer, Mass Spectrometer
 
pH meter
pH meterpH meter
pH meter
 
Photometry
PhotometryPhotometry
Photometry
 
Spectrophotometry
SpectrophotometrySpectrophotometry
Spectrophotometry
 
Spectrophotometer
SpectrophotometerSpectrophotometer
Spectrophotometer
 
Colorimeter
ColorimeterColorimeter
Colorimeter
 
Ph meter
Ph meterPh meter
Ph meter
 
Colorimeters
ColorimetersColorimeters
Colorimeters
 
Spectrophotometer
SpectrophotometerSpectrophotometer
Spectrophotometer
 
Colorimeter and Photometer
Colorimeter and PhotometerColorimeter and Photometer
Colorimeter and Photometer
 
APPLICATION OF COLORIMETRY IN TRACE MINERAL ANALYSIS
APPLICATION OF COLORIMETRY IN TRACE MINERAL ANALYSISAPPLICATION OF COLORIMETRY IN TRACE MINERAL ANALYSIS
APPLICATION OF COLORIMETRY IN TRACE MINERAL ANALYSIS
 
Estimation of Serum Protien by Biuret method
Estimation of Serum Protien by Biuret methodEstimation of Serum Protien by Biuret method
Estimation of Serum Protien by Biuret method
 
Colorimeter and Spectrophotometer.pptx
Colorimeter and Spectrophotometer.pptxColorimeter and Spectrophotometer.pptx
Colorimeter and Spectrophotometer.pptx
 
Flame photometer
Flame photometerFlame photometer
Flame photometer
 

Similar to Colorimetry

Apurva colorimeter
Apurva colorimeterApurva colorimeter
Apurva colorimeter
Apurva Jha
 
Spectrophotometry.ppt 18.07.08
Spectrophotometry.ppt 18.07.08Spectrophotometry.ppt 18.07.08
Spectrophotometry.ppt 18.07.08
Amna Azam
 
SPECTROPHOMETRY meera (1).ppt..........................................x
SPECTROPHOMETRY meera (1).ppt..........................................xSPECTROPHOMETRY meera (1).ppt..........................................x
SPECTROPHOMETRY meera (1).ppt..........................................x
ameeemerald
 

Similar to Colorimetry (20)

Colorimetry class
Colorimetry classColorimetry class
Colorimetry class
 
COLORIMETRY.pptx
COLORIMETRY.pptxCOLORIMETRY.pptx
COLORIMETRY.pptx
 
colorimetry1-140330134700-phpapp01.ppt
colorimetry1-140330134700-phpapp01.pptcolorimetry1-140330134700-phpapp01.ppt
colorimetry1-140330134700-phpapp01.ppt
 
Colorimetry.pptx
Colorimetry.pptxColorimetry.pptx
Colorimetry.pptx
 
calorimeter.ppt
calorimeter.pptcalorimeter.ppt
calorimeter.ppt
 
COLORIMETER. Principal an applications uses of calorimeter
COLORIMETER. Principal an applications uses of calorimeterCOLORIMETER. Principal an applications uses of calorimeter
COLORIMETER. Principal an applications uses of calorimeter
 
photometry.pptx
photometry.pptxphotometry.pptx
photometry.pptx
 
INTRODUCTION TO COLORIMETRY and its basics.ppt
INTRODUCTION TO COLORIMETRY and its basics.pptINTRODUCTION TO COLORIMETRY and its basics.ppt
INTRODUCTION TO COLORIMETRY and its basics.ppt
 
PRINCIPLE OF SPECTROPHOTOMETRY AND COLORIMETRY 1.pptx
PRINCIPLE OF SPECTROPHOTOMETRY AND COLORIMETRY 1.pptxPRINCIPLE OF SPECTROPHOTOMETRY AND COLORIMETRY 1.pptx
PRINCIPLE OF SPECTROPHOTOMETRY AND COLORIMETRY 1.pptx
 
COLORIMETER & LAMBERTS – BEER’S LAW.pptx
COLORIMETER & LAMBERTS – BEER’S LAW.pptxCOLORIMETER & LAMBERTS – BEER’S LAW.pptx
COLORIMETER & LAMBERTS – BEER’S LAW.pptx
 
Apurva colorimeter
Apurva colorimeterApurva colorimeter
Apurva colorimeter
 
biochemistry_analyzers.pptx
biochemistry_analyzers.pptxbiochemistry_analyzers.pptx
biochemistry_analyzers.pptx
 
Colorimetry and atomic absorption spectroscopy
Colorimetry and atomic absorption spectroscopy Colorimetry and atomic absorption spectroscopy
Colorimetry and atomic absorption spectroscopy
 
Chapter 8
Chapter 8Chapter 8
Chapter 8
 
Spectrophotometer Meter
Spectrophotometer MeterSpectrophotometer Meter
Spectrophotometer Meter
 
Spectrophotometer meter
Spectrophotometer meterSpectrophotometer meter
Spectrophotometer meter
 
Spectrophotometry.pptx
Spectrophotometry.pptxSpectrophotometry.pptx
Spectrophotometry.pptx
 
Spectrophotometry.ppt 18.07.08
Spectrophotometry.ppt 18.07.08Spectrophotometry.ppt 18.07.08
Spectrophotometry.ppt 18.07.08
 
SPECTROPHOMETRY meera (1).ppt..........................................x
SPECTROPHOMETRY meera (1).ppt..........................................xSPECTROPHOMETRY meera (1).ppt..........................................x
SPECTROPHOMETRY meera (1).ppt..........................................x
 
Colorimetry.ppt.pptx
Colorimetry.ppt.pptxColorimetry.ppt.pptx
Colorimetry.ppt.pptx
 

Recently uploaded

THORACOTOMY . SURGICAL PERSPECTIVES VOL 1
THORACOTOMY . SURGICAL PERSPECTIVES VOL 1THORACOTOMY . SURGICAL PERSPECTIVES VOL 1
THORACOTOMY . SURGICAL PERSPECTIVES VOL 1
DR SETH JOTHAM
 

Recently uploaded (20)

Prix Galien International 2024 Forum Program
Prix Galien International 2024 Forum ProgramPrix Galien International 2024 Forum Program
Prix Galien International 2024 Forum Program
 
Creating Accessible Public Health Communications
Creating Accessible Public Health CommunicationsCreating Accessible Public Health Communications
Creating Accessible Public Health Communications
 
THORACOTOMY . SURGICAL PERSPECTIVES VOL 1
THORACOTOMY . SURGICAL PERSPECTIVES VOL 1THORACOTOMY . SURGICAL PERSPECTIVES VOL 1
THORACOTOMY . SURGICAL PERSPECTIVES VOL 1
 
Multiple sclerosis diet.230524.ppt3.pptx
Multiple sclerosis diet.230524.ppt3.pptxMultiple sclerosis diet.230524.ppt3.pptx
Multiple sclerosis diet.230524.ppt3.pptx
 
CURRENT HEALTH PROBLEMS AND ITS SOLUTION BY AYURVEDA.pptx
CURRENT HEALTH PROBLEMS AND ITS SOLUTION BY AYURVEDA.pptxCURRENT HEALTH PROBLEMS AND ITS SOLUTION BY AYURVEDA.pptx
CURRENT HEALTH PROBLEMS AND ITS SOLUTION BY AYURVEDA.pptx
 
180-hour Power Capsules For Men In Ghana
180-hour Power Capsules For Men In Ghana180-hour Power Capsules For Men In Ghana
180-hour Power Capsules For Men In Ghana
 
Couples presenting to the infertility clinic- Do they really have infertility...
Couples presenting to the infertility clinic- Do they really have infertility...Couples presenting to the infertility clinic- Do they really have infertility...
Couples presenting to the infertility clinic- Do they really have infertility...
 
DECIPHERING COMMON ECG FINDINGS IN ED.pptx
DECIPHERING COMMON ECG FINDINGS IN ED.pptxDECIPHERING COMMON ECG FINDINGS IN ED.pptx
DECIPHERING COMMON ECG FINDINGS IN ED.pptx
 
𝕔ALL #𝕘IRLS Service in Jaipur %(8901183002)# Jaipur #𝕔ALL #𝕘IRLS
𝕔ALL #𝕘IRLS Service in Jaipur %(8901183002)#  Jaipur #𝕔ALL #𝕘IRLS𝕔ALL #𝕘IRLS Service in Jaipur %(8901183002)#  Jaipur #𝕔ALL #𝕘IRLS
𝕔ALL #𝕘IRLS Service in Jaipur %(8901183002)# Jaipur #𝕔ALL #𝕘IRLS
 
TEST BANK For Advanced Practice Nursing in the Care of Older Adults, 2nd Edit...
TEST BANK For Advanced Practice Nursing in the Care of Older Adults, 2nd Edit...TEST BANK For Advanced Practice Nursing in the Care of Older Adults, 2nd Edit...
TEST BANK For Advanced Practice Nursing in the Care of Older Adults, 2nd Edit...
 
Antiplatelets in IHD, Dose Duration, DAPT vs SAPT
Antiplatelets in IHD, Dose Duration, DAPT vs SAPTAntiplatelets in IHD, Dose Duration, DAPT vs SAPT
Antiplatelets in IHD, Dose Duration, DAPT vs SAPT
 
End Feel -joint end feel - Normal and Abnormal end feel
End Feel -joint end feel - Normal and Abnormal end feelEnd Feel -joint end feel - Normal and Abnormal end feel
End Feel -joint end feel - Normal and Abnormal end feel
 
Is preeclampsia and spontaneous preterm delivery associate with vascular and ...
Is preeclampsia and spontaneous preterm delivery associate with vascular and ...Is preeclampsia and spontaneous preterm delivery associate with vascular and ...
Is preeclampsia and spontaneous preterm delivery associate with vascular and ...
 
Young at heart: Cardiovascular health stations to empower healthy lifestyle b...
Young at heart: Cardiovascular health stations to empower healthy lifestyle b...Young at heart: Cardiovascular health stations to empower healthy lifestyle b...
Young at heart: Cardiovascular health stations to empower healthy lifestyle b...
 
Book Trailer: PGMEE in a Nutshell (CEE MD/MS PG Entrance Examination)
Book Trailer: PGMEE in a Nutshell (CEE MD/MS PG Entrance Examination)Book Trailer: PGMEE in a Nutshell (CEE MD/MS PG Entrance Examination)
Book Trailer: PGMEE in a Nutshell (CEE MD/MS PG Entrance Examination)
 
TEST BANK For Wong’s Essentials of Pediatric Nursing, 11th Edition by Marilyn...
TEST BANK For Wong’s Essentials of Pediatric Nursing, 11th Edition by Marilyn...TEST BANK For Wong’s Essentials of Pediatric Nursing, 11th Edition by Marilyn...
TEST BANK For Wong’s Essentials of Pediatric Nursing, 11th Edition by Marilyn...
 
linearity concept of significance, standard deviation, chi square test, stude...
linearity concept of significance, standard deviation, chi square test, stude...linearity concept of significance, standard deviation, chi square test, stude...
linearity concept of significance, standard deviation, chi square test, stude...
 
A thorough review of supernormal conduction.pptx
A thorough review of supernormal conduction.pptxA thorough review of supernormal conduction.pptx
A thorough review of supernormal conduction.pptx
 
Relationship between vascular system disfunction, neurofluid flow and Alzheim...
Relationship between vascular system disfunction, neurofluid flow and Alzheim...Relationship between vascular system disfunction, neurofluid flow and Alzheim...
Relationship between vascular system disfunction, neurofluid flow and Alzheim...
 
The hemodynamic and autonomic determinants of elevated blood pressure in obes...
The hemodynamic and autonomic determinants of elevated blood pressure in obes...The hemodynamic and autonomic determinants of elevated blood pressure in obes...
The hemodynamic and autonomic determinants of elevated blood pressure in obes...
 

Colorimetry

  • 1.
  • 2. Introduction • Photometry is the most common analytical technique used in the biochemical laboratory. It is designed to measure the intensity of a beam of light. • Photometric principles are applied to the several kinds of analytical techniques: (a) where absorbed or transmitted light is measured: • Colorimetry • Spectrophotometry • Atomic absorption, and • Turbidometry (b) where emitted light is measured: • Flame emission photometry
  • 3. Introduction (cont.) • The components of most photoelectric colorimeters are basically the same and the basic method of operation is also similar for all the instruments. • In analytical chemistry, Colorimetry is a technique “used to determine the concentration of colored compounds (analytes) in sample solution” at visible spectrum of light (400 – 800 nm).
  • 4. Colorimetry Principle: Colored solutions have the property of absorbing certain wavelength of light when a monochromatic light is passed through them. • The amount of light absorbed or transmitted by a colored solution is in accordance with two laws: – Beer’s law – Lambert’s law
  • 5. Beer’s law : • When a monochromatic light passes through a colored solution, amount of light transmitted decreases exponentially with increase in concentration of colored substance. – i.e. the amount of light absorbed by a colored solution is directly proportion to the conc. Of substance in the colored solution.
  • 7. Lambert’s law : • The amount of light transmitted decreases exponentially with increase in path length (diameter) of the cuvette or thickness of colored solution through which light passes. – i.e. the amount of light absorbed by a colored solution depends on path length of cuvette or thickness or depth of the colored solution.
  • 8. Relationship between absorbance and transmittance OD %T
  • 9. Preparation of solution for investigation • In colorimetric estimation it is necessary to prepare 3 solutions: BLANK(B) STANDARD(S) TEST(T) 3/18/2016 8:34 PM
  • 10. BLANK To eliminate the effect of light absorption by the reagent used Water BLANK Reagent BLANK
  • 11. STANDARD Solution of known concentration of the substance Both O.D and concentration are known So concentration of unknown can be calculated
  • 12. TEST Test solution is made by treating a specific volume of the test sample with reagents As per procedure
  • 13. Combined Beer’s- Lambert’s law • Combined Beer’s- Lambert’s law is thus expressed as amount of light transmitted through a colored solution decreases exponentially with increases in conc. Of colored solution & increase in conc. of colored solution & increase in the path length of cuvette or thickness of the colored solution. • Combining the two laws: A α C x L A = K x C x L Let AT=absorbance of the test solution CT=concentration of the test solution AS=absorbance of the standard solution CS=concentration of the standard solution
  • 14. AT AS K x CT x L K x CS x L = AT AS CT CS = CT = AT AS x CS AS = K x CS x LAT = K x CT x L
  • 15. CT = AT AS xCS Concentration of TEST sol. Absorbance of TEST Absorbance of STANDARD Con. of STANDARDx= Concentration of TEST/100ml Absorbance of TEST Absorbance of STANDARD Concn of Std X 100 x= X ml = ODT ODS x CS
  • 16. Concentration of TEST /100ml O.D of ‘T’- O.D of ‘B’ O.D of ‘S’- O.D of ‘B’ x= Volume of ‘T’ Amount of ‘S’ Concentration of TEST /100ml x= Volume of ‘T’ Amount of ‘S’T - B S - B x 100 x 100
  • 17. Standard curve (calibration curve) • The standard curve is prepared to check whether the method of assaying a particular substance follows Beer’s Law, i.e. whether the absorbance of the substance increases in a linear way with its concentration. • The standard curve is constructed by plotting a vertical axis (y – axis, ordinate) for optical densities (absorbance) and a horizontal axis (x – axis, abscissa) the concentration of standard solution. • The concentration of the test/unknown can be measured from the graph (standard curve).
  • 18. Verification of Beer’s Law • Prepare 1% standard solution of glucose, i.e. 1gm/dl 1000mg/100ml. • Make different dilutions of standard solution using the general formula given as following for obtaining different concentrations of a solution by dilution with diluent (DW): Tube no. Conc. (mg%) Amount of mL needed, (V1) C1 x V1 = C2 x V2 DW (mL) Total vol. V2 (ml) 1 50 1000 x V1 = 50 x 2, V1= 0.1 1.9 2 2 100 1000 x V1 = 100 x 2, V1= 0.2 1.8 2 3 150 1000 x V1 = 150 x 2, V1= 0.3 1.7 2 4 200 1000 x V1 = 200 x 2, V1= 0.4 1.6 2 5 250 1000 x V1 = 250 x 2, V1= 0.5 1.5 2 6 300 1000 x V1 = 300 x 2, V1= 0.6 1.4 2 7 350 1000 x V1 = 350 x 2, V1= 0.7 1.3 2 8 400 1000 x V1 = 400 x 2, V1= 0.8 1.2 2
  • 19. 0.06 0.12 0.18 0.24 0.3 0.36 0.42 0.48 O.D2 50 100 150 200 250 300 350 400 0 50 100 150 200 250 300 350 400 450 CONC.OFGLUCOSE(mg/dL) OD of solution Standard Curve / Calibration curve
  • 20.
  • 21.
  • 22. Light spectrum and their wavelengths
  • 23. Complimentary color • Wavelength between 400nm to 760 nm form the visible spectrum of light • Light passed through a solution which selectivity absorbs radiation at fixed wave lengths,then the color of the transmitted light is complementary to that of the absored light.
  • 24. Colors and complimentary colors of visible spectrum Color of the solution/ solution color transmitted Filter used/ color absorbed Wavelength (nm) Yellow blue Violet 380 – 430 Yellow Blue 430 – 475 Orange Green blue 475 – 495 Red Blue green 495 – 505 Purple Green 505 – 555 Violet Yellow green 555 – 575 Blue yellow 575 – 600 Green blue Orange 600 – 650 Blue green Red 650 - 750
  • 27. Components of Colorimetry 1. Light source: The light source is usually a tungten lamp, for wavelength in the visible range (320 – 700nm) and a deutarium or hydrogen lamps for ultraviolet light (below 350nm). a) Tungsten lamp  Visible range b) Deutarium/hydrogen lamp (preferred)  UV Rays c) Black body radiators (Nerst glower)  Infrared radiations
  • 28. Light source 1. Tungsten lamp:  filament mode of tungsten sealed in a glass envelope  Filed with inert gas.  Life time is limited due to gaseous tungsten formed by sublimation.
  • 29. Light source Carbon arc lamp • If sufficient intensity of light is not obtained from tungsten lamp then carbon arc lamp can be use as a source for color measurement.
  • 30. Monochromators/Filters • This is a means of selecting a sufficiently narrow wave band • Filter will absorb light of unwanted wavelength and allow only monochromatic light to pass through. – E.g.: a green filter absorbs all color, except green light which is allowed to pass through. Filter Absorption filter Interference filter Ex: Glass filter,Gelatin filter
  • 31. Monochromators • Early colorimeters used Absorption filters (i.e. glass filter, Gelatin filter) that transmitted a wide segment of spectrum (50nm or more). • Newer instrument use Interface filters that consist of thin layer of magnesium fluoride crystals with a semitransparent coating of silver on each side. • Monochromator consists of: – Entrance slit – Absorption/ interface filter and – Prisms or diffraction grating for wavelength selection – Exit slit
  • 32. Sample Holder/ Cuvette • Cuvettes are rectangular cell , square cell or circular one. • Made up of optical glass for visible wavelength (quartz or fused silica for UV). • Common one is square, rectangular to avoid refraction artifacts. • Optical path (length) of cuvette is always1cm. • Capacity may be 3ml/2ml/1ml depending upon the thickness of the wall of the cuvette. • For accurate and precise reading cuvette must be transparent, clean, devoid of any scratches and there should be no bubble adhering to the inner surface of the filled cuvette.
  • 33. Photosensitive detectors • Detectors are the transducers, which convert light energy to electrical enagery. A detector should be possess follwing characteristics: 1.Should be sensitive 2.Should have linear response 3.Its noise level Should be low 4.Should have short response time 5.Should stable.
  • 34. Photosensitive detectors • Different detectors used are: 1. Barrier layer cells (photocells) – simplest 2. Photoemmisive cells 3. Photomultiplier tube (for low intensity lights) 4. Photoconductive cells (photodiodes) – newest.
  • 35. Read out devices • The detector response can be measured by any of the following devices: a) Galvanometer b) Ammeter c) Recorder d) Digital readout. The signal may be transmitted to computer or print out devices.
  • 36. Criteria for satisfactory colorimetric estimations • Stability of color Color may be fade of air oxidation, photochemical decomposition, temperature. • Intensity of color The color of the solution should be intense in order to detect small amount of constituents and for making accurate result in low concentration.
  • 37. Criteria for satisfactory colorimetric estimations • Clarity of the solution Substance under investigation should be completely soluble in the solvent, since turbid solution, suspension or colloidal solution absorb as well as scatter light. • Reproducibility The intensity of the colored solution must be reproducible. The effect of order of adding reagent, pH and other variable should be clearly studied
  • 38. Criteria for satisfactory colorimetric estimations • Specificity Color produced should be specific for the desired constituent. If other constituents interfere with color reaction they be removed or prevented from or prevented from functioning through appropriate treatment like use of other coloring agent, altering the oxidation state. • Validity of Beer’s law The intensity of color should be proportional to concentration. It can be easily assessed by plotting absorbance Vs concentration, where a straight line passing through origin should be obtained.
  • 39. Glass/gel filter is placed in the filter slot 3/4th of cuvette is filled with distilled water and placed in the cuvette slot Instrument is switched ‘on’ and allowed to warm-up for 4-5 minutes
  • 40. Button is adjusted using ‘coarse’ and ‘fine’ knobs to give zero optical activity in the galvanometer Blank solution is placed in an identical cuvette and the OD is read (‘B’) Blank solution is transferred to the original test tube
  • 41. Test solution is taken in the same cuvette and O.D. is read (‘T’) Test solution is transferred back to the original test tube Standard solution is taken in same cuvette and O.D. is read (‘S’) Standard solution is transferred back to the test tube Cuvette is washed
  • 42.
  • 43. Applications Of Colorimeter • Estimation of biochemical compounds in blood, plasma, serum, CSF, urine, etc.: – Glucose – Urea – Creatinine – Uric Acid – Bilirubin – Lipids – Total Proteins – Enzymes [e.g. ALT, AST, ALP] – Minerals [Calcium, Phosphorus etc.] etc….