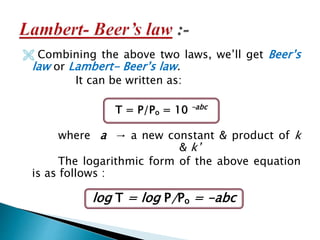
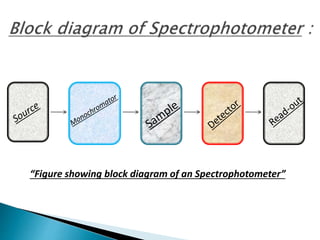
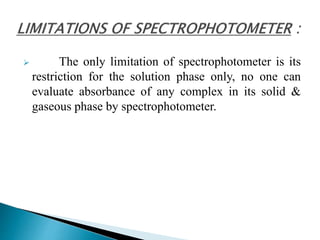
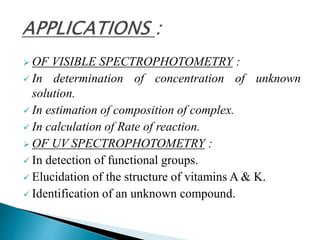
Junwani- Bhilai
Spectrophotometry & Colorimetry
By:
Vikas Chandra Sharma
Asst. Prof., Department of Chemistry
 SPECTROPHOTOMETRY
 Introduction
 Basic principle
 Block diagram of spectrophotometer
 Limitations of spectrophotometer
 Applications of spectrophotometry
 COLORIMETRY
 Introduction
 Basic principle
 Calculation of sample concentration
 Applications of Colorimeter
 Limitations of Colorimeter
 CONCLUSION
 BIBLIOGRAPHY
 INTRODUCTION
o A kind of analytical technique basically applied for
structure elucidation, calculation of concentration
etc. of complexes in their solution phase over the
range of UV & Visible region is called as
Spectrophotometry.
o A spectrophotometer is an instrument that will resolve
polychromatic radiation into different wavelengths.
First spectroscopist :
 Johannes Marcus Marci of Kronland in
Eastern Bohemia is considered as the first
spectroscopist.
He was interested in the phenomenon
of the rainbow & performed experiments to
explain it.
 Spectrophotometry is based on the basic
principle of Beer’s law.
 INTRODUCTION TO BEER’S LAW :
 The amount of monochromatic radiation absorbed by
a sample is described by Beer- Bouguer-Lambert law,
commonly called as Beer’s law.
 This law describes the dependence of
transmittance (T) on Pathlength & concentration of
the sample.
Where PO → Power of incident radiation
P → Power of transmitted radiation
c → Concentration of the solution
b → Pathlength
PO P
c
b
 P. Bouguer in 1729 & J.H. Lambert in 1760 recognized
that “ when electromagnetic energy is absorbed, the
power of transmitted energy decreases exponentially with
pathlength”.
 The above law can be written in exponential form as :
T = P/PO =10-kb
where T = Transmittance
k = constant
b = pathlength
 In 1852, A. Beer & F. Bernard each stated that a
similar law hold for the dependence of T on the
concentration, c :
T = P/PO = 10
-k’c
where k’→ a new constant
T → Transmittance
 Combining the above two laws, we’ll get Beer’s
law or Lambert- Beer’s law.
It can be written as:
where a → a new constant & product of k
& k’
The logarithmic form of the above equation
is as follows :
T = P/Po = 10 –abc
log T = log P/Po = -abc
“Figure showing block diagram of an Spectrophotometer”
 The only limitation of spectrophotometer is its
restriction for the solution phase only, no one can
evaluate absorbance of any complex in its solid &
gaseous phase by spectrophotometer.
 OF VISIBLE SPECTROPHOTOMETRY :
 In determination of concentration of unknown
solution.
 In estimation of composition of complex.
 In calculation of Rate of reaction.
 OF UV SPECTROPHOTOMETRY :
 In detection of functional groups.
 Elucidation of the structure of vitamins A & K.
 Identification of an unknown compound.
 INTRODUCTION :
o A type of analytical procedure of estimating the
concentration of coloured substances used extensively
in biochemical work is known as “colorimetry”.
o Colorimeter is a simple instrument used for reading
of colour, against a blank in the visible region(400-
720nm).
 Colorimetry is also based on Beer’s law as similar
to the spectrophotometry.
 In colorimetry, the sample is treated with a
reagent which produces a colour with the constituent
to be determined.
 The intensity of the colour is directly
proportional to the concentration of the coloured
substance.
Wt. of unknown in sample=
Reading of standard X Wt. of unknown in standard
Reading of unknown
LIMITATIONS OF COLORIMETER:
 The limitation of a colorimeter is that it is
restricted only for visible region.
Colorimetry is only used for the determination of
concentration of an unknown solution.
Spectrophotometry is very much utilizing technique
in determination of complex structure, concentration,
R.O.R. etc.
Colorimetry is used for estimation of only
concentration of solution in visible region.
Analytical chemistry, sixth edition, G.D. Christian
A text book of biophysics, Dr. R.N. Roy
Elementary organic spectrometry, Y.R. Sharma
Instrumental analysis, J.E.O’ Reilly.

Basic principle of spectrophotometry & colorimetry

  • 1.
    Junwani- Bhilai Spectrophotometry &Colorimetry By: Vikas Chandra Sharma Asst. Prof., Department of Chemistry
  • 2.
     SPECTROPHOTOMETRY  Introduction Basic principle  Block diagram of spectrophotometer  Limitations of spectrophotometer  Applications of spectrophotometry  COLORIMETRY  Introduction  Basic principle  Calculation of sample concentration  Applications of Colorimeter  Limitations of Colorimeter  CONCLUSION  BIBLIOGRAPHY
  • 3.
     INTRODUCTION o Akind of analytical technique basically applied for structure elucidation, calculation of concentration etc. of complexes in their solution phase over the range of UV & Visible region is called as Spectrophotometry. o A spectrophotometer is an instrument that will resolve polychromatic radiation into different wavelengths.
  • 4.
    First spectroscopist : Johannes Marcus Marci of Kronland in Eastern Bohemia is considered as the first spectroscopist. He was interested in the phenomenon of the rainbow & performed experiments to explain it.
  • 5.
     Spectrophotometry isbased on the basic principle of Beer’s law.  INTRODUCTION TO BEER’S LAW :  The amount of monochromatic radiation absorbed by a sample is described by Beer- Bouguer-Lambert law, commonly called as Beer’s law.  This law describes the dependence of transmittance (T) on Pathlength & concentration of the sample.
  • 6.
    Where PO →Power of incident radiation P → Power of transmitted radiation c → Concentration of the solution b → Pathlength PO P c b
  • 7.
     P. Bouguerin 1729 & J.H. Lambert in 1760 recognized that “ when electromagnetic energy is absorbed, the power of transmitted energy decreases exponentially with pathlength”.  The above law can be written in exponential form as : T = P/PO =10-kb where T = Transmittance k = constant b = pathlength
  • 8.
     In 1852,A. Beer & F. Bernard each stated that a similar law hold for the dependence of T on the concentration, c : T = P/PO = 10 -k’c where k’→ a new constant T → Transmittance
  • 9.
     Combining theabove two laws, we’ll get Beer’s law or Lambert- Beer’s law. It can be written as: where a → a new constant & product of k & k’ The logarithmic form of the above equation is as follows : T = P/Po = 10 –abc log T = log P/Po = -abc
  • 10.
    “Figure showing blockdiagram of an Spectrophotometer”
  • 11.
     The onlylimitation of spectrophotometer is its restriction for the solution phase only, no one can evaluate absorbance of any complex in its solid & gaseous phase by spectrophotometer.
  • 12.
     OF VISIBLESPECTROPHOTOMETRY :  In determination of concentration of unknown solution.  In estimation of composition of complex.  In calculation of Rate of reaction.  OF UV SPECTROPHOTOMETRY :  In detection of functional groups.  Elucidation of the structure of vitamins A & K.  Identification of an unknown compound.
  • 13.
     INTRODUCTION : oA type of analytical procedure of estimating the concentration of coloured substances used extensively in biochemical work is known as “colorimetry”. o Colorimeter is a simple instrument used for reading of colour, against a blank in the visible region(400- 720nm).
  • 14.
     Colorimetry isalso based on Beer’s law as similar to the spectrophotometry.  In colorimetry, the sample is treated with a reagent which produces a colour with the constituent to be determined.  The intensity of the colour is directly proportional to the concentration of the coloured substance.
  • 15.
    Wt. of unknownin sample= Reading of standard X Wt. of unknown in standard Reading of unknown LIMITATIONS OF COLORIMETER:  The limitation of a colorimeter is that it is restricted only for visible region.
  • 16.
    Colorimetry is onlyused for the determination of concentration of an unknown solution.
  • 17.
    Spectrophotometry is verymuch utilizing technique in determination of complex structure, concentration, R.O.R. etc. Colorimetry is used for estimation of only concentration of solution in visible region.
  • 18.
    Analytical chemistry, sixthedition, G.D. Christian A text book of biophysics, Dr. R.N. Roy Elementary organic spectrometry, Y.R. Sharma Instrumental analysis, J.E.O’ Reilly.