Downloaded 410 times


![AT
AS
=
K X CT X L
K X CS X L
; since L is same
AT
AS
=
CT
CS
;
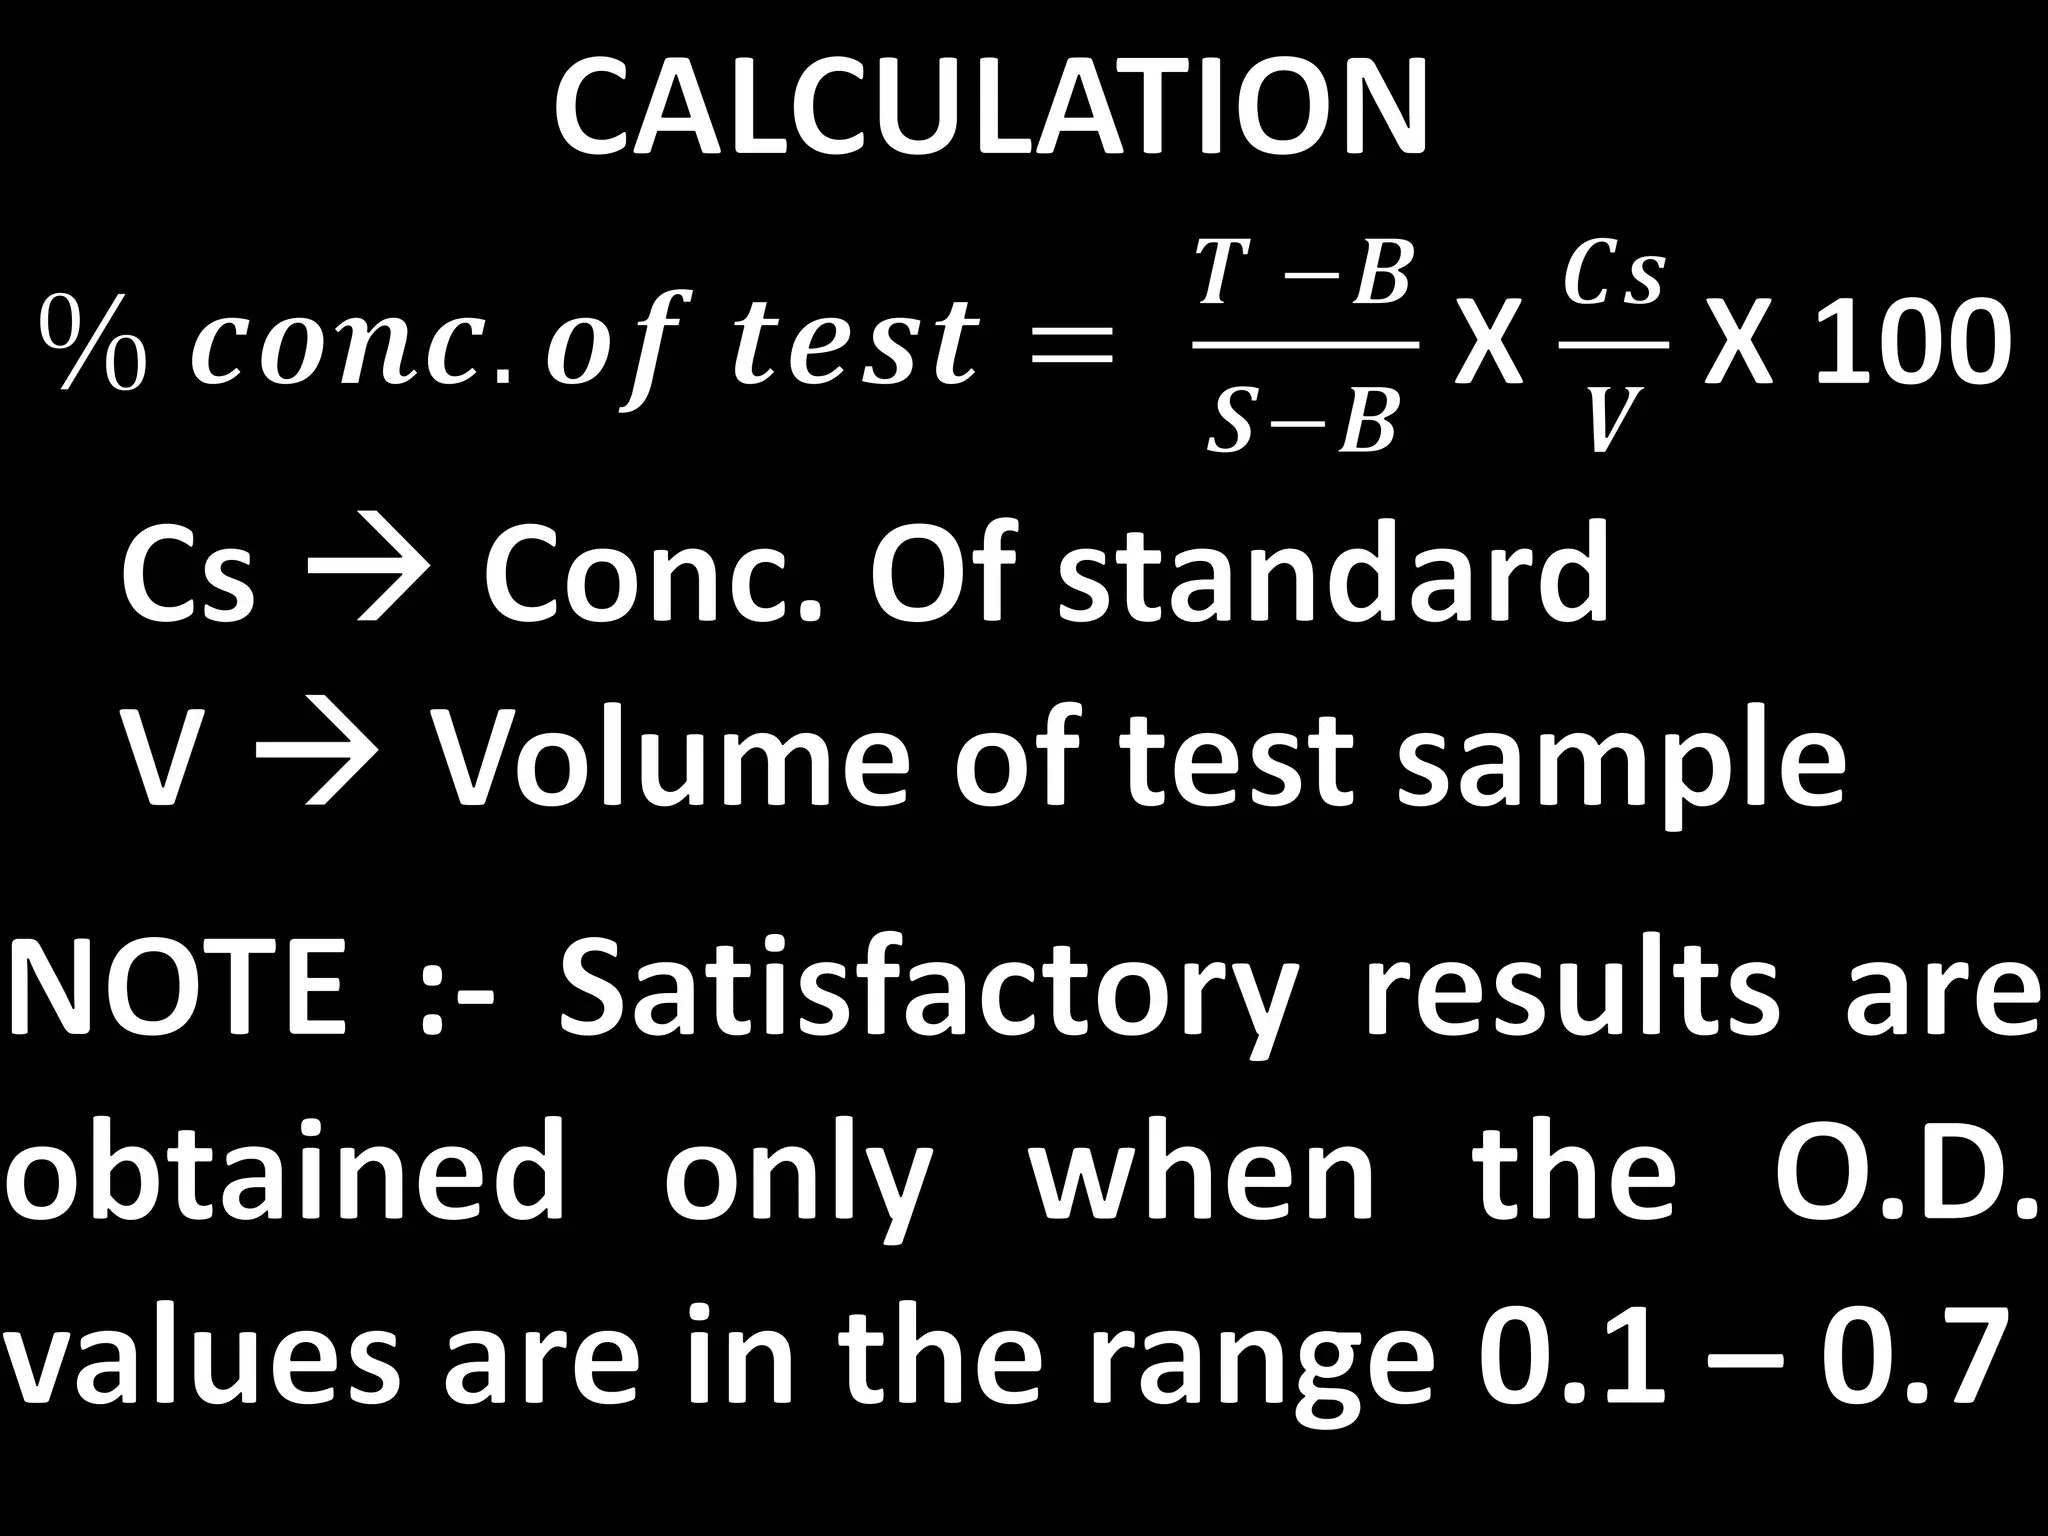
CT =
AT
AS
X
CS
𝓍
X 100 (Conc. in 100 ml
of test sample [% conc.]; 𝓍 is ml of
sample taken)](https://image.slidesharecdn.com/colorimetry-141116002722-conversion-gate01/75/Colorimetry-and-spectroscopy-22-2048.jpg)


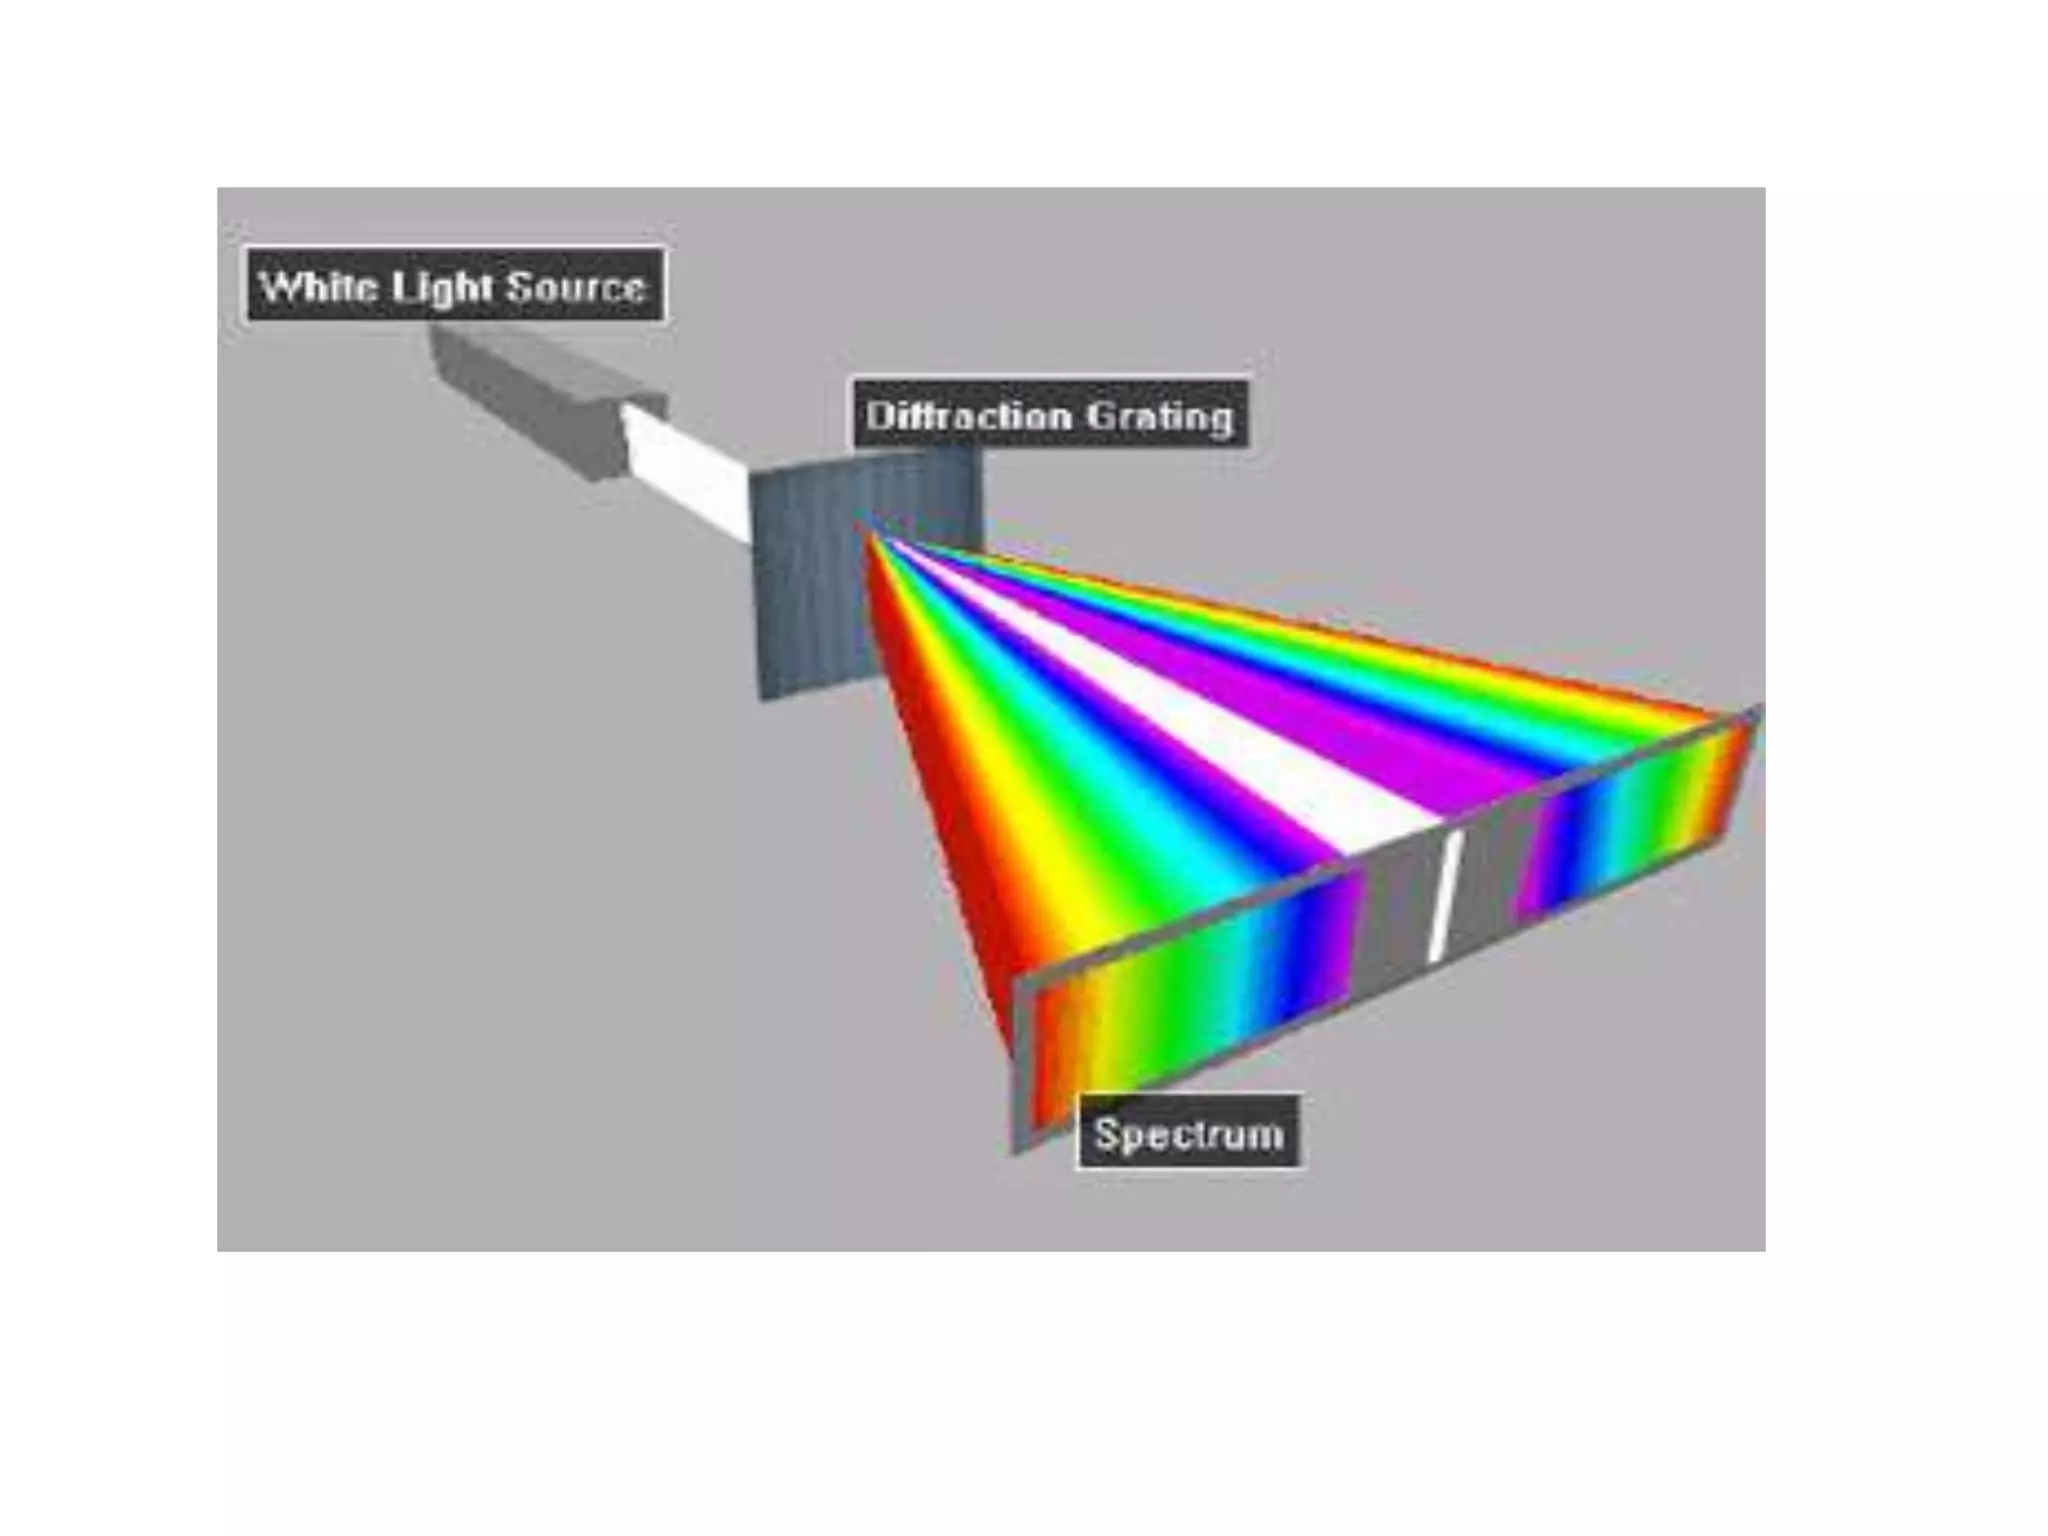


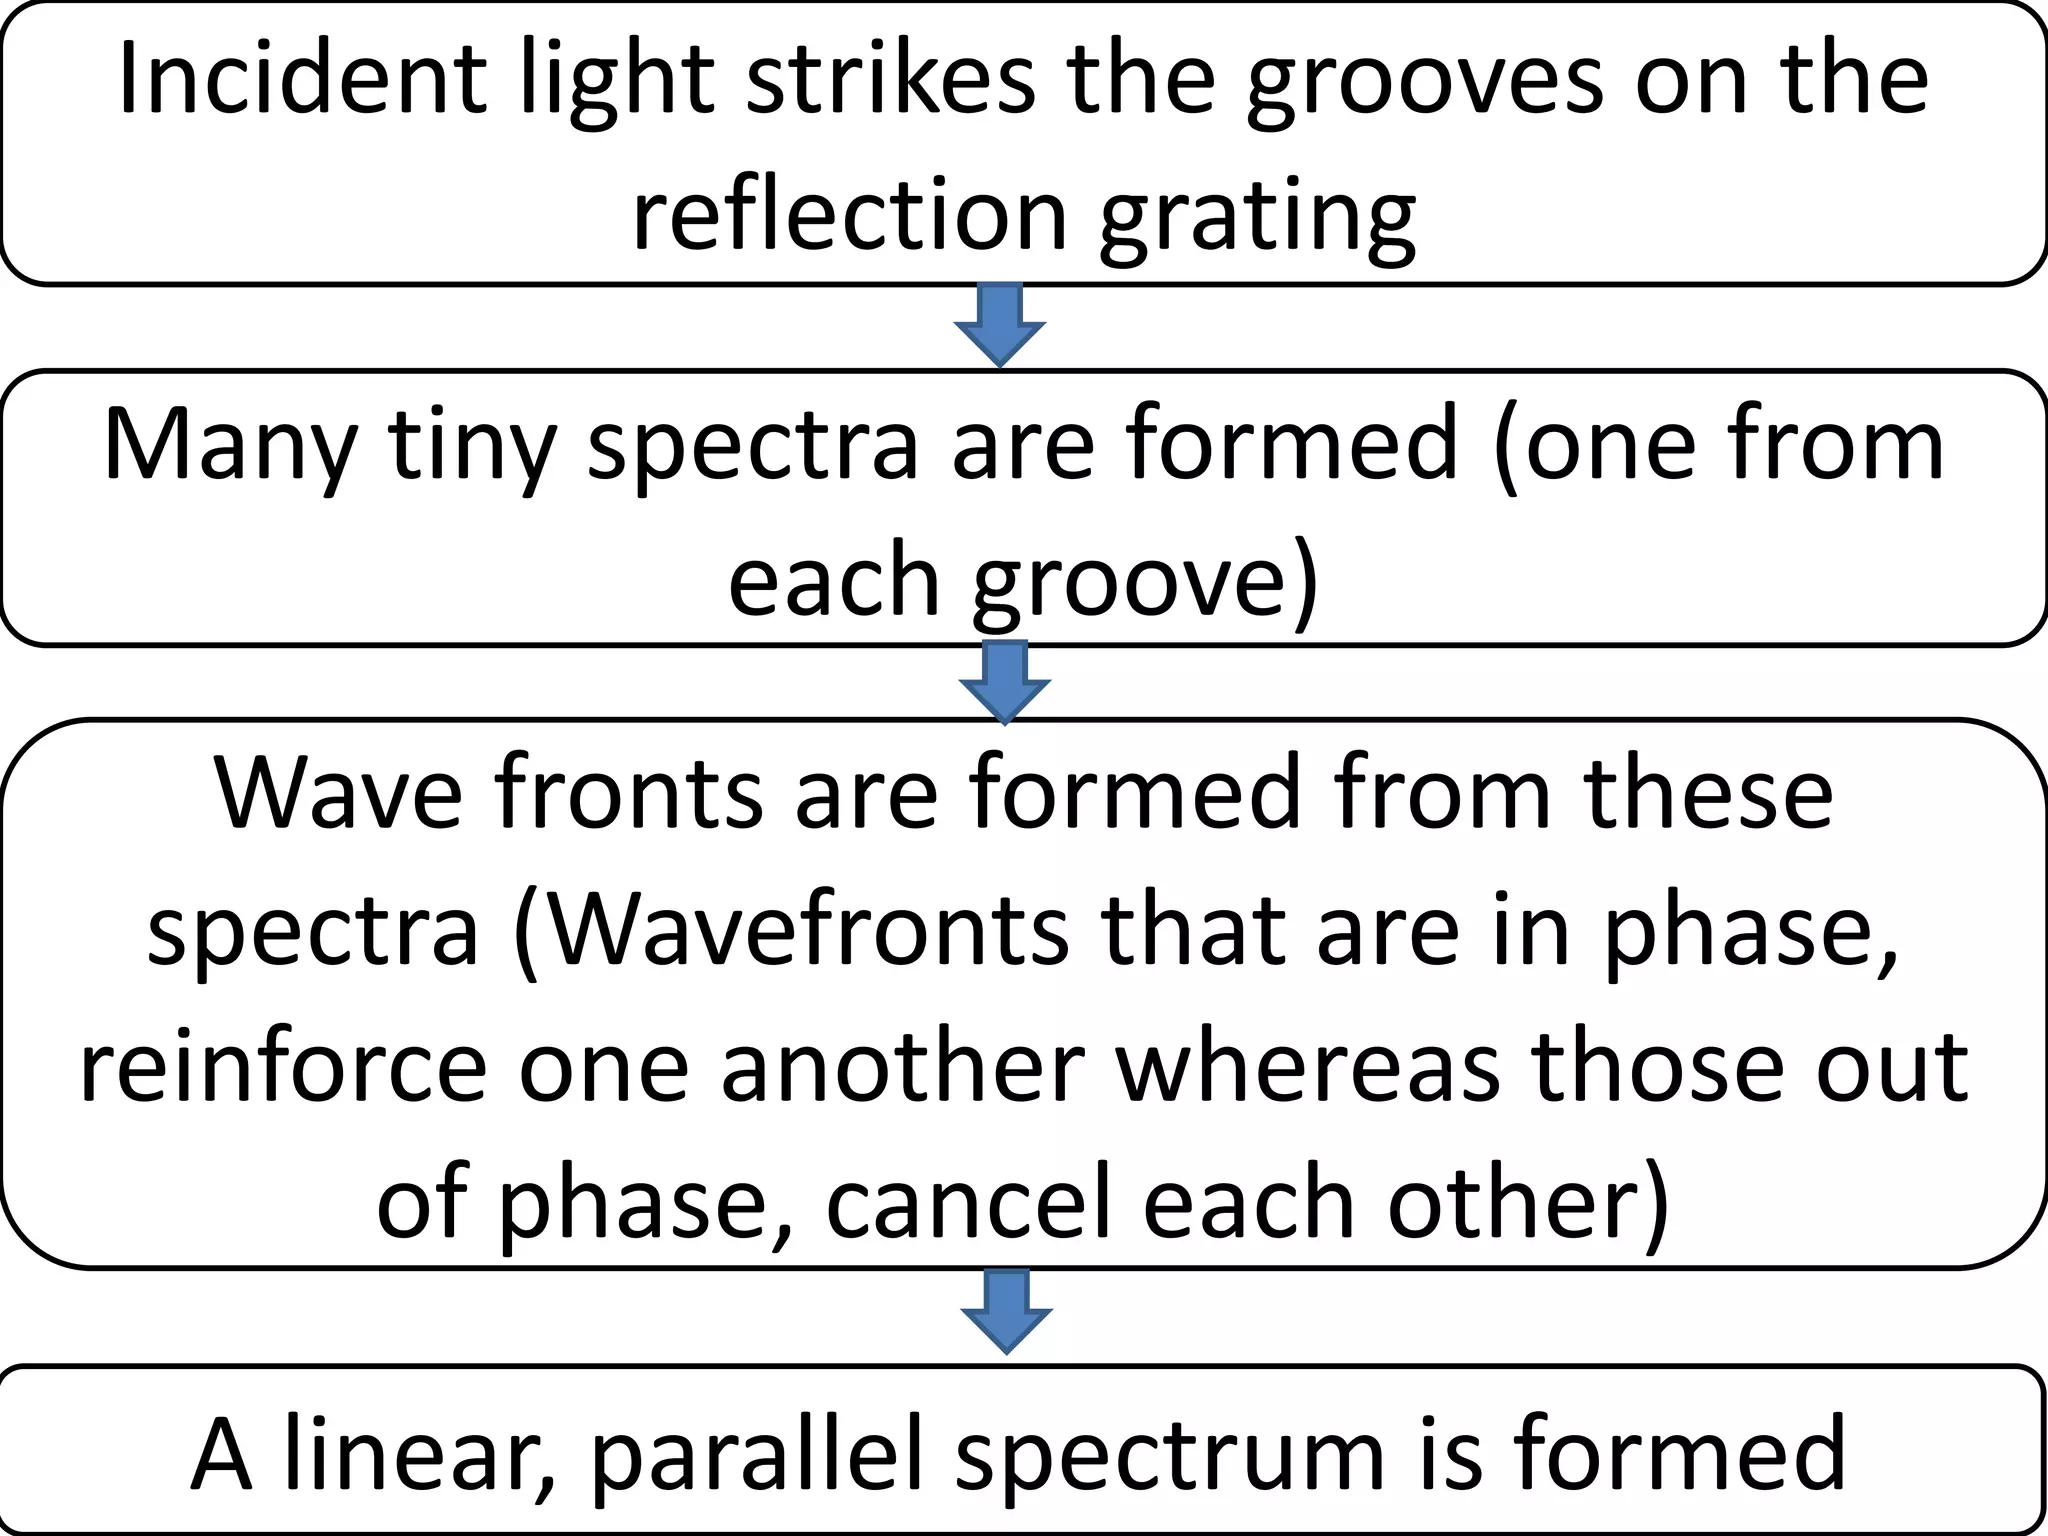


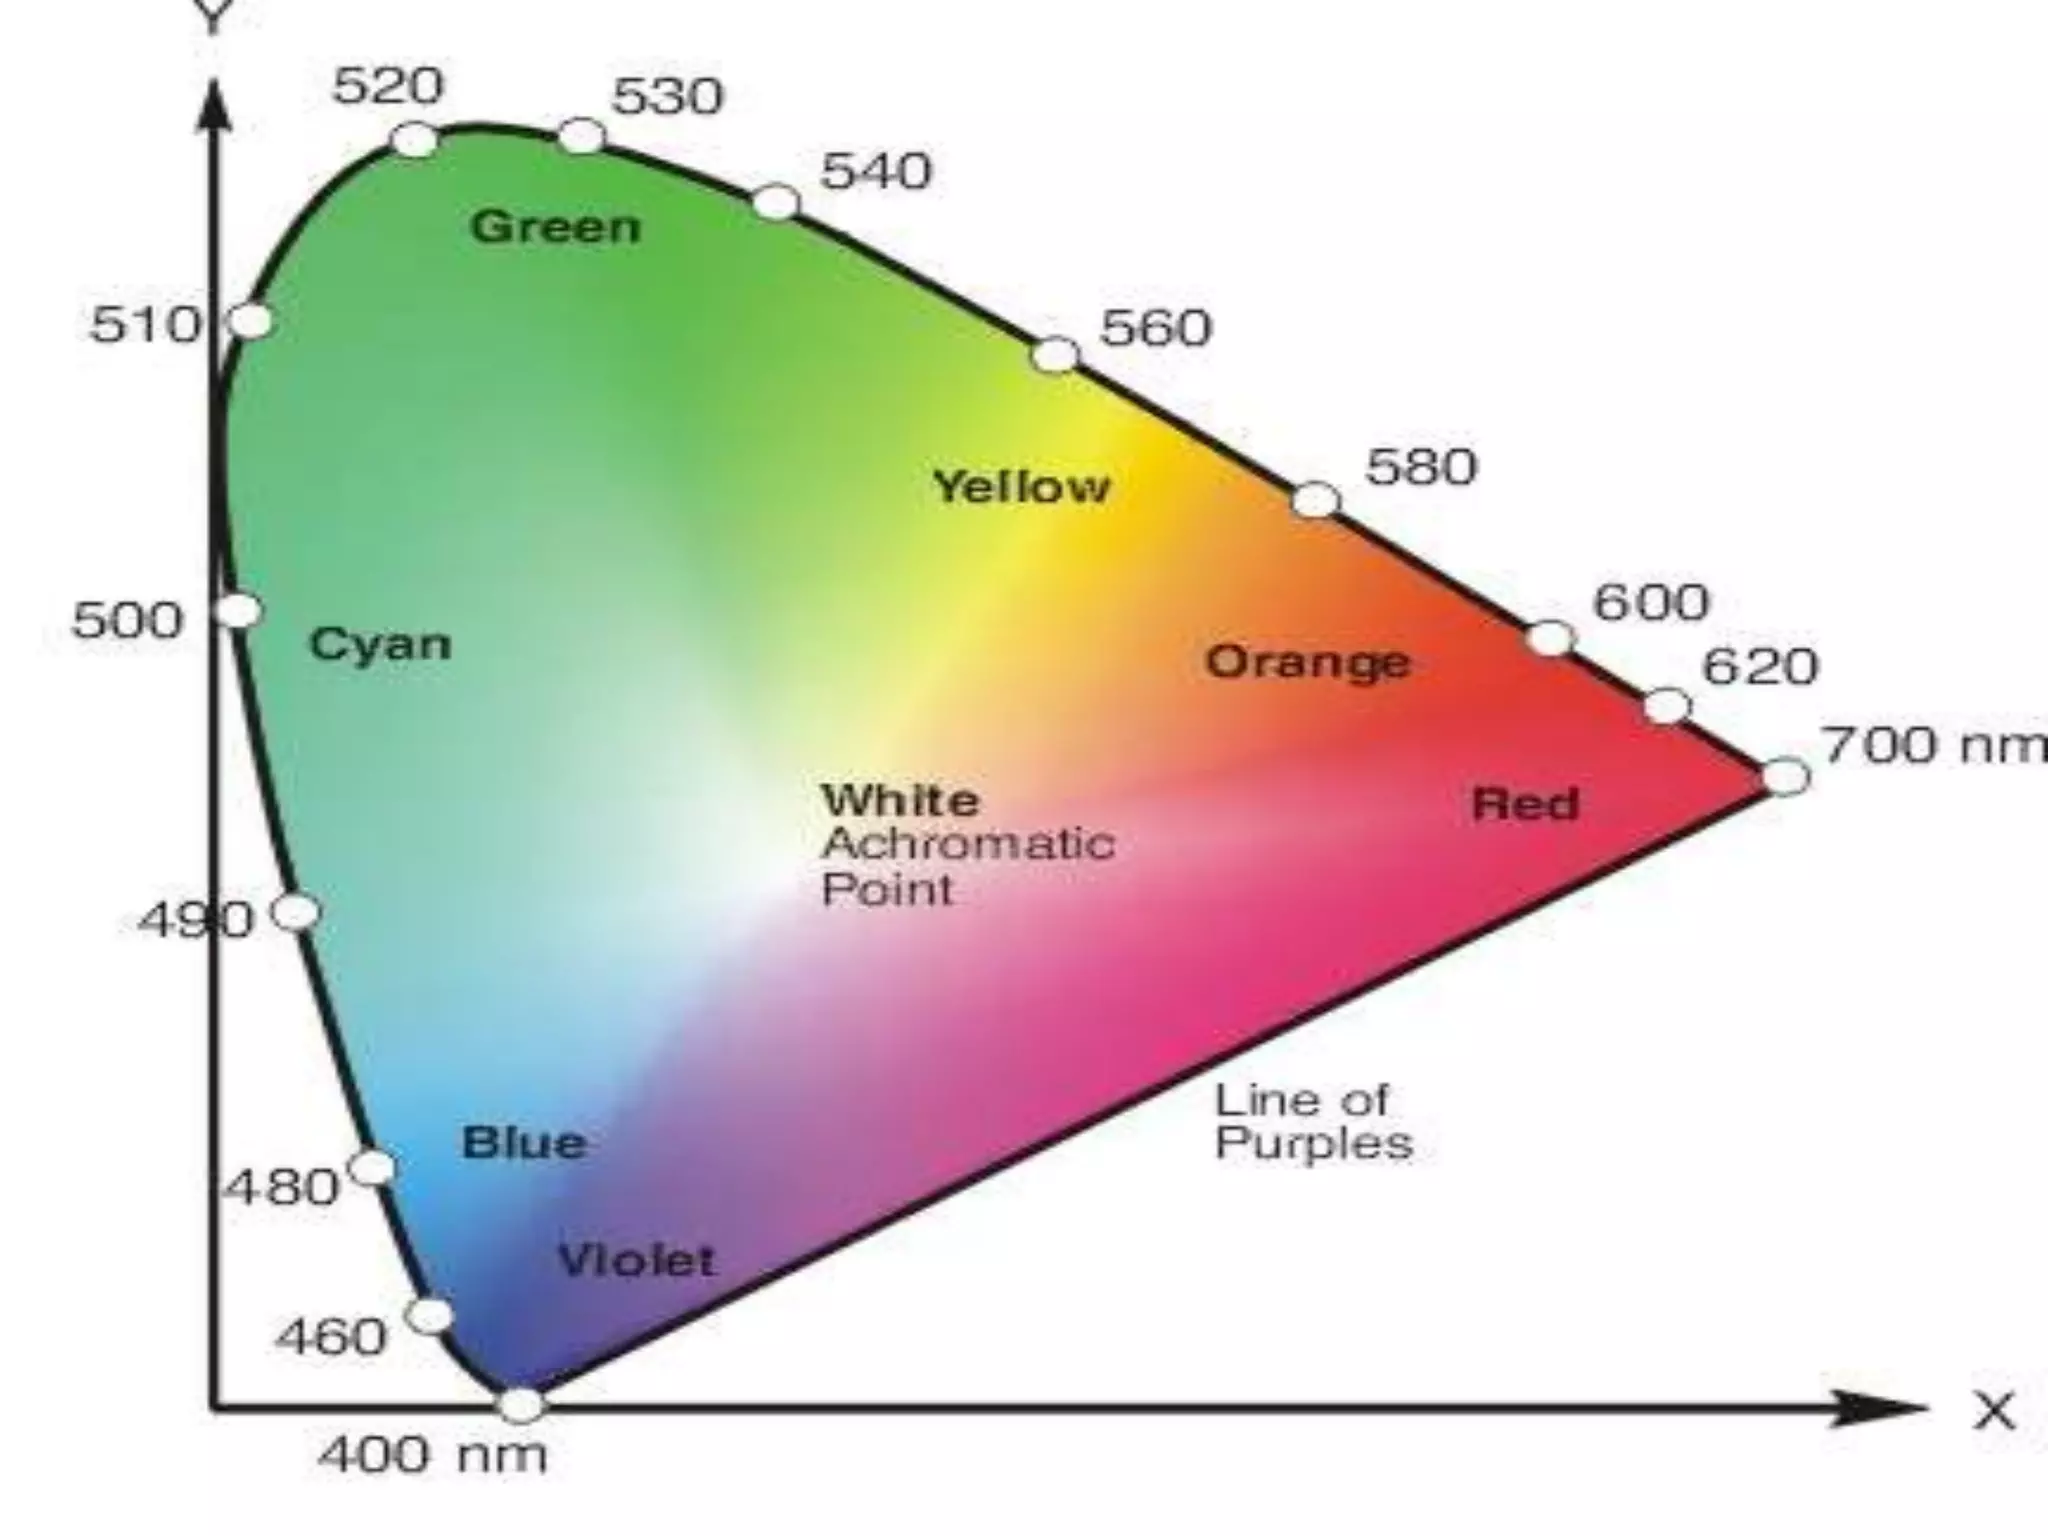
The document outlines the HSV color model and its corresponding wavelength ranges in the visible spectrum, from ultraviolet to near-infrared. It describes a procedure for measuring optical density using a cuvette, including preparing solutions and reading data from the galvanometer. Additionally, it details the formation of spectra from incident light striking a reflection grating, resulting in a linear, parallel spectrum.


