
More Related Content
What's hot
What's hot (20)
Similar to ethanol experiment
Similar to ethanol experiment (20)
Recently uploaded
Recently uploaded (20)
ethanol experiment
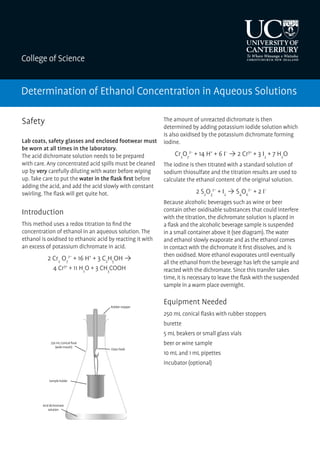
- 1. College of Science 1 DeterminationofEthanolConcentrationin AqueousSolutions Introduction This method uses a redox titration to find the concentration of ethanol in an aqueous solution. The ethanol is oxidised to ethanoic acid by reacting it with an excess of potassium dichromate in acid. 2 Cr2 O7 2− + 16 H+ + 3 C2 H5 OH → 4 Cr3+ + 11 H2 O + 3 CH3 COOH The amount of unreacted dichromate is then determined by adding potassium iodide solution which is also oxidised by the potassium dichromate forming iodine. Cr2 O7 2− + 14 H+ + 6 I− → 2 Cr3+ + 3 I2 + 7 H2 O The iodine is then titrated with a standard solution of sodium thiosulfate and the titration results are used to calculate the ethanol content of the original solution. 2 S2 O3 2− + I2 → S4 O6 2− + 2 I− Because alcoholic beverages such as wine or beer contain other oxidisable substances that could interfere with the titration, the dichromate solution is placed in Rubber stopper Glass hook 250 mL Conical flask (wide mouth) Sample holder Acid dichromate solution a flask and the alcoholic beverage sample is suspended in a small container above it (see diagram).The water and ethanol slowly evaporate and as the ethanol comes in contact with the dichromate it first dissolves, and is then oxidised. More ethanol evaporates until eventually all the ethanol from the beverage has left the sample and reacted with the dichromate. Since this transfer takes time, it is necessary to leave the flask with the suspended sample in a warm place overnight. Equipment Needed 250 mL conical flasks with rubber stoppers burette 5 mL beakers or small glass vials beer or wine sample 10 mL and 1 mL pipettes incubator (optional) Solutions Needed Acid dichromate solution: (0.01 molL-1 in 5.0 molL-1 sulfuric acid) (see safety notes). Add 125 mL of water to a 500 mL conical flask. Carefully add 70 mL of concentrated sulfuric acid with constant swirling. Cool flask under cold water tap and add 0.75 g of potassium dichromate. Dilute to 250 mL with distilled water. Starch indicator solution: (1.0% solution) Dissolve 1.0 g of soluble starch in 100 mL of recently boiled water. Stir until dissolved. Sodium thiosulfate solution: (0.03molL-1 ). Add 7.44 g of Na2 S2 O3 .5H2 O to a 1L volumetric flask, dissolve in distilled water and dilute up to the mark. Potassium iodide solution: (1.2molL-1 ) Dissolve 5 g of KI in 25 mL of water. Safety Lab coats, safety glasses and enclosed footwear must be worn at all times in the laboratory. The acid dichromate solution needs to be prepared with care. Any concentrated acid spills must be cleaned up by very carefully diluting with water before wiping up. Take care to put the water in the flask first before adding the acid, and add the acid slowly with constant swirling. The flask will get quite hot. Introduction This method uses a redox titration to find the concentration of ethanol in an aqueous solution. The ethanol is oxidised to ethanoic acid by reacting it with an excess of potassium dichromate in acid. 2 Cr2 O7 2− + 16 H+ + 3 C2 H5 OH → 4 Cr3+ + 11 H2 O + 3 CH3 COOH The amount of unreacted dichromate is then determined by adding potassium iodide solution which is also oxidised by the potassium dichromate forming iodine. Cr2 O7 2− + 14 H+ + 6 I− → 2 Cr3+ + 3 I2 + 7 H2 O The iodine is then titrated with a standard solution of sodium thiosulfate and the titration results are used to calculate the ethanol content of the original solution. 2 S2 O3 2− + I2 → S4 O6 2− + 2 I− Because alcoholic beverages such as wine or beer contain other oxidisable substances that could interfere with the titration, the dichromate solution is placed in a flask and the alcoholic beverage sample is suspended in a small container above it (see diagram).The water and ethanol slowly evaporate and as the ethanol comes in contact with the dichromate it first dissolves,and is then oxidised.More ethanol evaporates until eventually all the ethanol from the beverage has left the sample and reacted with the dichromate.Since this transfer takes time,it is necessary to leave the flask with the suspended sample in a warm place overnight. Equipment Needed 250 mL conical flasks with rubber stoppers burette 5 mL beakers or small glass vials beer or wine sample 10 mL and 1 mL pipettes incubator (optional) Determination of Ethanol Concentration in Aqueous Solutions
- 2. 2 Method Sample Preparation 1. Dilute beer samples 1:20 (10 mL in 200 mL) with distilled water. 2. Dilute wine samples 1:50 (20 mL in 1000 mL) with distilled water. Titration (described for one beverage) 1. Transfer 10 mL of the acid dichromate solution (see safety notes) to a 250 mL conical flask with matching rubber stopper. 2. Pipette 1 mL of the diluted beverage sample into the sample holder. This can be a 5mL beaker or glass vial. Prepare three samples of the beverage as the entire contents of the flask are used in the titration. 3. Suspend the sample holder over the dichromate solution and hold in place with the rubber stopper (see figure 1). 4. Store the flask overnight at 25–30°C (an incubator is ideal). 5. Next morning allow the flask to come to room temperature, then loosen the stopper carefully and remove and discard the sample holder. 6. Rinse the walls of the flask with distilled water, then add about 100 mL of distilled water and 1 mL of potassium iodide solution. Swirl to mix. 7. Prepare 3 blank titrations by adding 10 mL of acid dichromate solution to a conical flask, adding 100 mL of water and 1 mL of potassium iodide solution and swirling to mix. 8. Fill a burette with sodium thiosulfate solution and titrate each flask with sodium thiosulfate. When the brown iodine colour fades to yellow (figure 2), add 1 mL of starch solution and keep titrating until the blue colour disappears (figures 3-5). Titrate the blank flasks first, and repeat until concordant results are obtained (titres agreeing to within 0.1 mL). Then titrate each of the alcohol samples. If the three samples of the beverage do not give concordant results, further samples will need to be prepared. Figure 1 Experimental setup for oxidation of ethanol. Conical flask contains yellow acid dichromate solution and is sealed with rubber stopper. Small beaker containing beverage sample is suspended above from hook in rubber stopper. Figure 2 Titration of the iodine formed. The left flask shows the brown-coloured solution resulting from the formation of iodine. The right flask shows how the brown colour fades to pale yellow as the iodine is titrated with thiosulfate (this is the stage at which starch solution should be added). Figure 3 Upon addition of starch the solution takes on a blue-black colour due to the formation of a starch- iodine complex. Figure 4 As more thiosulfate is added and we near the titration endpoint, the blue-black colour from the starch-iodine complex fades. Figure 5 The endpoint of the titration is reached when just enough thiosulfate is added to react with all the iodine present and the solution becomes colourless. 2 Method Sample Preparation 1. Dilute beer samples 1:20 (10 mL in 200 mL) with distilled water. 2. Dilute wine samples 1:50 (20 mL in 1000 mL) with distilled water. Titration (described for one beverage) 1. Transfer 10 mL of the acid dichromate solution (see safety notes) to a 250 mL conical flask with matching rubber stopper. 2. Pipette 1 mL of the diluted beverage sample into the sample holder. This can be a 5mL beaker or glass vial. Prepare three samples of the beverage as the entire contents of the flask are used in the titration. 3. Suspend the sample holder over the dichromate solution and hold in place with the rubber stopper (see figure 1). 4. Store the flask overnight at 25–30°C (an incubator is ideal). 5. Next morning allow the flask to come to room temperature, then loosen the stopper carefully and remove and discard the sample holder. 6. Rinse the walls of the flask with distilled water, then add about 100 mL of distilled water and 1 mL of potassium iodide solution. Swirl to mix. 7. Prepare 3 blank titrations by adding 10 mL of acid dichromate solution to a conical flask, adding 100 mL of water and 1 mL of potassium iodide solution and swirling to mix. 8. Fill a burette with sodium thiosulfate solution and titrate each flask with sodium thiosulfate. When the brown iodine colour fades to yellow (figure 2), add 1 mL of starch solution and keep titrating until the blue colour disappears (figures 3-5). Titrate the blank flasks first, and repeat until concordant results are obtained (titres agreeing to within 0.1 mL). Then titrate each of the alcohol samples. If the three samples of the beverage do not give concordant results, further samples will need to be prepared. Figure 1 Experimental setup for oxidation of ethanol. Conical flask contains yellow acid dichromate solution and is sealed with rubber stopper. Small beaker containing beverage sample is suspended above from hook in rubber stopper. Figure 2 Titration of the iodine formed. The left flask shows the brown-coloured solution resulting from the formation of iodine. The right flask shows how the brown colour fades to pale yellow as the iodine is titrated with thiosulfate (this is the stage at which starch solution should be added). Figure 3 Upon addition of starch the solution takes on a blue-black colour due to the formation of a starch- iodine complex. Figure 4 As more thiosulfate is added and we near the titration endpoint, the blue-black colour from the starch-iodine complex fades. Figure 5 The endpoint of the titration is reached when just enough thiosulfate is added to react with all the iodine present and the solution becomes colourless. Method Sample Preparation 1. Dilute beer samples 1:20 (10 mL in 200 mL) with distilled water. 2. Dilute wine samples 1:50 (20 mL in 1000 mL) with distilled water. Titration (described for one beverage) 1. Transfer 10 mL of the acid dichromate solution (see safety notes) to a 250 mL conical flask with matching rubber stopper. 2. Pipette 1 mL of the diluted beverage sample into the sample holder. This can be a 5mL beaker or glass vial. Prepare three samples of the beverage as the entire contents of the flask are used in the titration. 3. Suspend the sample holder over the dichromate solution and hold in place with the rubber stopper (see figure 1). 4. Store the flask overnight at 25–30°C (an incubator is ideal). 5. Next morning allow the flask to come to room temperature, then loosen the stopper carefully and remove and discard the sample holder. 6. Rinse the walls of the flask with distilled water, then add about 100 mL of distilled water and 1 mL of potassium iodide solution. Swirl to mix. 7. Prepare 3 blank titrations by adding 10 mL of acid dichromate solution to a conical flask, adding 100 mL of water and 1 mL of potassium iodide solution and swirling to mix. 8. Fill a burette with sodium thiosulfate solution and titrate each flask with sodium thiosulfate. When the brown iodine colour fades to yellow (figure 2), add 1 mL of starch solution and keep titrating until the blue colour disappears (figures 3-5). Titrate the blank flasks first, and repeat until concordant results are obtained (titres agreeing to within 0.1 mL). Then titrate each of the alcohol samples. If the three samples of the beverage do not give concordant results, further samples will need to be prepared. Figure 1 Experimental setup for oxidation of ethanol. Conical flask contains yellow acid dichromate solution and is sealed with rubber stopper. Small beaker containing beverage sample is suspended above from hook in rubber stopper. Figure 2 Titration of the iodine formed. The left flask shows the brown-coloured solution resulting from the formation of iodine. The right flask shows how the brown colour fades to pale yellow as the iodine is titrated with thiosulfate (this is the stage at which starch solution should be added). Figure 3 Upon addition of starch the solution takes on a blue-black colour due to the formation of a starch- iodine complex. Figure 4 As more thiosulfate is added and we near the titration endpoint, the blue-black colour from the starch-iodine complex fades. Figure 5 The endpoint of the titration is reached when just enough thiosulfate is added to react with all the iodine present and the solution becomes colourless. Method Sample Preparation 1. Dilute beer samples 1:20 (10 mL in 200 mL) with distilled water. 2. Dilute wine samples 1:50 (20 mL in 1000 mL) with distilled water. Titration (described for one beverage) 1. Transfer 10 mL of the acid dichromate solution (see safety notes) to a 250 mL conical flask with matching rubber stopper. 2. Pipette 1 mL of the diluted beverage sample into the sample holder. This can be a 5mL beaker or glass vial. Prepare three samples of the beverage as the entire contents of the flask are used in the titration. 3. Suspend the sample holder over the dichromate solution and hold in place with the rubber stopper (see figure 1). 4. Store the flask overnight at 25–30°C (an incubator is ideal). 5. Next morning allow the flask to come to room temperature, then loosen the stopper carefully and remove and discard the sample holder. 6. Rinse the walls of the flask with distilled water, then add about 100 mL of distilled water and 1 mL of potassium iodide solution. Swirl to mix. 7. Prepare 3 blank titrations by adding 10 mL of acid dichromate solution to a conical flask, adding 100 mL of water and 1 mL of potassium iodide solution and swirling to mix. 8. Fill a burette with sodium thiosulfate solution and titrate each flask with sodium thiosulfate. When the brown iodine colour fades to yellow (figure 2), add 1 mL of starch solution and keep titrating until the blue colour disappears (figures 3-5). Titrate the blank flasks first, and repeat until concordant results are obtained (titres agreeing to within 0.1 mL). Then titrate each of the alcohol samples. If the three samples of the beverage do not give concordant results, further samples will need to be prepared. Figure 1 Experimental setup for oxidation of ethanol. Conical flask contains yellow acid dichromate solution and is sealed with rubber stopper. Small beaker containing beverage sample is suspended above from hook in rubber stopper. Figure 2 Titration of the iodine formed. The left flask shows the brown-coloured solution resulting from the formation of iodine. The right flask shows how the brown colour fades to pale yellow as the iodine is titrated with thiosulfate (this is the stage at which starch solution should be added). Figure 3 Upon addition of starch the solution takes on a blue-black colour due to the formation of a starch- iodine complex. Figure 4 As more thiosulfate is added and we near the titration endpoint, the blue-black colour from the starch-iodine complex fades. Figure 5 The endpoint of the titration is reached when just enough thiosulfate is added to react with all the iodine present and the solution becomes colourless. 2 Method Sample Preparation 1. Dilute beer samples 1:20 (10 mL in 200 mL) with distilled water. 2. Dilute wine samples 1:50 (20 mL in 1000 mL) with distilled water. Titration (described for one beverage) 1. Transfer 10 mL of the acid dichromate solution (see safety notes) to a 250 mL conical flask with matching rubber stopper. 2. Pipette 1 mL of the diluted beverage sample into the sample holder. This can be a 5mL beaker or glass vial. Prepare three samples of the beverage as the entire contents of the flask are used in the titration. 3. Suspend the sample holder over the dichromate solution and hold in place with the rubber stopper (see figure 1). 4. Store the flask overnight at 25–30°C (an incubator is ideal). 5. Next morning allow the flask to come to room temperature, then loosen the stopper carefully and remove and discard the sample holder. 6. Rinse the walls of the flask with distilled water, then add about 100 mL of distilled water and 1 mL of potassium iodide solution. Swirl to mix. 7. Prepare 3 blank titrations by adding 10 mL of acid dichromate solution to a conical flask, adding 100 mL of water and 1 mL of potassium iodide solution and swirling to mix. 8. Fill a burette with sodium thiosulfate solution and titrate each flask with sodium thiosulfate. When the brown iodine colour fades to yellow (figure 2), add 1 mL of starch solution and keep titrating until the blue colour disappears (figures 3-5). Titrate the blank flasks first, and repeat until concordant results are obtained (titres agreeing to within 0.1 mL). Then titrate each of the alcohol samples. If the three samples of the beverage do not give concordant results, further samples will need to be prepared. Figure 1 Experimental setup for oxidation of ethanol. Conical flask contains yellow acid dichromate solution and is sealed with rubber stopper. Small beaker containing beverage sample is suspended above from hook in rubber stopper. Figure 2 Titration of the iodine formed. The left flask shows the brown-coloured solution resulting from the formation of iodine. The right flask shows how the brown colour fades to pale yellow as the iodine is titrated with thiosulfate (this is the stage at which starch solution should be added). Figure 3 Upon addition of starch the solution takes on a blue-black colour due to the formation of a starch- iodine complex. Figure 4 As more thiosulfate is added and we near the titration endpoint, the blue-black colour from the starch-iodine complex fades. Figure 5 The endpoint of the titration is reached when just enough thiosulfate is added to react with all the iodine present and the solution becomes colourless. Solutions Needed Acid dichromate solution: (0.01 molL-1 in 5.0 molL-1 sulfuric acid) (see safety notes). Add 125 mL of water to a 500 mL conical flask. Carefully add 70 mL of concentrated sulfuric acid with constant swirling. Cool flask under cold water tap and add 0.75 g of potassium dichromate. Dilute to 250 mL with distilled water. Starch indicator solution: (1.0% solution) Dissolve 1.0 g of soluble starch in 100 mL of recently boiled water. Stir until dissolved. Sodium thiosulfate solution: (0.03molL-1 ). Add 7.44g of Na2 S2 O3 .5H2 O to a 1L volumetric flask, dissolve in distilled water and dilute up to the mark. Potassium iodide solution: (1.2molL-1 ) Dissolve 5 g of KI in 25 mL of water. Method Sample Preparation 1. Dilute beer samples 1:20 (10 mL in 200 mL) with distilled water. 2. Dilute wine samples 1:50 (20 mL in 1000 mL) with distilled water. Titration (described for one beverage) 1. Transfer 10 mL of the acid dichromate solution (see safety notes) to a 250 mL conical flask with matching rubber stopper. 2. Pipette 1mL of the diluted beverage sample into the sample holder. This can be a 5 mL beaker or glass vial. Prepare three samples of the beverage as the entire contents of the flask are used in the titration. 3. Suspend the sample holder over the dichromate solution and hold in place with the rubber stopper (see figure 1). 4. Store the flask overnight at 25–30°C (an incubator is ideal). 5. Next morning allow the flask to come to room temperature, then loosen the stopper carefully and remove and discard the sample holder. 6. Rinse the walls of the flask with distilled water, then add about 100 mL of distilled water and 1 mL of potassium iodide solution. Swirl to mix. 7. Prepare 3 blank titrations by adding 10 mL of acid dichromate solution to a conical flask, adding 100 mL of water and 1 mL of potassium iodide solution and swirling to mix. 8 Fill a burette with sodium thiosulfate solution and titrate each flask with sodium thiosulfate. When the Figure 1 Experimental setup for oxidation of ethanol. Conical flask contains yellow acid dichromate solution and is sealed with rubber stopper. Small beaker containing beverage sample is suspended above from hook in rubber stopper. Figure 2 Titration of the iodine formed. The left flask shows the brown-coloured solution resulting from the formation of iodine. The right flask shows how the brown colour fades to pale yellow as the iodine is titrated with thiosulfate (this is the stage at which starch solution should be added). Figure 3 Upon addition of starch the solution takes on a blue-black colour due to the formation of a starch-iodine complex. Figure 4 As more thiosulfate is added and we near the titration endpoint, the blue- black colour from the starch- iodine complex fades. Figure 5 The endpoint of the titration is reached when just enough thiosulfate is added to react with all the iodine present and the solution becomes colourless.
- 3. brown iodine colour fades to yellow (figure 2), add 1mL of starch solution and keep titrating until the blue colour disappears (figures 3–5). Titrate the blank flasks first, and repeat until concordant results are obtained (titres agreeing to within 0.1 mL). Then titrate each of the alcohol samples. If the three samples of the beverage do not give concordant results, further samples will need to be prepared. Result Calculations The blank titration tells you how much acid dichromate was present at the start. As no alcohol was added the full amount of the dichromate is still present. The blank titrations are carried out so the result can be compared with those of the sample titrations. 1. Determine the average volume of sodium thiosulfate used for your sample from your concordant sample results. 2. Determine the average volume of sodium thiosulfate used for the blank titration from your concordant blank results. 3. Subtract the volume of the sodium thiosulfate solution used for the sample titration from the volume used for the blank titration. This volume of the sodium thiosulfate solution is now used to determine the alcohol concentration. 4. Calculate the number of moles of sodium thiosulfate in this volume. 5. Using the equations, determine the relationship between the moles of sodium thiosulfate and the moles of ethanol. – as 6 mol of S2 O3 2- is equivalent to 1 mol of Cr2 O7 2- – and 2 mol of Cr2 O7 2- is equivalent to 3 mol of C2 H5 OH – then 1 mol of S2 O3 2- is equivalent to 0.25 mol of C2 H5 OH 6. Use this ratio to calculate the moles of alcohol in the sample solution. 7. Remember to allow for the dilution factor eg. if the dilution was 1:20 the result needs to be multiplied by 20. 8. Convert the answer in moles per litre to percentage (grams per 100mL) to compare with the figure given on the bottle of the alcoholic beverage tested. Contact Us If you have any questions or comments relating to this experiment, please contact us. Please note that this service is for senior school chemistry students in New Zealand only. We regret we are unable to respond to queries from overseas. Outreach College of Science University of Canterbury Private Bag 4800 Christchurch New Zealand Phone: +64 3 364 2178 Fax: +64 3 364 2490 Email: outreach@canterbury.ac.nz www.outreach.canterbury.ac.nz