This is a presentation about how to make a simple arduino based data logger. this data logger designed to measures and record temperature and humidity in secluded and distant area using bluetooth connection. feel free to ask question.
This is a presentation about how to make a simple arduino based data logger. this data logger designed to measures and record temperature and humidity in secluded and distant area using bluetooth connection. feel free to ask question.
This is a presentation about how to make a simple arduino based data logger. this data logger designed to measures and record temperature and humidity in secluded and distant area using bluetooth connection. feel free to ask question.
Visualizing Healthcare Data with Tableau (Toronto Central LHIN Presentation)Stefan Popowycz
This is the presentation I gave to the Toronto Central LHIN about using Tableau to visualizing healthcare metrics (April 16 2013). I also have a section on how Information Design best practices can be leveraged in order to effectively communicate your key messages to your end users.
A presentation outlining the method of colorimetry & spectroscopy. Also detailed information regarding spectrophotometer, calculation of absorbance and transmittance according to Beer & Lambert's law
It is the most common analytical technique used in biochemical estimation in clinical laboratory.
It involves the quantitative estimation of color.
A substance to be estimated colorimetrically, must be colored or it should be capable of forming chromogens (colored complexes) through the addition of reagents.
The Scientific MethodHands-On Labs, Inc.Version 42-0313-00-.docxjoshua2345678
The Scientific Method
Hands-On Labs, Inc.
Version 42-0313-00-01
Lab Report Assistant
This document is not meant to be a substitute for a formal laboratory report. The Lab Report Assistant is simply a summary of the experiment’s questions, diagrams if needed, and data tables that should be addressed in a formal lab report. The intent is to facilitate students’ writing of lab reports by providing this information in an editable file which can be sent to an instructor.
Exercise 1: Investigating the Weight of Carbon Dioxide
Data Table 1. Investigation of the Weight of Carbon
Step 1: Make observations
Baking Soda
Vinegar
Reaction
Step 2: Ask a Question and Conduct Background Research
Question
Mass (amu) of CO2
44.01 amu
Mass (amu) of Air
28.82 amu
Notes about Gases
Step 3: Formulate a Hypothesis
Hypothesis
Step 4: Test the Hypothesis
Experimental Observations
Step 5: Analyze the Data and Draw Conclusions
Conclusions (If and Why Hypothesis was Supported or Rejected)
Questions
A. Why is a hypothesis supported or rejected, rather than being proven true or false?
B. Is an experiment considered to be a failure if the hypothesis is not supported? Explain your answer.
C. What gas did you find to be in the glass after mixing the baking soda and vinegar? Explain how you are certain.
D. Did you collect quantitative or qualitative data during this experiment? Explain your answer.
E. Describe your conclusions, including the observations that led to your conclusions.
Exercise 2: Modeling Global Warming
Data Table 2. Modeling Global Warming
Global Warming Synopsis
Sources
Data Table 3. Model #1 vs. Model #2
Model #1 vs. Model #2
Independent Variable
Dependent Variable
Control
Hypothesis
Data Table 4. Temperature and Greenhouse Gases
Time (minutes)
Model #1: Temperature (°C)
Model #2: Temperature (°C)
Notes
0
5
10
15
20
25
30
35
40
45
50
55
60
Change in Temperature:
Data Table 5. Global Warming Model Results
Model #1 vs. Model #2
Change in Temperature of Model #1 (°C)
Change in Temperature of Model #2 (°C)
Graph of Results
Conclusions (If and Why Hypothesis was Supported or Rejected)
Questions
A. Compare temperature measurements between the two models. Which model showed the greatest increase in temperature? Which model showed the least increase? Answer these questions by writing a short, descriptive paragraph comparing the models.
B. Describe the role of the plastic wrap in the experiment including both the similarities and dissimilarities to greenhouse gases.
C. If a third model (Model #3) was created by adding greenhouse gases, such as water vapor or carbon dioxide, and covered with plastic wrap and put into direct sunlight with Model #2, how would the temperatures vary? Explain your answer.
D. Relate the findings of this experiment to global warming. Include the benefits of greenhouse gases, but also describe the impact that excessive amounts of greenhouse gases have on global temperat.
Five Costly Mistakes with Water Quality Sondes Webinar Deck | YSI | EXOXylem Inc.
YSI reveals some of the most frequently seen mishaps in respect to water quality sonde calibrations, hardware setup, maintenance and more. This is the slide deck from the webinar help in December 2014.
Training and education can help alleviate these issues.
You can also view the recorded webinar by registering here: http://info.xyleminc.com/5-Costly-Mistakes-Webinar-Download-Recording.html
Learn about the benefits of including inline instrumentation in your food plant or related business. This high quality white paper describes what you need to know to get the most out of utilizing inline analyzers including how they can provide:
Improved Reliability
Seamless Integration
Simplified Calibration
As well as, how to get started in getting your business prepared for inline instrumentation.
LamiaFinal data ( results).docx1- label all lanes, label ma.docxDIPESH30
Lamia/Final data ( results).docx
1- label all lanes, label marker sizes, and indicate which three lanes, containing at least one BSA sample and one E. coli sample, you are writing about.
2- lanes 2, 5, 6, 9, and 11 are BSA, lanes 14 and 15 are empty, and lanes 3, 4, 7, 8, 10, 12, and 13 are E. coli.
Lamia/Graphing page.pdf
Lamia/Guidelines.doc
Biology 105 Laboratory Fall 2013
Instructor: Ayça Akal-Strader
Guidelines for Lab Report
Lab 2: Quantification of Protein (Bradford Assay)
Your report for Lab 2: Quantification of Protein (Bradford Assay) is due the week of October 7/8/9/10. Please include the following information in your report:
Hypothesis: as usual
Introduction:
• Background/theory of Bradford Assay
• Purpose of the experiment
Results:
In addition to the specific data discussed below, your Results section should always include one or more paragraphs of text that provide:
• A brief description of the procedure
• Explanations of any charts, graphs, figures, or calculations that are included
• Statements about the most interesting/noteworthy data
Data:
1. Table of measured absorbances (like Table 2 on p. 31).
2. Table showing protein concentrations of unknowns (like Table 3 on p. 31). Say which unknowns—1, 2, or both—you used.
**Please re-make the tables for your report. DO NOT simply tear out p. 31 from your lab manual and staple it to your report.
3. Standard Curve:
• Label with title and caption
• Label axes: x-axis = Concentration (μg/ml); y-axis = Absorbance at 595 nm. Be sure to include units on Concentration. Remember that absorbance (optical density; OD) has no units.
• Plot points, leaving room to plug in your unknown absorbances to find their concentrations
• Connect the dots
(Note: Do NOT draw a straight line—unless your data really looks like a straight line. The samples we measured did not fall into the “linear range” of the spectrophotometer, and everyone’s data that I saw flattened out a lot at the high concentration end of the range. Connect your data points with a curve.)
• Indicate by drawing horizontal and vertical lines how you found the concentration of your unknowns.
Discussion:
• Did your results match your expectations? If not, why not?
• Did you have any difficulty finding the concentration of any of your unknowns?
• Do you think your measurement of protein concentration was accurate? Did your duplicates agree well? For your standards, did your absorbances increase as your protein concentrations increased?
Conclusion: as usual
Lab Report Rewrites
You may rewrite TWO of your first FIVE lab reports in an effort to improve your grade.
You do not need to rewrite the entire report; just fix the problems that caused you to lose points the first time around.
You MUST hand in the original version of your report along with your corrected version. If you do not have the original attached, we will not accept your rewrite.
Your final grade on the rewritten report will be ...
Today’s laboratories want more from their liquid chromatography system: Higher performance. Better reliability. More consistent and comprehensive analytical workflows. And most of all, more predictable and reproducible results. At the same time, you want
Similar to Assignment presentation data logging (20)
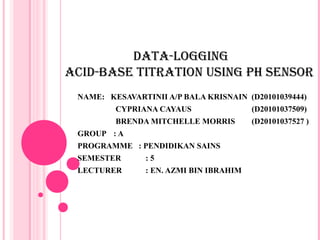
1. DATA-LOGGING
ACID-BASE TITRATION USING PH SENSOR
NAME: KESAVARTINII A/P BALA KRISNAIN (D20101039444)
CYPRIANA CAYAUS (D20101037509)
BRENDA MITCHELLE MORRIS (D20101037527 )
GROUP : A
PROGRAMME : PENDIDIKAN SAINS
SEMESTER :5
LECTURER : EN. AZMI BIN IBRAHIM
2. DATA LOGGING
Theprocess where computer used
to collect data through sensors,
data analyzed and saved, and the
results of the collection and
analysis become the output.
The data logger is the electronic
instrument that records the
measurement over time.
4. Sensors
- Sensor is device that Computer
measure physical - used to record the
quantity and send the data and display the
data in terms of data as table or
voltage to the graph by using
computer to represent specific software
the quantity
Interface
-used to connect between sensors and
computers,
-responsible for converting the voltage from
sensor into digital voltage that can be read by
the computer and prevent excessive voltage that
can damage the computer
5. ADVANTAGES AND
DISADVANTAGES
Advantages Disadvantages
1. New innovative 1. If the data logging
experiments and equipment breaks down,
dangerous some data could be lost
experiments become and not recorded
possible 2. Equipments needed in
2. More accurate result data logging are very
as there is no expensive even if it is
possibility of human just for a small task
error
3. Caused loss of
3. Easier to understand conventional methods of
scientific data collection and
experimentation and reduced the practice of
scientific concept, and graphing skills
better graphing.
7. What we know about acid and bases?
Acids
- Level of pH: 1 to 6
- Example: Lemons, orange juice and vinegar are
examples of acids.
Bases
- Level of pH: 8 to 14
- Example: Mustards and medicines are examples of a
base. Flavor is added to medicines to offset the bitter
taste.
Water
- Level of pH: 7, Natural
12. QUESTIONS
1. What does the graph tell you about the amount of
hydrochloric acid and sodium hydroxide needed for
the titration?
2. What does the first derivatives graph represents?
3. Explain the difference between an endpoint and
equivalence point in a titration.
4. Can we titrate a solution of unknown concentration
with another solution of unknown concentration and
still get a meaningful answer? Explain.
5. What is the chemical equation involved in this acid-
base titration?
13. ENHANCE
1. Citric acid
- Plays a role in one famous stomach remedy, or
antacid.
- Antacids are more generally associated with alkaline
substances, used for their ability to neutralize stomach
acid.
Example : The fizz in Alka-Seltzer;
14. 2. Aluminum hydroxide
-Is an interesting base, because it has a wide number of
applications, including its use in antacids.
- It reacts with and neutralizes stomach acid
(Hydrochloric acid, HCl).
Example: found in commercial antacids such as Di-
Gel™, Gelusil™, and Maalox™(relief of heartburn and
acid indigestion).
16. 3. Baking soda (sodium bicarbonate and sodium
hydrogen)
- Use in baking and other application such as in Alka-
Seltzer (addition of citric acid to improve the flavour),
fighting fires (smoothers flames by obstructing the
flow of oxygen to the fire)
- Baking Powder = Baking soda + weak acid = carbon
dioxide
(causes dough and batters to rise)
17. QUESTION :
Why Stomach Acid might need to be neutralized?
substance inside the body that is able to digest the
living tissue around itrequire some of it to be
neutralized.
when the acid leaks upward through a valve into the
oesophagus, causing what is known as acid reflux or
heartburn.
heartburn is when the stomach acids get into the
oesophagus and eat away at the lining, causing a
burning sensation in the chest and throat.
to reduce the leakage of stomach acid into the
oesophagus, neutralization of some of the acid would
be required, avoid the oesophagus receives permanent
damage. In order to do this antacids