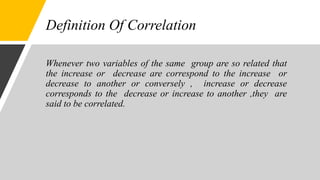
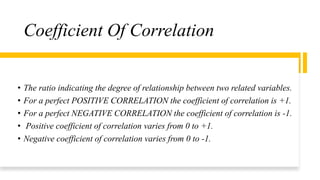
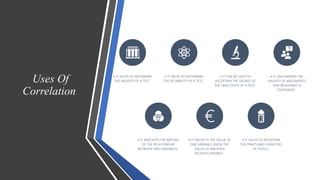
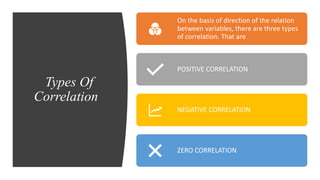
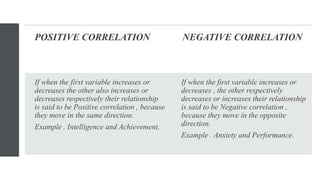
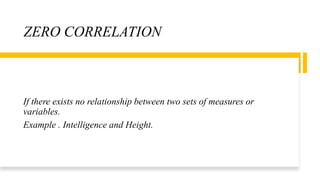
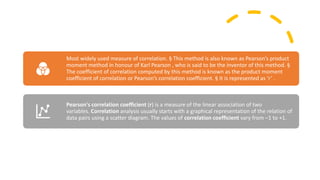
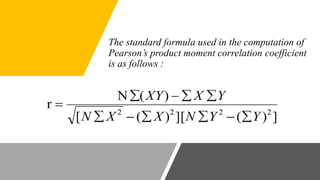
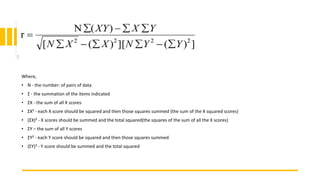
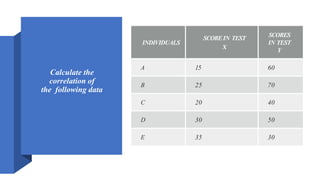
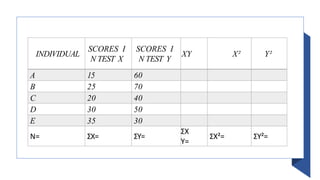
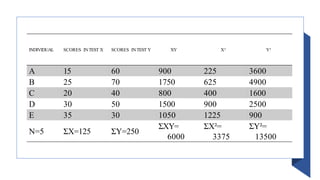
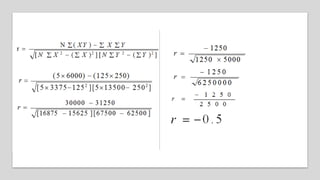
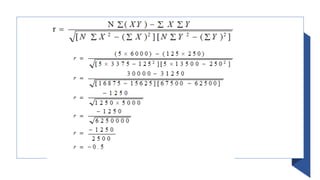
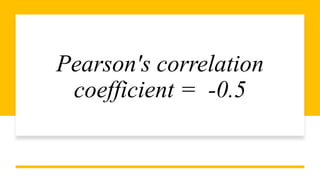
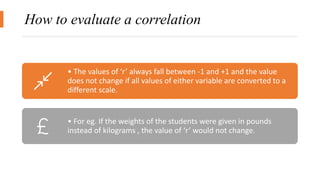
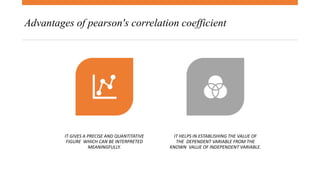
SlideShare a Scribd company logo
Pearson's correlation coefficient
Submitted by: Group B
Name Roll Batch
Md. Topu Kawser 28 58thB
Azizul Haque Bhuiyan 07 58thB
Md Maidul Islam Chowdhury 06 58thB
Kaptusha akter monisha 26 59thB
Ramnunsang bawm 37 58thB
Department of Business Administration
Dhaka International University.
Meaning Of Correlation
The method of correlation
is developed by Francis Galton in 1885.
It is the relationship between two sets
of scores or variables.
Definition Of Correlation
Whenever two variables of the same group are so related that
the increase or decrease are correspond to the increase or
decrease to another or conversely , increase or decrease
corresponds to the decrease or increase to another ,they are
said to be correlated.
Coefficient Of Correlation
• The ratio indicating the degree of relationship between two related variables.
• For a perfect POSITIVE CORRELATION the coefficient of correlation is +1.
• For a perfect NEGATIVE CORRELATION the coefficient of correlation is -1.
• Positive coefficient of correlation varies from 0 to +1.
• Negative coefficient of correlation varies from 0 to -1.
Uses Of
Correlation
• IT HELPS TO DETERMINE
THE VALIDITY OF A TEST.
• IT HELPS TO DETERMINE
THE RELIABILITY OF A TEST.
• IT CAN BE USED TO
ASCERTAIN THE DEGREE OF
THE OBJECTIVITY OF A TEST.
• IT CAN ANSWER THE
VALIDITY OF ARGUMENTS
FOR OR AGAINST A
STATEMENT.
• IT INDICATES THE NATURE
OF THE RELATIONSHIP
BETWEEN TWO VARIABLES.
• IT PREDICTS THE VALUE OF
ONE VARIABLE GIVEN THE
VALUE OF ANOTHER
RELATED VARIABLE.
• IT HELPS TO ASCERTAIN
THE TRAITS AND CAPACITIES
OF PUPILS.
Types Of
Correlation
On the basis of direction of the relation
between variables, there are three types
of correlation. That are
POSITIVE CORRELATION
NEGATIVE CORRELATION
ZERO CORRELATION
POSITIVE CORRELATION NEGATIVE CORRELATION
If when the first variable increases or
decreases the other also increases or
decreases respectively their relationship
is said to be Positive correlation , because
they move in the same direction.
Example . Intelligence and Achievement.
If when the first variable increases or
decreases , the other respectively
decreases or increases their relationship
is said to be Negative correlation ,
because they move in the opposite
direction.
Example . Anxiety and Performance.
ZERO CORRELATION
If there exists no relationship between two sets of measures or
variables.
Example . Intelligence and Height.
Computation Of Coefficient Of Correlation
There are two different methods of computing
coefficient of correlation . they are ,
• Rank difference method
• PRODUCT MOMENT METHOD or pearson's
correlation coefficient .
Most widely used measure of correlation. § This method is also known as Pearson’s product
moment method in honour of Karl Pearson , who is said to be the inventor of this method. §
The coefficient of correlation computed by this method is known as the product moment
coefficient of correlation or Pearson’s correlation coefficient. § It is represented as ‘r’ .
Pearson's correlation coefficient (r) is a measure of the linear association of two
variables. Correlation analysis usually starts with a graphical representation of the relation of
data pairs using a scatter diagram. The values of correlation coefficient vary from –1 to +1.
The standard formula used in the computation of
Pearson’s product moment correlation coefficient
is as follows :
Where,
• N - the number: of pairs of data
• Ʃ - the summation of the items indicated
• ƩX - the sum of all X scores
• ƩX² - each X score should be squared and then those squares summed {the sum of the X squared scores}
• (ƩX)² - X scores should be summed and the total squared(the squares of the sum of all the X scores)
• ƩY – the sum of all Y scores
• ƩY² - each Y score should be squared and then those squares summed
• (ƩY)² - Y score should be summed and the total squared
Calculate the
correlation of
the following data
INDIVIDUALS
SCOREIN TEST
X
SCORES
IN TEST
Y
A 15 60
B 25 70
C 20 40
D 30 50
E 35 30
INDIVIDUAL
SCORES I
N TEST X
SCORES I
N TEST Y
XY X² Y²
A 15 60
B 25 70
C 20 40
D 30 50
E 35 30
N= ƩX= ƩY=
ƩX
Y=
ƩX²= ƩY²=
INDIVIDUAL SCORES INTEST X SCORES INTEST Y XY X² Y²
A 15 60 900 225 3600
B 25 70 1750 625 4900
C 20 40 800 400 1600
D 30 50 1500 900 2500
E 35 30 1050 1225 900
N=5 ƩX=125 ƩY=250
ƩXY=
6000
ƩX²=
3375
ƩY²=
13500
Pearson's correlation
coefficient = -0.5
How to evaluate a correlation
• The values of ‘r’ always fall between -1 and +1 and the value
does not change if all values of either variable are converted to a
different scale.
• For eg. If the weights of the students were given in pounds
instead of kilograms , the value of ‘r’ would not change.
Advantages of pearson's correlation coefficient
IT GIVES A PRECISE AND QUANTITATIVE
FIGURE WHICH CAN BE INTERPRETED
MEANINGFULLY.
IT HELPS IN ESTABLISHING THE VALUE OF
THE DEPENDENT VARIABLE FROM THE
KNOWN VALUE OF INDEPENDENT VARIABLE.
Limitations of pearson's correlation coefficient
This method assumes that there is a linear relationship between the
variables under study regardless of the fact whether it exists or not.
Compared to other methods , the computation of correlation
coefficient by this method is time consuming.
The value of the coefficient is unduly affected by extreme items.
Thank you

More Related Content

What's hot

Mann - Whitney U test.pptx
Mann - Whitney U test.pptxMann - Whitney U test.pptx
Mann - Whitney U test.pptx
Melba Shaya Sweety
 
Chi square
Chi squareChi square
Chi square
PoojaVishnoi7
 
Factor analysis
Factor analysisFactor analysis
Factor analysis
ashishjaswal
 
Spearman Rank
Spearman RankSpearman Rank
Spearman Rank
i-study-co-uk
 
What is Simple Linear Regression and How Can an Enterprise Use this Technique...
What is Simple Linear Regression and How Can an Enterprise Use this Technique...What is Simple Linear Regression and How Can an Enterprise Use this Technique...
What is Simple Linear Regression and How Can an Enterprise Use this Technique...
Smarten Augmented Analytics
 
Unit-I Measures of Dispersion- Biostatistics - Ravinandan A P.pdf
Unit-I Measures of Dispersion- Biostatistics - Ravinandan A P.pdfUnit-I Measures of Dispersion- Biostatistics - Ravinandan A P.pdf
Unit-I Measures of Dispersion- Biostatistics - Ravinandan A P.pdf
Ravinandan A P
 
Wilcoxon rank-sum-test
Wilcoxon rank-sum-testWilcoxon rank-sum-test
Wilcoxon rank-sum-test
MSU-IIT
 
Simple & Multiple Regression Analysis
Simple & Multiple Regression AnalysisSimple & Multiple Regression Analysis
Simple & Multiple Regression Analysis
Shailendra Tomar
 
Correlation- an introduction and application of spearman rank correlation by...
Correlation- an introduction and application of spearman rank correlation  by...Correlation- an introduction and application of spearman rank correlation  by...
Correlation- an introduction and application of spearman rank correlation by...
Gunjan Verma
 
Spearman rank correlation coefficient
Spearman rank correlation coefficientSpearman rank correlation coefficient
Spearman rank correlation coefficient
Karishma Chaudhary
 
Regression ppt
Regression pptRegression ppt
Regression ppt
Shraddha Tiwari
 
ANOVA Test
ANOVA TestANOVA Test
wilcoxon signed rank test
wilcoxon signed rank testwilcoxon signed rank test
wilcoxon signed rank test
raj shekar
 
regression and correlation
regression and correlationregression and correlation
regression and correlation
Priya Sharma
 
Correlation
CorrelationCorrelation
Correlation
Anjali Awasthi
 
Correlation and Regression Analysis using SPSS and Microsoft Excel
Correlation and Regression Analysis using SPSS and Microsoft ExcelCorrelation and Regression Analysis using SPSS and Microsoft Excel
Correlation and Regression Analysis using SPSS and Microsoft Excel
Setia Pramana
 
Simple Correlation : Karl Pearson’s Correlation co- efficient and Spearman’s ...
Simple Correlation : Karl Pearson’s Correlation co- efficient and Spearman’s ...Simple Correlation : Karl Pearson’s Correlation co- efficient and Spearman’s ...
Simple Correlation : Karl Pearson’s Correlation co- efficient and Spearman’s ...
RekhaChoudhary24
 

What's hot (20)

Mann - Whitney U test.pptx
Mann - Whitney U test.pptxMann - Whitney U test.pptx
Mann - Whitney U test.pptx
 
Chi square
Chi squareChi square
Chi square
 
Factor analysis
Factor analysisFactor analysis
Factor analysis
 
Spearman Rank
Spearman RankSpearman Rank
Spearman Rank
 
What is Simple Linear Regression and How Can an Enterprise Use this Technique...
What is Simple Linear Regression and How Can an Enterprise Use this Technique...What is Simple Linear Regression and How Can an Enterprise Use this Technique...
What is Simple Linear Regression and How Can an Enterprise Use this Technique...
 
Unit-I Measures of Dispersion- Biostatistics - Ravinandan A P.pdf
Unit-I Measures of Dispersion- Biostatistics - Ravinandan A P.pdfUnit-I Measures of Dispersion- Biostatistics - Ravinandan A P.pdf
Unit-I Measures of Dispersion- Biostatistics - Ravinandan A P.pdf
 
Wilcoxon rank-sum-test
Wilcoxon rank-sum-testWilcoxon rank-sum-test
Wilcoxon rank-sum-test
 
Simple & Multiple Regression Analysis
Simple & Multiple Regression AnalysisSimple & Multiple Regression Analysis
Simple & Multiple Regression Analysis
 
Correlation- an introduction and application of spearman rank correlation by...
Correlation- an introduction and application of spearman rank correlation  by...Correlation- an introduction and application of spearman rank correlation  by...
Correlation- an introduction and application of spearman rank correlation by...
 
Regression analysis
Regression analysisRegression analysis
Regression analysis
 
Spearman rank correlation coefficient
Spearman rank correlation coefficientSpearman rank correlation coefficient
Spearman rank correlation coefficient
 
Regression ppt
Regression pptRegression ppt
Regression ppt
 
ANOVA Test
ANOVA TestANOVA Test
ANOVA Test
 
Non-Parametric Tests
Non-Parametric TestsNon-Parametric Tests
Non-Parametric Tests
 
wilcoxon signed rank test
wilcoxon signed rank testwilcoxon signed rank test
wilcoxon signed rank test
 
regression and correlation
regression and correlationregression and correlation
regression and correlation
 
Confidence Intervals
Confidence IntervalsConfidence Intervals
Confidence Intervals
 
Correlation
CorrelationCorrelation
Correlation
 
Correlation and Regression Analysis using SPSS and Microsoft Excel
Correlation and Regression Analysis using SPSS and Microsoft ExcelCorrelation and Regression Analysis using SPSS and Microsoft Excel
Correlation and Regression Analysis using SPSS and Microsoft Excel
 
Simple Correlation : Karl Pearson’s Correlation co- efficient and Spearman’s ...
Simple Correlation : Karl Pearson’s Correlation co- efficient and Spearman’s ...Simple Correlation : Karl Pearson’s Correlation co- efficient and Spearman’s ...
Simple Correlation : Karl Pearson’s Correlation co- efficient and Spearman’s ...
 

Similar to Pearson's correlation coefficient 

Correlation
CorrelationCorrelation
Correlation
HemamaliniSakthivel
 
Karl pearson's coefficient of correlation
Karl pearson's coefficient of correlationKarl pearson's coefficient of correlation
Karl pearson's coefficient of correlation
teenathankachen1993
 
Statistics ppt
Statistics pptStatistics ppt
Statistics ppt
PMuruganBalaMurugan
 
Correlation Analysis
Correlation AnalysisCorrelation Analysis
Correlation Analysis
Birinder Singh Gulati
 
Correlation analysis
Correlation analysis Correlation analysis
Correlation analysis
Anil Pokhrel
 
correlation for statistics for 2nd year students
correlation for statistics for 2nd year studentscorrelation for statistics for 2nd year students
correlation for statistics for 2nd year students
SoujanyaLk1
 
Study of Correlation
Study of Correlation Study of Correlation
Study of Correlation
Vikas Kumar Singh
 
Power point presentationCORRELATION.pptx
Power point presentationCORRELATION.pptxPower point presentationCORRELATION.pptx
Power point presentationCORRELATION.pptx
Simran Kaur
 
Correlation
CorrelationCorrelation
Correlation
rkalidasan
 
correlation-ppt [Autosaved].pptx statistics in BBA from parul University
correlation-ppt [Autosaved].pptx statistics in BBA from parul Universitycorrelation-ppt [Autosaved].pptx statistics in BBA from parul University
correlation-ppt [Autosaved].pptx statistics in BBA from parul University
PrafullRai4
 
Statistical analysis in SPSS_
Statistical analysis in SPSS_ Statistical analysis in SPSS_
Statistical analysis in SPSS_
Dr. Anugamini Priya
 
Correlation analysis
Correlation analysis Correlation analysis
Correlation analysis
Misab P.T
 
Regression & correlation coefficient
Regression & correlation coefficientRegression & correlation coefficient
Regression & correlation coefficient
MuhamamdZiaSamad
 
Correlation and Regression
Correlation and Regression Correlation and Regression
Correlation and Regression
Dr. Tushar J Bhatt
 
RMBS - CORRELATION.pptx
RMBS - CORRELATION.pptxRMBS - CORRELATION.pptx
RMBS - CORRELATION.pptx
Kaviya Santhakumar
 
Correlationanalysis
CorrelationanalysisCorrelationanalysis
Correlationanalysis
Libu Thomas
 
correlation ;.pptx
correlation ;.pptxcorrelation ;.pptx
correlation ;.pptx
Melba Shaya Sweety
 
correlation.pptx
correlation.pptxcorrelation.pptx
correlation.pptx
Melba Shaya Sweety
 
Correlation - Biostatistics
Correlation - BiostatisticsCorrelation - Biostatistics
Correlation - Biostatistics
Fahmida Swati
 

Similar to Pearson's correlation coefficient  (20)

Correlation
CorrelationCorrelation
Correlation
 
Karl pearson's coefficient of correlation
Karl pearson's coefficient of correlationKarl pearson's coefficient of correlation
Karl pearson's coefficient of correlation
 
Statistics ppt
Statistics pptStatistics ppt
Statistics ppt
 
Correlation Analysis
Correlation AnalysisCorrelation Analysis
Correlation Analysis
 
Correlation analysis
Correlation analysis Correlation analysis
Correlation analysis
 
correlation for statistics for 2nd year students
correlation for statistics for 2nd year studentscorrelation for statistics for 2nd year students
correlation for statistics for 2nd year students
 
Study of Correlation
Study of Correlation Study of Correlation
Study of Correlation
 
Power point presentationCORRELATION.pptx
Power point presentationCORRELATION.pptxPower point presentationCORRELATION.pptx
Power point presentationCORRELATION.pptx
 
Correlation
CorrelationCorrelation
Correlation
 
correlation-ppt [Autosaved].pptx statistics in BBA from parul University
correlation-ppt [Autosaved].pptx statistics in BBA from parul Universitycorrelation-ppt [Autosaved].pptx statistics in BBA from parul University
correlation-ppt [Autosaved].pptx statistics in BBA from parul University
 
Statistical analysis in SPSS_
Statistical analysis in SPSS_ Statistical analysis in SPSS_
Statistical analysis in SPSS_
 
Correlation
CorrelationCorrelation
Correlation
 
Correlation analysis
Correlation analysis Correlation analysis
Correlation analysis
 
Regression & correlation coefficient
Regression & correlation coefficientRegression & correlation coefficient
Regression & correlation coefficient
 
Correlation and Regression
Correlation and Regression Correlation and Regression
Correlation and Regression
 
RMBS - CORRELATION.pptx
RMBS - CORRELATION.pptxRMBS - CORRELATION.pptx
RMBS - CORRELATION.pptx
 
Correlationanalysis
CorrelationanalysisCorrelationanalysis
Correlationanalysis
 
correlation ;.pptx
correlation ;.pptxcorrelation ;.pptx
correlation ;.pptx
 
correlation.pptx
correlation.pptxcorrelation.pptx
correlation.pptx
 
Correlation - Biostatistics
Correlation - BiostatisticsCorrelation - Biostatistics
Correlation - Biostatistics
 

More from Topu Kawser

PRESENTATION ON THE INTRODUCTION TO  MACROECONOMICS
PRESENTATION ON THE INTRODUCTIONTO  MACROECONOMICSPRESENTATION ON THE INTRODUCTIONTO  MACROECONOMICS
PRESENTATION ON THE INTRODUCTION TO  MACROECONOMICS
Topu Kawser
 
5th generation of computers
5th generation of computers5th generation of computers
5th generation of computers
Topu Kawser
 
THE 6th GENERATIONS OF COMPUTERS .
THE 6th GENERATIONS OF COMPUTERS .THE 6th GENERATIONS OF COMPUTERS .
THE 6th GENERATIONS OF COMPUTERS .
Topu Kawser
 
THE FOURTH GENERATIONS OF COMPUTERS.(1972-1984)
THE FOURTH GENERATIONS OF COMPUTERS.(1972-1984)THE FOURTH GENERATIONS OF COMPUTERS.(1972-1984)
THE FOURTH GENERATIONS OF COMPUTERS.(1972-1984)
Topu Kawser
 
Otobi
OtobiOtobi
Western marine shipyard limited
Western marine shipyard limitedWestern marine shipyard limited
Western marine shipyard limited
Topu Kawser
 
Arong
ArongArong
Akij group
Akij groupAkij group
Akij group
Topu Kawser
 
A.k. khan & company ltd
A.k. khan & company ltd A.k. khan & company ltd
A.k. khan & company ltd
Topu Kawser
 
Banckground to bangladesh liberation war
Banckground to bangladesh liberation warBanckground to bangladesh liberation war
Banckground to bangladesh liberation war
Topu Kawser
 
History Of Bangladesh
History Of BangladeshHistory Of Bangladesh
History Of Bangladesh
Topu Kawser
 
Influence of product characteristics on rate Adoption
Influence of product characteristics on rate AdoptionInfluence of product characteristics on rate Adoption
Influence of product characteristics on rate Adoption
Topu Kawser
 
NEEDS, WANTS, DEMANDS AND MARKETING MYOPIA
NEEDS, WANTS, DEMANDS AND MARKETING MYOPIANEEDS, WANTS, DEMANDS AND MARKETING MYOPIA
NEEDS, WANTS, DEMANDS AND MARKETING MYOPIA
Topu Kawser
 
Participants In The Business Buying Process
Participants In The Business Buying Process Participants In The Business Buying Process
Participants In The Business Buying Process
Topu Kawser
 
MARKETING CONCEPT
MARKETING CONCEPTMARKETING CONCEPT
MARKETING CONCEPT
Topu Kawser
 
Major types of buying situations
Major types of buying situationsMajor types of buying situations
Major types of buying situations
Topu Kawser
 
SELLING CONCEPT VS MARKETING CONCEPT
SELLING CONCEPT VS MARKETING CONCEPTSELLING CONCEPT VS MARKETING CONCEPT
SELLING CONCEPT VS MARKETING CONCEPT
Topu Kawser
 
The product market expansion grid
The product market expansion gridThe product market expansion grid
The product market expansion grid
Topu Kawser
 
Types of Buying Decision Behavior
Types of Buying Decision Behavior Types of Buying Decision Behavior
Types of Buying Decision Behavior
Topu Kawser
 

More from Topu Kawser (19)

PRESENTATION ON THE INTRODUCTION TO  MACROECONOMICS
PRESENTATION ON THE INTRODUCTIONTO  MACROECONOMICSPRESENTATION ON THE INTRODUCTIONTO  MACROECONOMICS
PRESENTATION ON THE INTRODUCTION TO  MACROECONOMICS
 
5th generation of computers
5th generation of computers5th generation of computers
5th generation of computers
 
THE 6th GENERATIONS OF COMPUTERS .
THE 6th GENERATIONS OF COMPUTERS .THE 6th GENERATIONS OF COMPUTERS .
THE 6th GENERATIONS OF COMPUTERS .
 
THE FOURTH GENERATIONS OF COMPUTERS.(1972-1984)
THE FOURTH GENERATIONS OF COMPUTERS.(1972-1984)THE FOURTH GENERATIONS OF COMPUTERS.(1972-1984)
THE FOURTH GENERATIONS OF COMPUTERS.(1972-1984)
 
Otobi
OtobiOtobi
Otobi
 
Western marine shipyard limited
Western marine shipyard limitedWestern marine shipyard limited
Western marine shipyard limited
 
Arong
ArongArong
Arong
 
Akij group
Akij groupAkij group
Akij group
 
A.k. khan & company ltd
A.k. khan & company ltd A.k. khan & company ltd
A.k. khan & company ltd
 
Banckground to bangladesh liberation war
Banckground to bangladesh liberation warBanckground to bangladesh liberation war
Banckground to bangladesh liberation war
 
History Of Bangladesh
History Of BangladeshHistory Of Bangladesh
History Of Bangladesh
 
Influence of product characteristics on rate Adoption
Influence of product characteristics on rate AdoptionInfluence of product characteristics on rate Adoption
Influence of product characteristics on rate Adoption
 
NEEDS, WANTS, DEMANDS AND MARKETING MYOPIA
NEEDS, WANTS, DEMANDS AND MARKETING MYOPIANEEDS, WANTS, DEMANDS AND MARKETING MYOPIA
NEEDS, WANTS, DEMANDS AND MARKETING MYOPIA
 
Participants In The Business Buying Process
Participants In The Business Buying Process Participants In The Business Buying Process
Participants In The Business Buying Process
 
MARKETING CONCEPT
MARKETING CONCEPTMARKETING CONCEPT
MARKETING CONCEPT
 
Major types of buying situations
Major types of buying situationsMajor types of buying situations
Major types of buying situations
 
SELLING CONCEPT VS MARKETING CONCEPT
SELLING CONCEPT VS MARKETING CONCEPTSELLING CONCEPT VS MARKETING CONCEPT
SELLING CONCEPT VS MARKETING CONCEPT
 
The product market expansion grid
The product market expansion gridThe product market expansion grid
The product market expansion grid
 
Types of Buying Decision Behavior
Types of Buying Decision Behavior Types of Buying Decision Behavior
Types of Buying Decision Behavior
 

Recently uploaded

GIÁO ÁN DẠY THÊM (KẾ HOẠCH BÀI BUỔI 2) - TIẾNG ANH 8 GLOBAL SUCCESS (2 CỘT) N...
GIÁO ÁN DẠY THÊM (KẾ HOẠCH BÀI BUỔI 2) - TIẾNG ANH 8 GLOBAL SUCCESS (2 CỘT) N...GIÁO ÁN DẠY THÊM (KẾ HOẠCH BÀI BUỔI 2) - TIẾNG ANH 8 GLOBAL SUCCESS (2 CỘT) N...
GIÁO ÁN DẠY THÊM (KẾ HOẠCH BÀI BUỔI 2) - TIẾNG ANH 8 GLOBAL SUCCESS (2 CỘT) N...
Nguyen Thanh Tu Collection
 
ESC Beyond Borders _From EU to You_ InfoPack general.pdf
ESC Beyond Borders _From EU to You_ InfoPack general.pdfESC Beyond Borders _From EU to You_ InfoPack general.pdf
ESC Beyond Borders _From EU to You_ InfoPack general.pdf
Fundacja Rozwoju Społeczeństwa Przedsiębiorczego
 
special B.ed 2nd year old paper_20240531.pdf
special B.ed 2nd year old paper_20240531.pdfspecial B.ed 2nd year old paper_20240531.pdf
special B.ed 2nd year old paper_20240531.pdf
Special education needs
 
Introduction to Quality Improvement Essentials
Introduction to Quality Improvement EssentialsIntroduction to Quality Improvement Essentials
Introduction to Quality Improvement Essentials
Excellence Foundation for South Sudan
 
The French Revolution Class 9 Study Material pdf free download
The French Revolution Class 9 Study Material pdf free downloadThe French Revolution Class 9 Study Material pdf free download
The French Revolution Class 9 Study Material pdf free download
Vivekanand Anglo Vedic Academy
 
The Challenger.pdf DNHS Official Publication
The Challenger.pdf DNHS Official PublicationThe Challenger.pdf DNHS Official Publication
The Challenger.pdf DNHS Official Publication
Delapenabediema
 
How libraries can support authors with open access requirements for UKRI fund...
How libraries can support authors with open access requirements for UKRI fund...How libraries can support authors with open access requirements for UKRI fund...
How libraries can support authors with open access requirements for UKRI fund...
Jisc
 
Synthetic Fiber Construction in lab .pptx
Synthetic Fiber Construction in lab .pptxSynthetic Fiber Construction in lab .pptx
Synthetic Fiber Construction in lab .pptx
Pavel ( NSTU)
 
Overview on Edible Vaccine: Pros & Cons with Mechanism
Overview on Edible Vaccine: Pros & Cons with MechanismOverview on Edible Vaccine: Pros & Cons with Mechanism
Overview on Edible Vaccine: Pros & Cons with Mechanism
DeeptiGupta154
 
2024.06.01 Introducing a competency framework for languag learning materials ...
2024.06.01 Introducing a competency framework for languag learning materials ...2024.06.01 Introducing a competency framework for languag learning materials ...
2024.06.01 Introducing a competency framework for languag learning materials ...
Sandy Millin
 
How to Make a Field invisible in Odoo 17
How to Make a Field invisible in Odoo 17How to Make a Field invisible in Odoo 17
How to Make a Field invisible in Odoo 17
Celine George
 
Mule 4.6 & Java 17 Upgrade | MuleSoft Mysore Meetup #46
Mule 4.6 & Java 17 Upgrade | MuleSoft Mysore Meetup #46Mule 4.6 & Java 17 Upgrade | MuleSoft Mysore Meetup #46
Mule 4.6 & Java 17 Upgrade | MuleSoft Mysore Meetup #46
MysoreMuleSoftMeetup
 
Home assignment II on Spectroscopy 2024 Answers.pdf
Home assignment II on Spectroscopy 2024 Answers.pdfHome assignment II on Spectroscopy 2024 Answers.pdf
Home assignment II on Spectroscopy 2024 Answers.pdf
Tamralipta Mahavidyalaya
 
Cambridge International AS A Level Biology Coursebook - EBook (MaryFosbery J...
Cambridge International AS  A Level Biology Coursebook - EBook (MaryFosbery J...Cambridge International AS  A Level Biology Coursebook - EBook (MaryFosbery J...
Cambridge International AS A Level Biology Coursebook - EBook (MaryFosbery J...
AzmatAli747758
 
Chapter 3 - Islamic Banking Products and Services.pptx
Chapter 3 - Islamic Banking Products and Services.pptxChapter 3 - Islamic Banking Products and Services.pptx
Chapter 3 - Islamic Banking Products and Services.pptx
Mohd Adib Abd Muin, Senior Lecturer at Universiti Utara Malaysia
 
Sectors of the Indian Economy - Class 10 Study Notes pdf
Sectors of the Indian Economy - Class 10 Study Notes pdfSectors of the Indian Economy - Class 10 Study Notes pdf
Sectors of the Indian Economy - Class 10 Study Notes pdf
Vivekanand Anglo Vedic Academy
 
Additional Benefits for Employee Website.pdf
Additional Benefits for Employee Website.pdfAdditional Benefits for Employee Website.pdf
Additional Benefits for Employee Website.pdf
joachimlavalley1
 
Polish students' mobility in the Czech Republic
Polish students' mobility in the Czech RepublicPolish students' mobility in the Czech Republic
Polish students' mobility in the Czech Republic
Anna Sz.
 
Palestine last event orientationfvgnh .pptx
Palestine last event orientationfvgnh .pptxPalestine last event orientationfvgnh .pptx
Palestine last event orientationfvgnh .pptx
RaedMohamed3
 
How to Break the cycle of negative Thoughts
How to Break the cycle of negative ThoughtsHow to Break the cycle of negative Thoughts
How to Break the cycle of negative Thoughts
Col Mukteshwar Prasad
 

Recently uploaded (20)

GIÁO ÁN DẠY THÊM (KẾ HOẠCH BÀI BUỔI 2) - TIẾNG ANH 8 GLOBAL SUCCESS (2 CỘT) N...
GIÁO ÁN DẠY THÊM (KẾ HOẠCH BÀI BUỔI 2) - TIẾNG ANH 8 GLOBAL SUCCESS (2 CỘT) N...GIÁO ÁN DẠY THÊM (KẾ HOẠCH BÀI BUỔI 2) - TIẾNG ANH 8 GLOBAL SUCCESS (2 CỘT) N...
GIÁO ÁN DẠY THÊM (KẾ HOẠCH BÀI BUỔI 2) - TIẾNG ANH 8 GLOBAL SUCCESS (2 CỘT) N...
 
ESC Beyond Borders _From EU to You_ InfoPack general.pdf
ESC Beyond Borders _From EU to You_ InfoPack general.pdfESC Beyond Borders _From EU to You_ InfoPack general.pdf
ESC Beyond Borders _From EU to You_ InfoPack general.pdf
 
special B.ed 2nd year old paper_20240531.pdf
special B.ed 2nd year old paper_20240531.pdfspecial B.ed 2nd year old paper_20240531.pdf
special B.ed 2nd year old paper_20240531.pdf
 
Introduction to Quality Improvement Essentials
Introduction to Quality Improvement EssentialsIntroduction to Quality Improvement Essentials
Introduction to Quality Improvement Essentials
 
The French Revolution Class 9 Study Material pdf free download
The French Revolution Class 9 Study Material pdf free downloadThe French Revolution Class 9 Study Material pdf free download
The French Revolution Class 9 Study Material pdf free download
 
The Challenger.pdf DNHS Official Publication
The Challenger.pdf DNHS Official PublicationThe Challenger.pdf DNHS Official Publication
The Challenger.pdf DNHS Official Publication
 
How libraries can support authors with open access requirements for UKRI fund...
How libraries can support authors with open access requirements for UKRI fund...How libraries can support authors with open access requirements for UKRI fund...
How libraries can support authors with open access requirements for UKRI fund...
 
Synthetic Fiber Construction in lab .pptx
Synthetic Fiber Construction in lab .pptxSynthetic Fiber Construction in lab .pptx
Synthetic Fiber Construction in lab .pptx
 
Overview on Edible Vaccine: Pros & Cons with Mechanism
Overview on Edible Vaccine: Pros & Cons with MechanismOverview on Edible Vaccine: Pros & Cons with Mechanism
Overview on Edible Vaccine: Pros & Cons with Mechanism
 
2024.06.01 Introducing a competency framework for languag learning materials ...
2024.06.01 Introducing a competency framework for languag learning materials ...2024.06.01 Introducing a competency framework for languag learning materials ...
2024.06.01 Introducing a competency framework for languag learning materials ...
 
How to Make a Field invisible in Odoo 17
How to Make a Field invisible in Odoo 17How to Make a Field invisible in Odoo 17
How to Make a Field invisible in Odoo 17
 
Mule 4.6 & Java 17 Upgrade | MuleSoft Mysore Meetup #46
Mule 4.6 & Java 17 Upgrade | MuleSoft Mysore Meetup #46Mule 4.6 & Java 17 Upgrade | MuleSoft Mysore Meetup #46
Mule 4.6 & Java 17 Upgrade | MuleSoft Mysore Meetup #46
 
Home assignment II on Spectroscopy 2024 Answers.pdf
Home assignment II on Spectroscopy 2024 Answers.pdfHome assignment II on Spectroscopy 2024 Answers.pdf
Home assignment II on Spectroscopy 2024 Answers.pdf
 
Cambridge International AS A Level Biology Coursebook - EBook (MaryFosbery J...
Cambridge International AS  A Level Biology Coursebook - EBook (MaryFosbery J...Cambridge International AS  A Level Biology Coursebook - EBook (MaryFosbery J...
Cambridge International AS A Level Biology Coursebook - EBook (MaryFosbery J...
 
Chapter 3 - Islamic Banking Products and Services.pptx
Chapter 3 - Islamic Banking Products and Services.pptxChapter 3 - Islamic Banking Products and Services.pptx
Chapter 3 - Islamic Banking Products and Services.pptx
 
Sectors of the Indian Economy - Class 10 Study Notes pdf
Sectors of the Indian Economy - Class 10 Study Notes pdfSectors of the Indian Economy - Class 10 Study Notes pdf
Sectors of the Indian Economy - Class 10 Study Notes pdf
 
Additional Benefits for Employee Website.pdf
Additional Benefits for Employee Website.pdfAdditional Benefits for Employee Website.pdf
Additional Benefits for Employee Website.pdf
 
Polish students' mobility in the Czech Republic
Polish students' mobility in the Czech RepublicPolish students' mobility in the Czech Republic
Polish students' mobility in the Czech Republic
 
Palestine last event orientationfvgnh .pptx
Palestine last event orientationfvgnh .pptxPalestine last event orientationfvgnh .pptx
Palestine last event orientationfvgnh .pptx
 
How to Break the cycle of negative Thoughts
How to Break the cycle of negative ThoughtsHow to Break the cycle of negative Thoughts
How to Break the cycle of negative Thoughts
 

Pearson's correlation coefficient 

  • 2. Submitted by: Group B Name Roll Batch Md. Topu Kawser 28 58thB Azizul Haque Bhuiyan 07 58thB Md Maidul Islam Chowdhury 06 58thB Kaptusha akter monisha 26 59thB Ramnunsang bawm 37 58thB Department of Business Administration Dhaka International University.
  • 3. Meaning Of Correlation The method of correlation is developed by Francis Galton in 1885. It is the relationship between two sets of scores or variables.
  • 4. Definition Of Correlation Whenever two variables of the same group are so related that the increase or decrease are correspond to the increase or decrease to another or conversely , increase or decrease corresponds to the decrease or increase to another ,they are said to be correlated.
  • 5. Coefficient Of Correlation • The ratio indicating the degree of relationship between two related variables. • For a perfect POSITIVE CORRELATION the coefficient of correlation is +1. • For a perfect NEGATIVE CORRELATION the coefficient of correlation is -1. • Positive coefficient of correlation varies from 0 to +1. • Negative coefficient of correlation varies from 0 to -1.
  • 6. Uses Of Correlation • IT HELPS TO DETERMINE THE VALIDITY OF A TEST. • IT HELPS TO DETERMINE THE RELIABILITY OF A TEST. • IT CAN BE USED TO ASCERTAIN THE DEGREE OF THE OBJECTIVITY OF A TEST. • IT CAN ANSWER THE VALIDITY OF ARGUMENTS FOR OR AGAINST A STATEMENT. • IT INDICATES THE NATURE OF THE RELATIONSHIP BETWEEN TWO VARIABLES. • IT PREDICTS THE VALUE OF ONE VARIABLE GIVEN THE VALUE OF ANOTHER RELATED VARIABLE. • IT HELPS TO ASCERTAIN THE TRAITS AND CAPACITIES OF PUPILS.
  • 7. Types Of Correlation On the basis of direction of the relation between variables, there are three types of correlation. That are POSITIVE CORRELATION NEGATIVE CORRELATION ZERO CORRELATION
  • 8. POSITIVE CORRELATION NEGATIVE CORRELATION If when the first variable increases or decreases the other also increases or decreases respectively their relationship is said to be Positive correlation , because they move in the same direction. Example . Intelligence and Achievement. If when the first variable increases or decreases , the other respectively decreases or increases their relationship is said to be Negative correlation , because they move in the opposite direction. Example . Anxiety and Performance.
  • 9. ZERO CORRELATION If there exists no relationship between two sets of measures or variables. Example . Intelligence and Height.
  • 10. Computation Of Coefficient Of Correlation There are two different methods of computing coefficient of correlation . they are , • Rank difference method • PRODUCT MOMENT METHOD or pearson's correlation coefficient .
  • 11. Most widely used measure of correlation. § This method is also known as Pearson’s product moment method in honour of Karl Pearson , who is said to be the inventor of this method. § The coefficient of correlation computed by this method is known as the product moment coefficient of correlation or Pearson’s correlation coefficient. § It is represented as ‘r’ . Pearson's correlation coefficient (r) is a measure of the linear association of two variables. Correlation analysis usually starts with a graphical representation of the relation of data pairs using a scatter diagram. The values of correlation coefficient vary from –1 to +1.
  • 12. The standard formula used in the computation of Pearson’s product moment correlation coefficient is as follows :
  • 13. Where, • N - the number: of pairs of data • Ʃ - the summation of the items indicated • ƩX - the sum of all X scores • ƩX² - each X score should be squared and then those squares summed {the sum of the X squared scores} • (ƩX)² - X scores should be summed and the total squared(the squares of the sum of all the X scores) • ƩY – the sum of all Y scores • ƩY² - each Y score should be squared and then those squares summed • (ƩY)² - Y score should be summed and the total squared
  • 14. Calculate the correlation of the following data INDIVIDUALS SCOREIN TEST X SCORES IN TEST Y A 15 60 B 25 70 C 20 40 D 30 50 E 35 30
  • 15. INDIVIDUAL SCORES I N TEST X SCORES I N TEST Y XY X² Y² A 15 60 B 25 70 C 20 40 D 30 50 E 35 30 N= ƩX= ƩY= ƩX Y= ƩX²= ƩY²=
  • 16. INDIVIDUAL SCORES INTEST X SCORES INTEST Y XY X² Y² A 15 60 900 225 3600 B 25 70 1750 625 4900 C 20 40 800 400 1600 D 30 50 1500 900 2500 E 35 30 1050 1225 900 N=5 ƩX=125 ƩY=250 ƩXY= 6000 ƩX²= 3375 ƩY²= 13500
  • 17.
  • 18.
  • 20. How to evaluate a correlation • The values of ‘r’ always fall between -1 and +1 and the value does not change if all values of either variable are converted to a different scale. • For eg. If the weights of the students were given in pounds instead of kilograms , the value of ‘r’ would not change.
  • 21. Advantages of pearson's correlation coefficient IT GIVES A PRECISE AND QUANTITATIVE FIGURE WHICH CAN BE INTERPRETED MEANINGFULLY. IT HELPS IN ESTABLISHING THE VALUE OF THE DEPENDENT VARIABLE FROM THE KNOWN VALUE OF INDEPENDENT VARIABLE.
  • 22. Limitations of pearson's correlation coefficient This method assumes that there is a linear relationship between the variables under study regardless of the fact whether it exists or not. Compared to other methods , the computation of correlation coefficient by this method is time consuming. The value of the coefficient is unduly affected by extreme items.