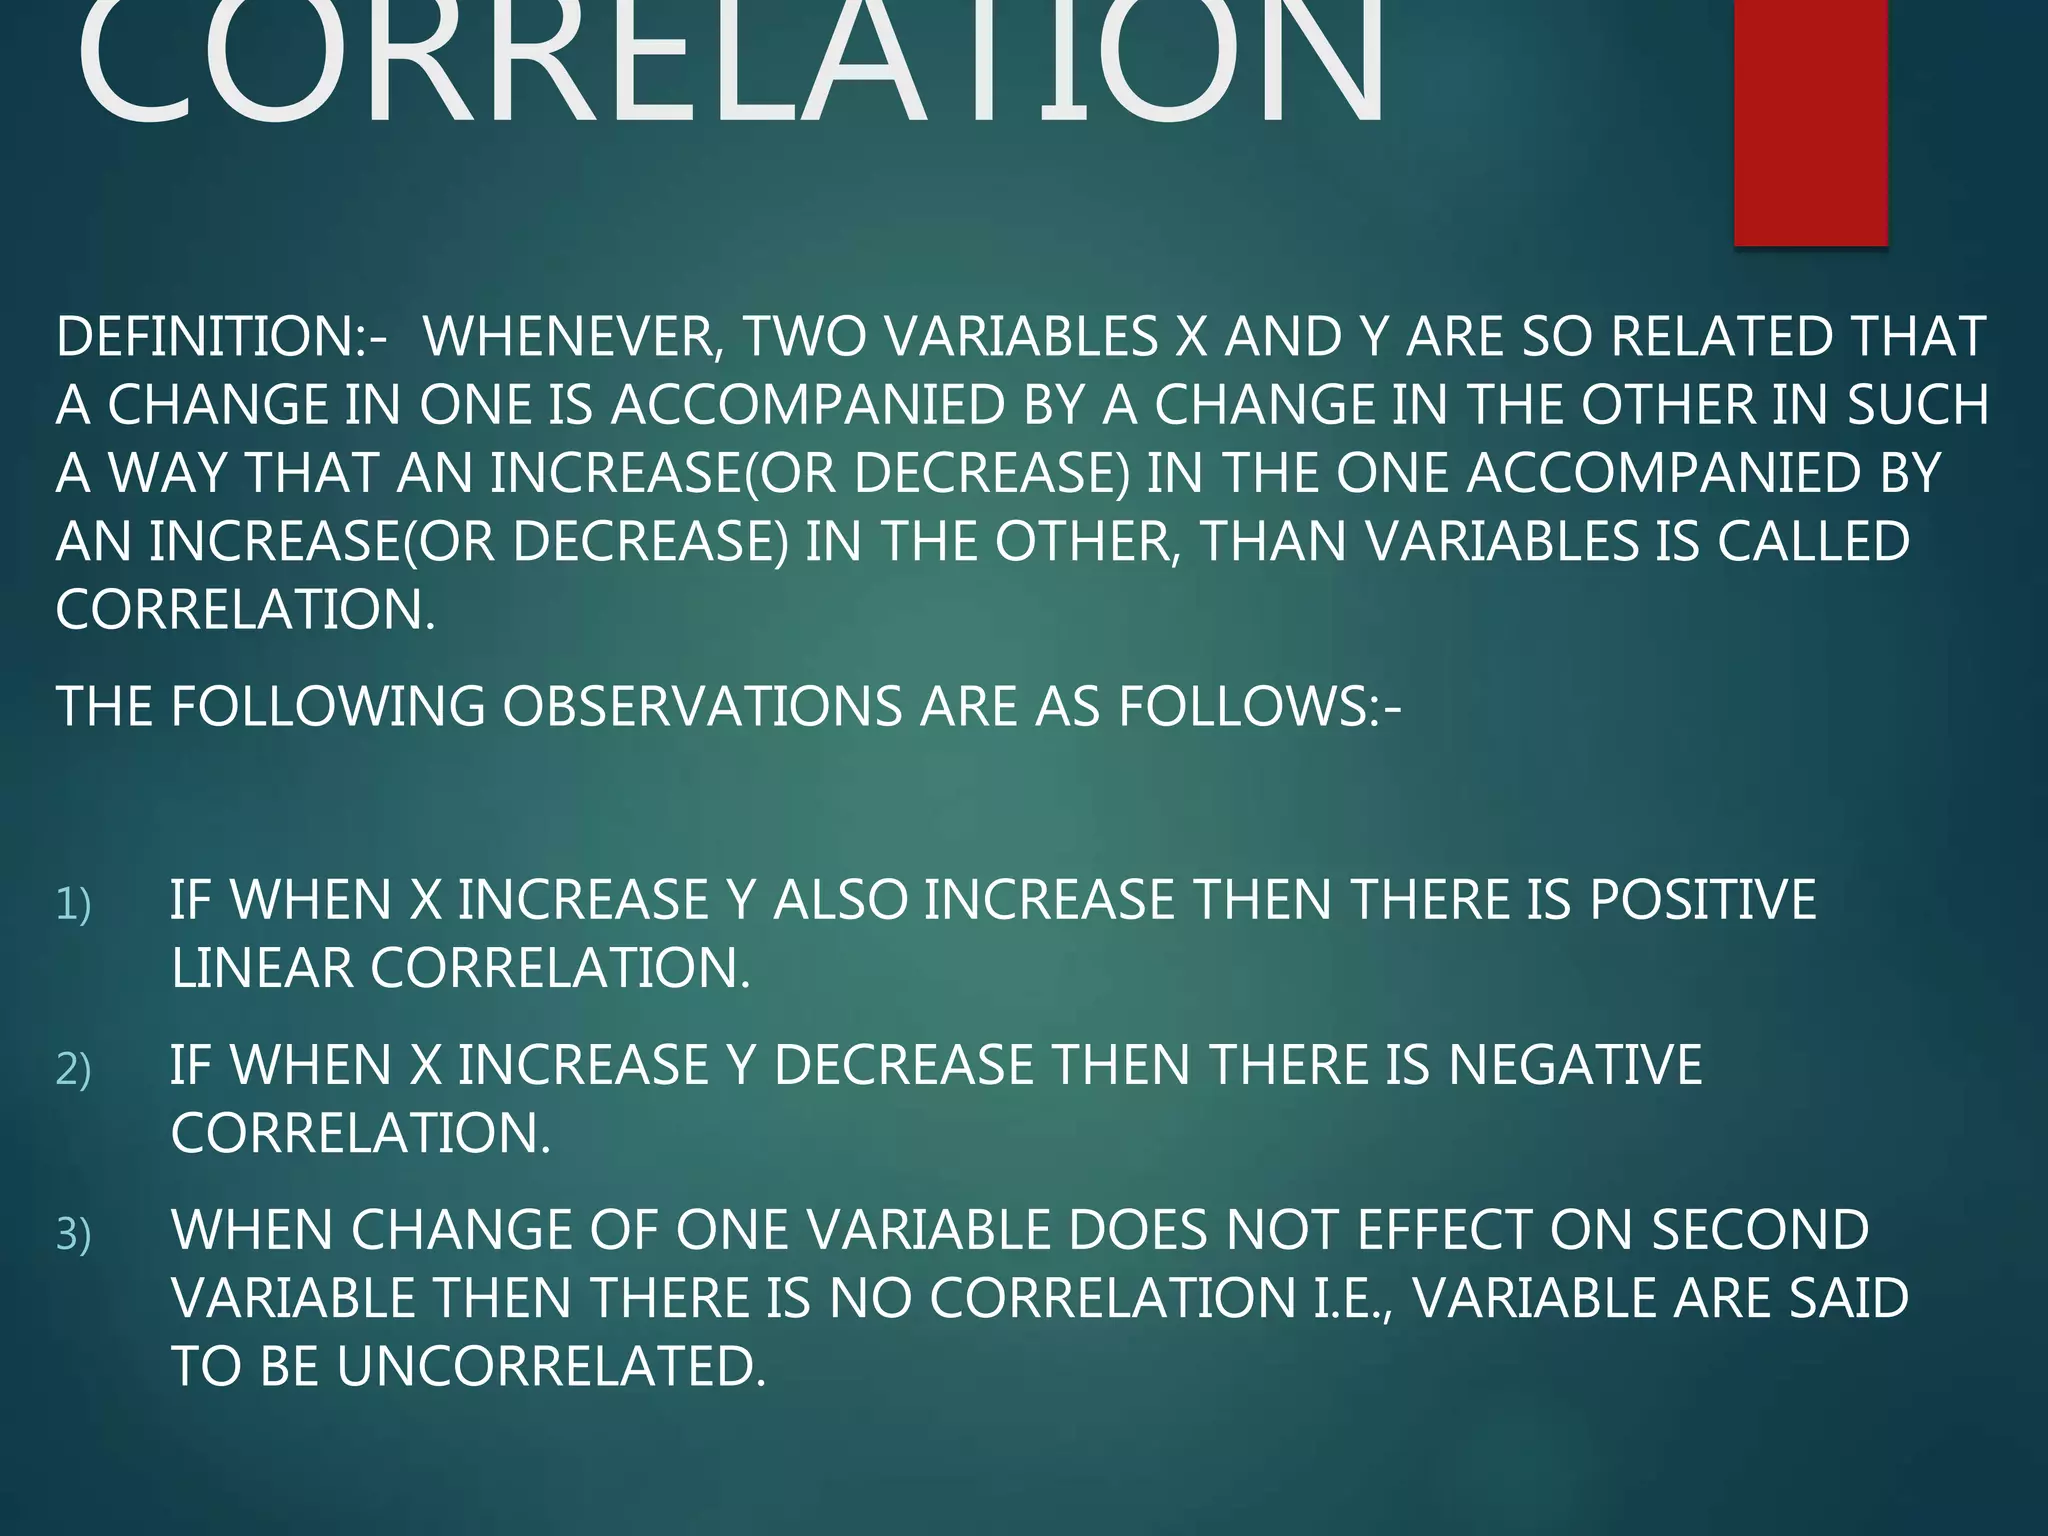
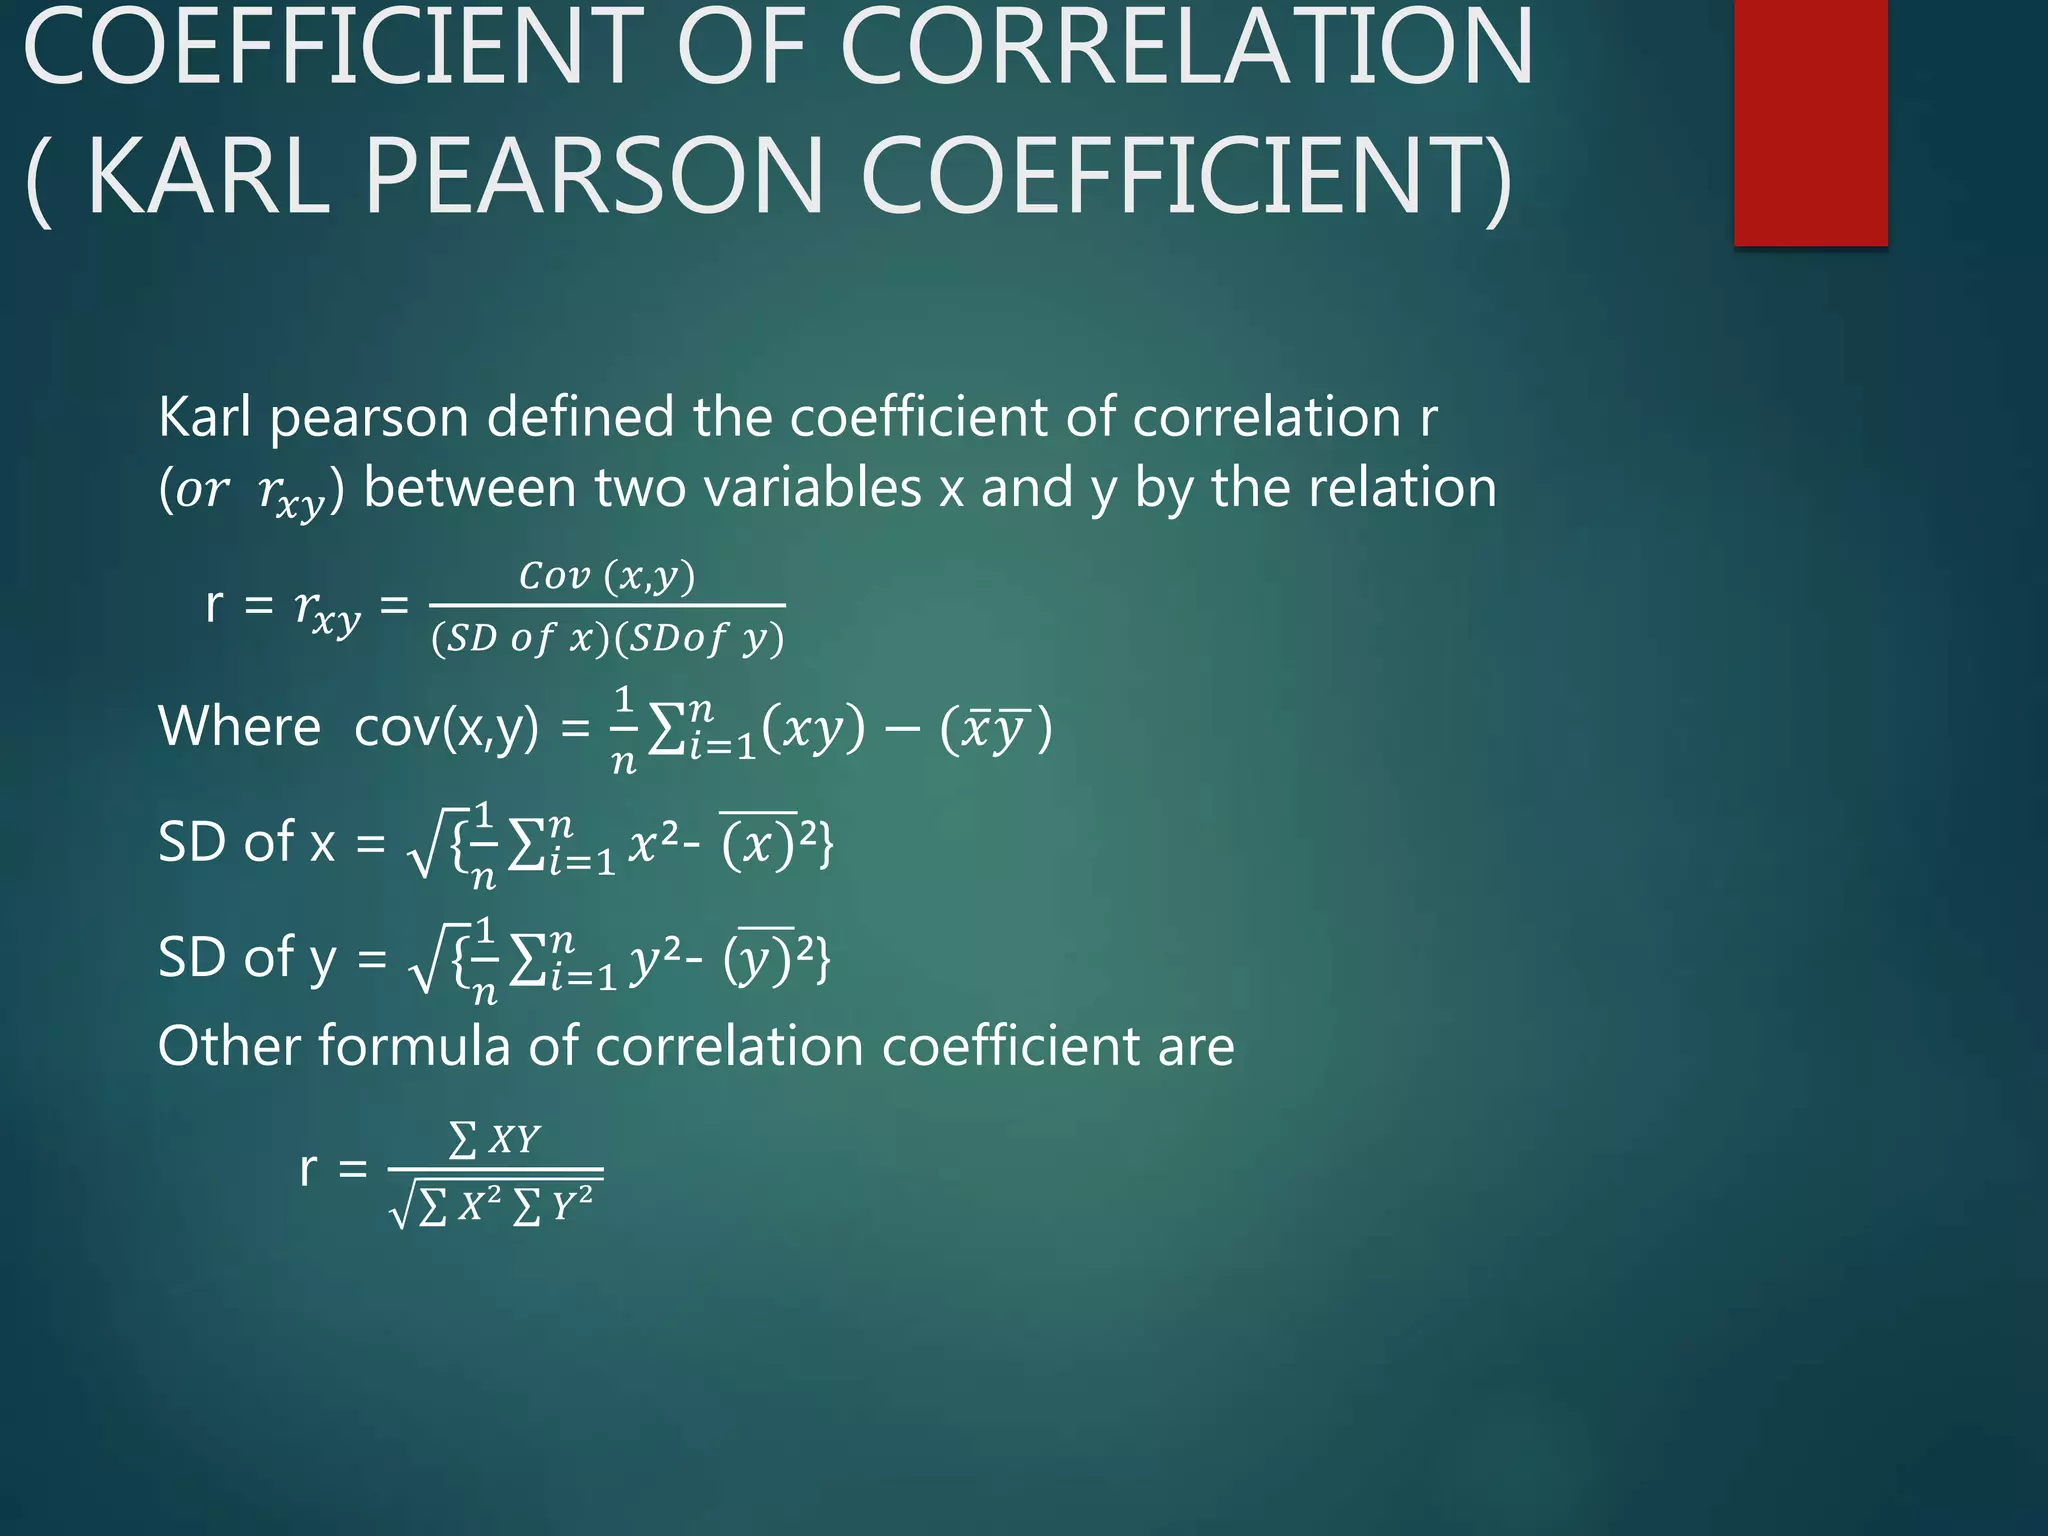
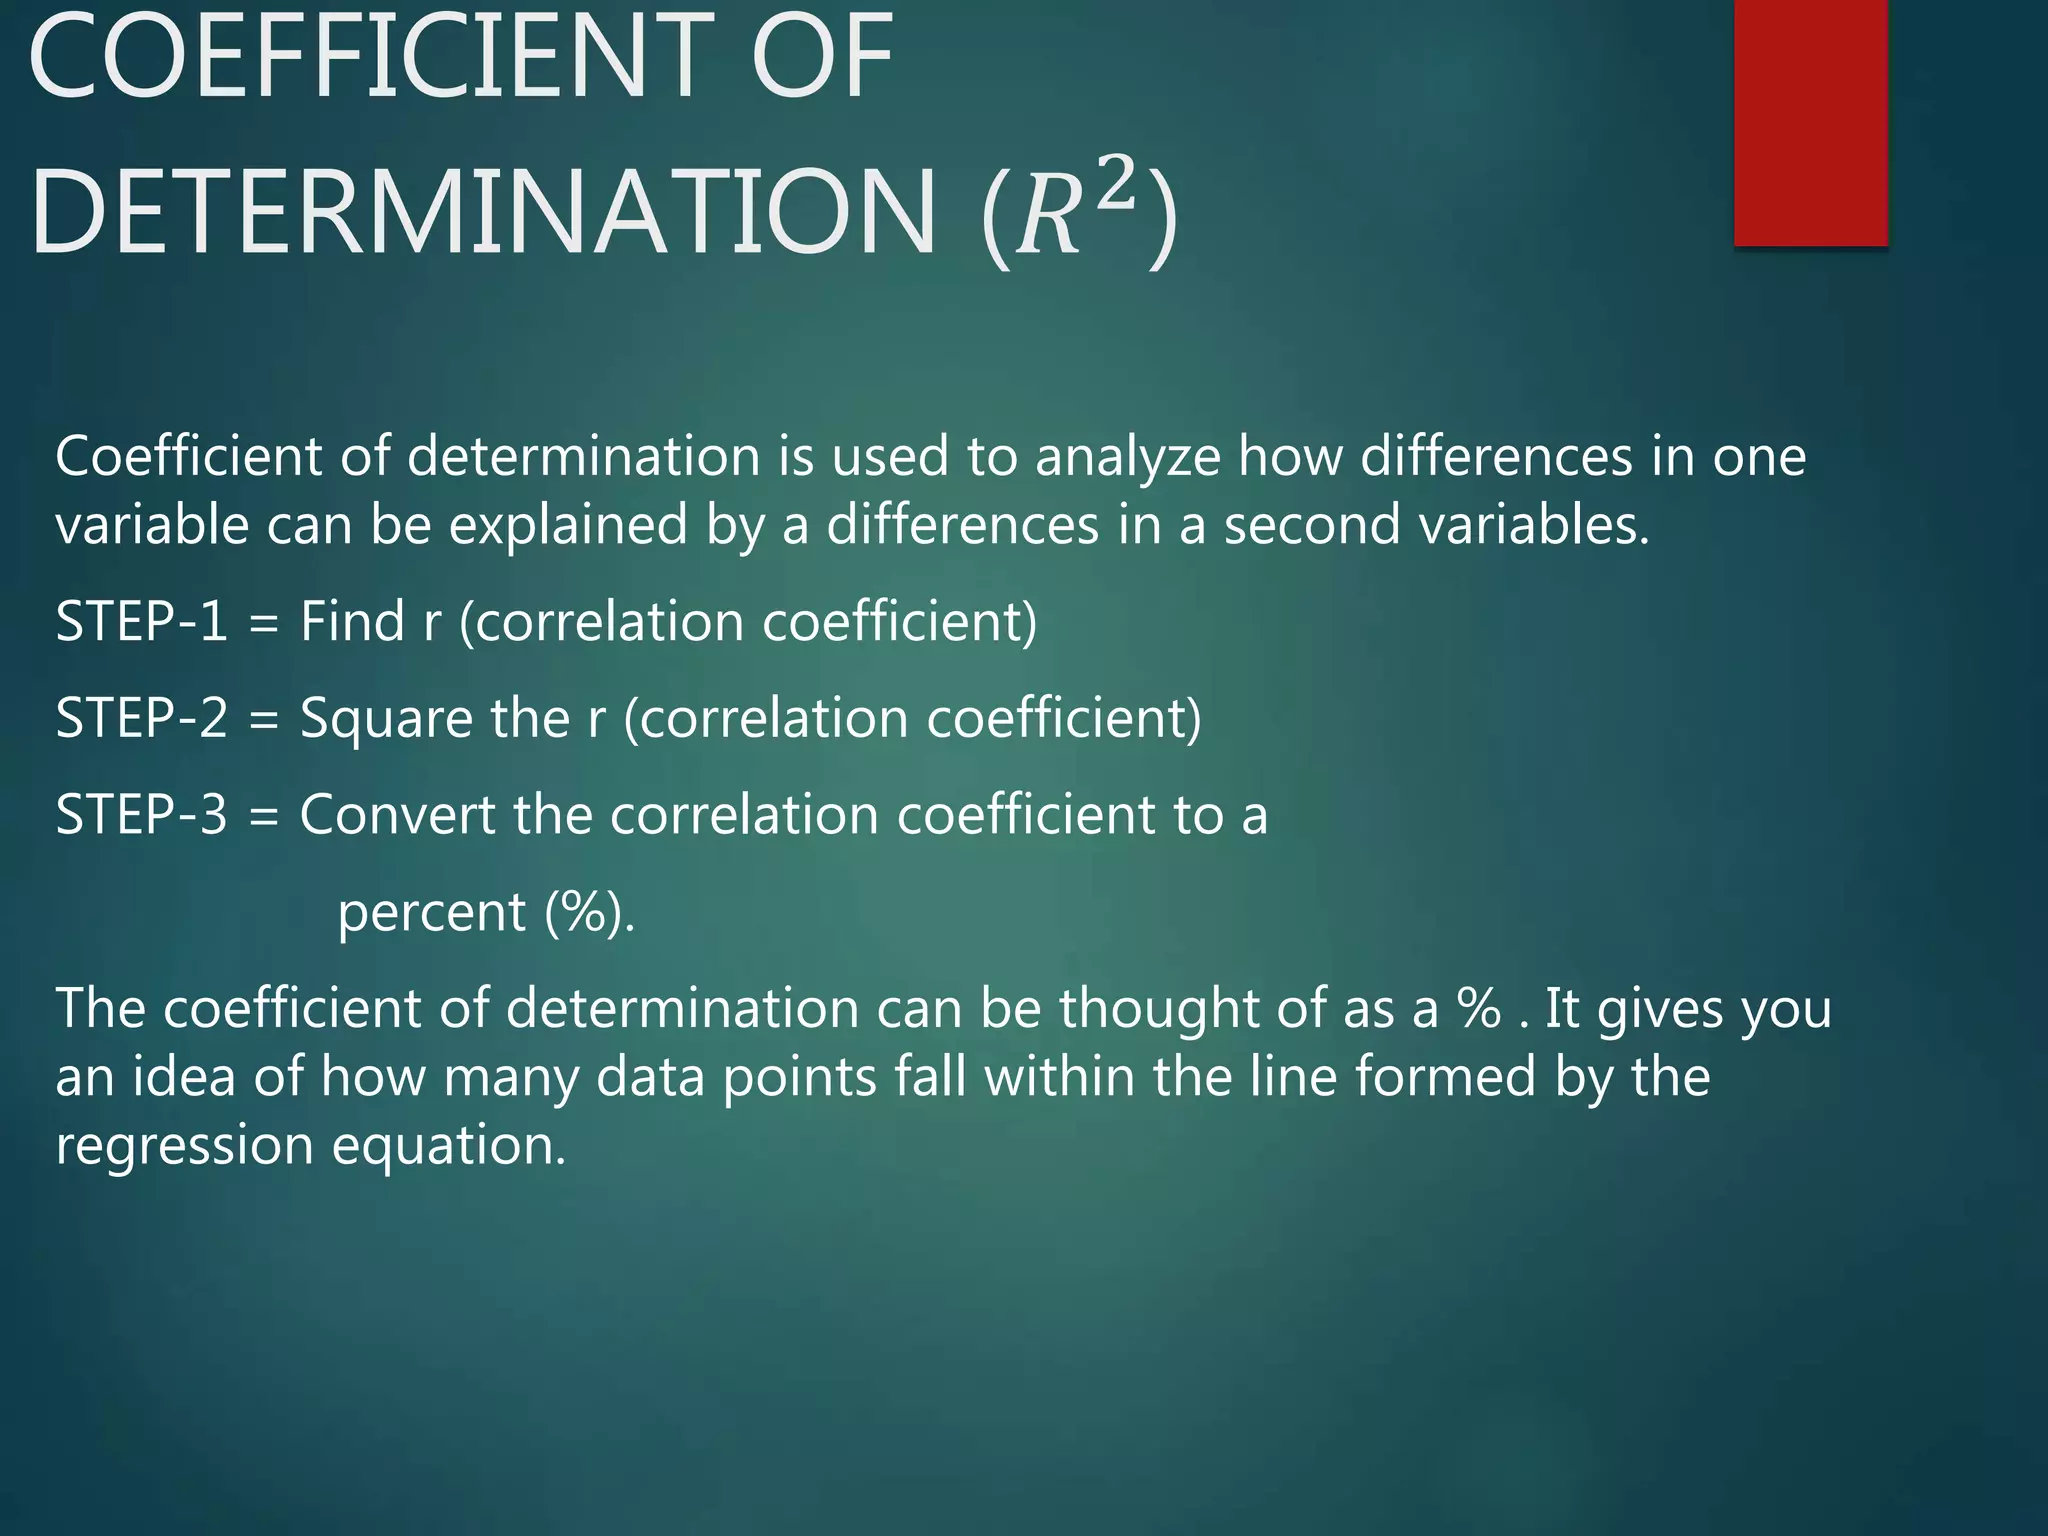
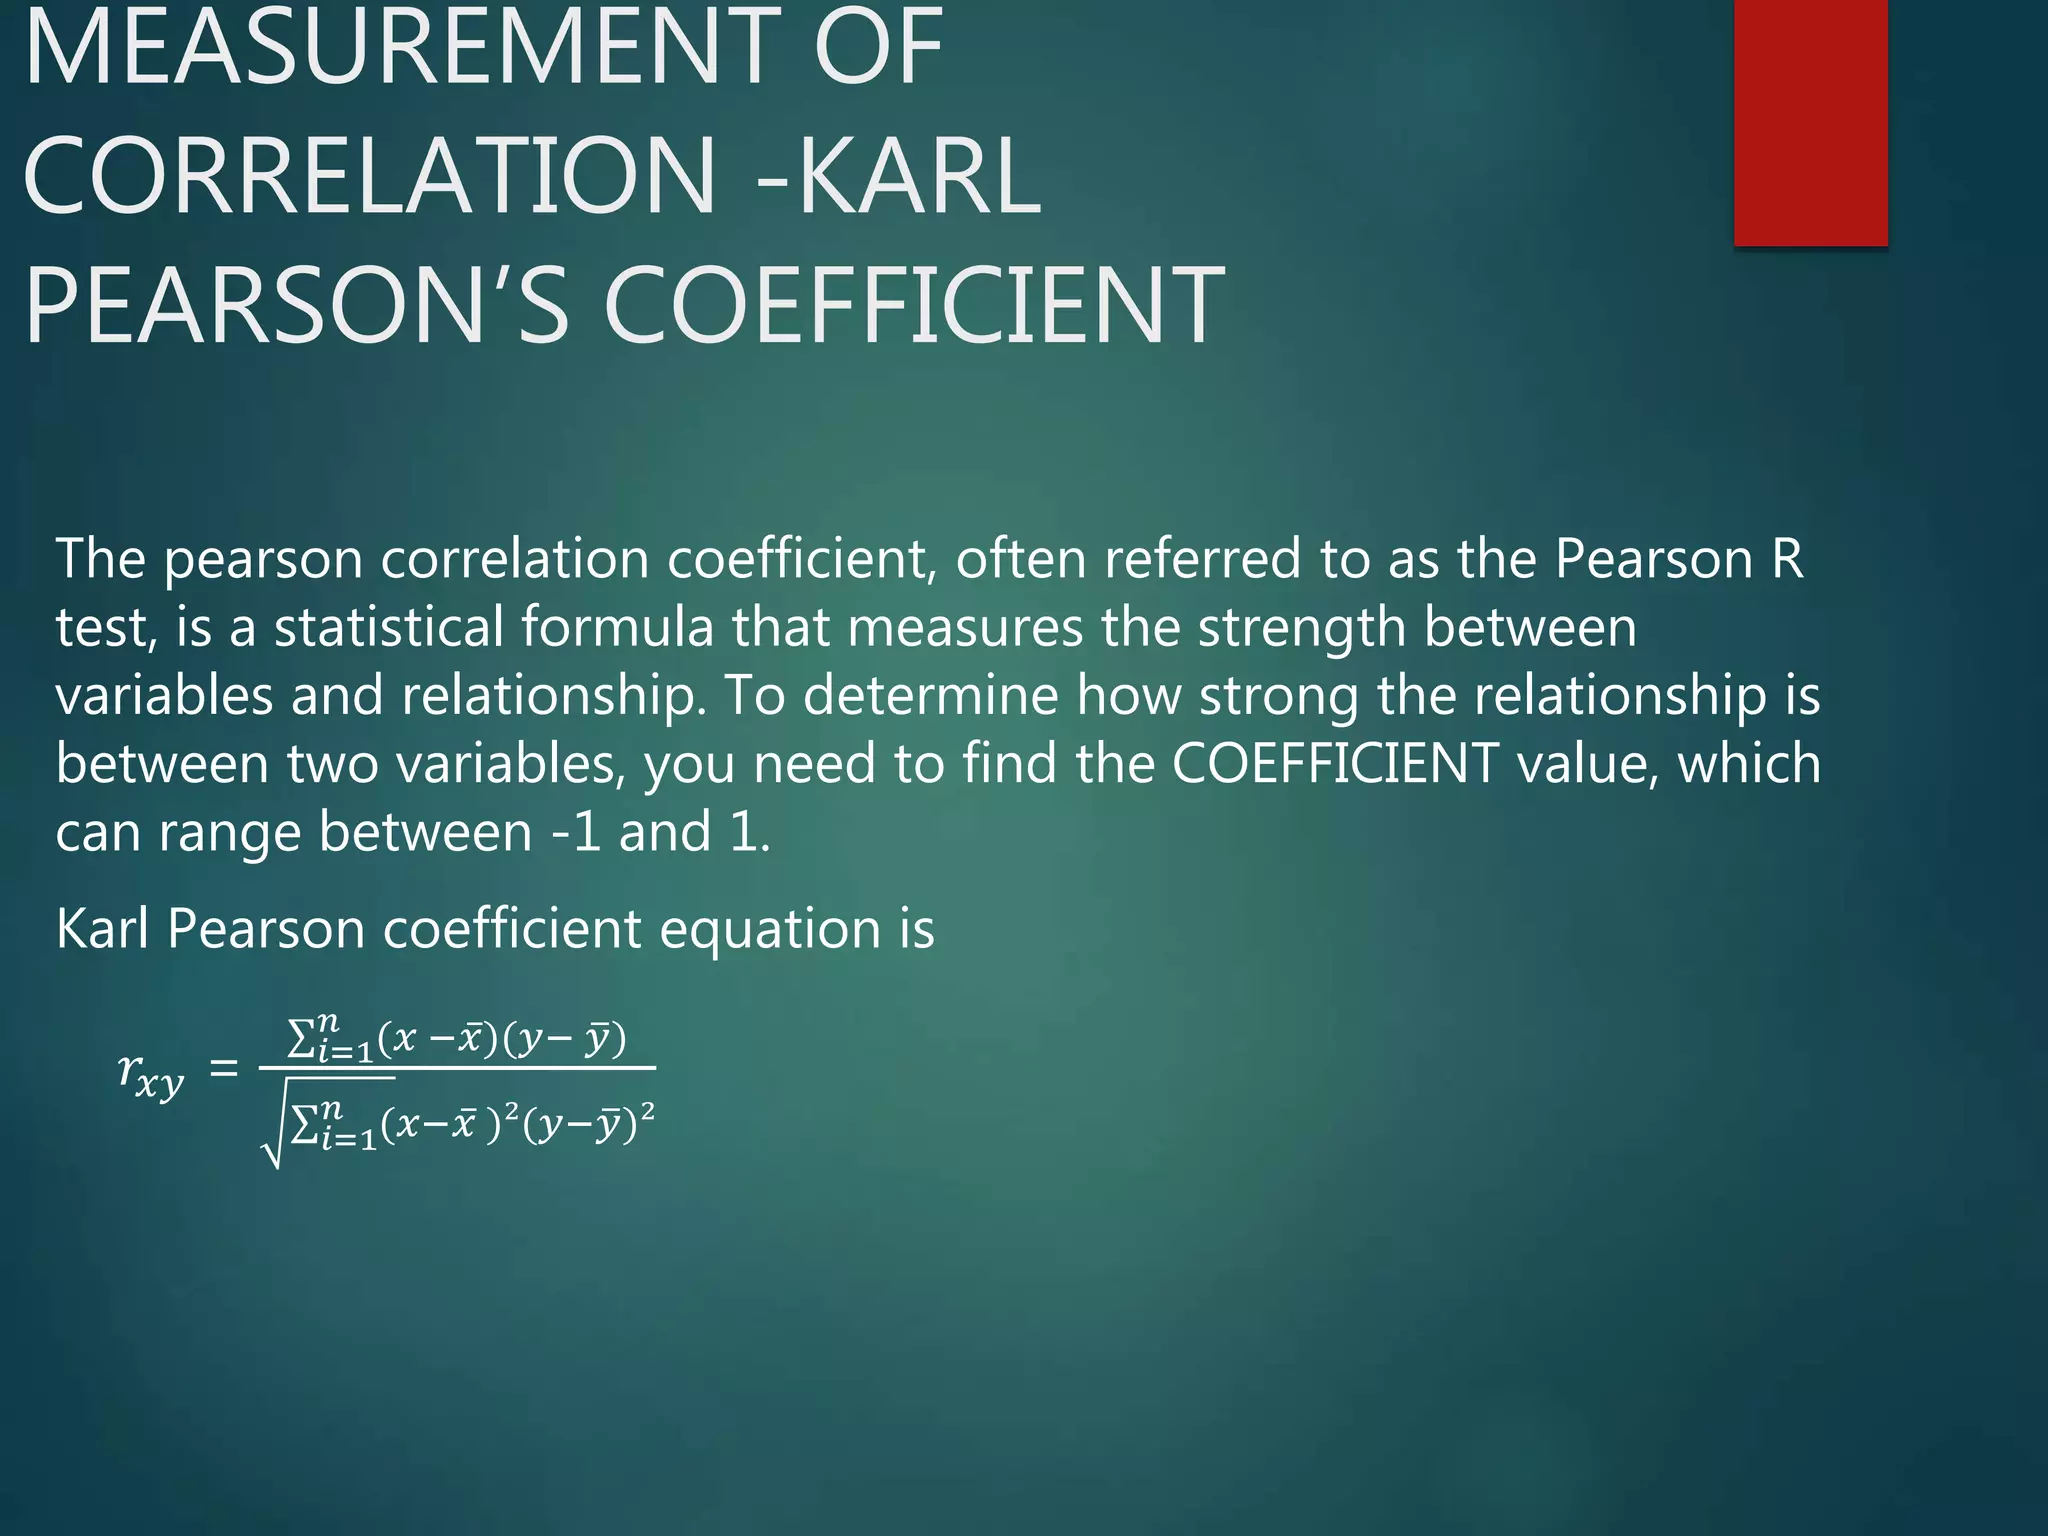
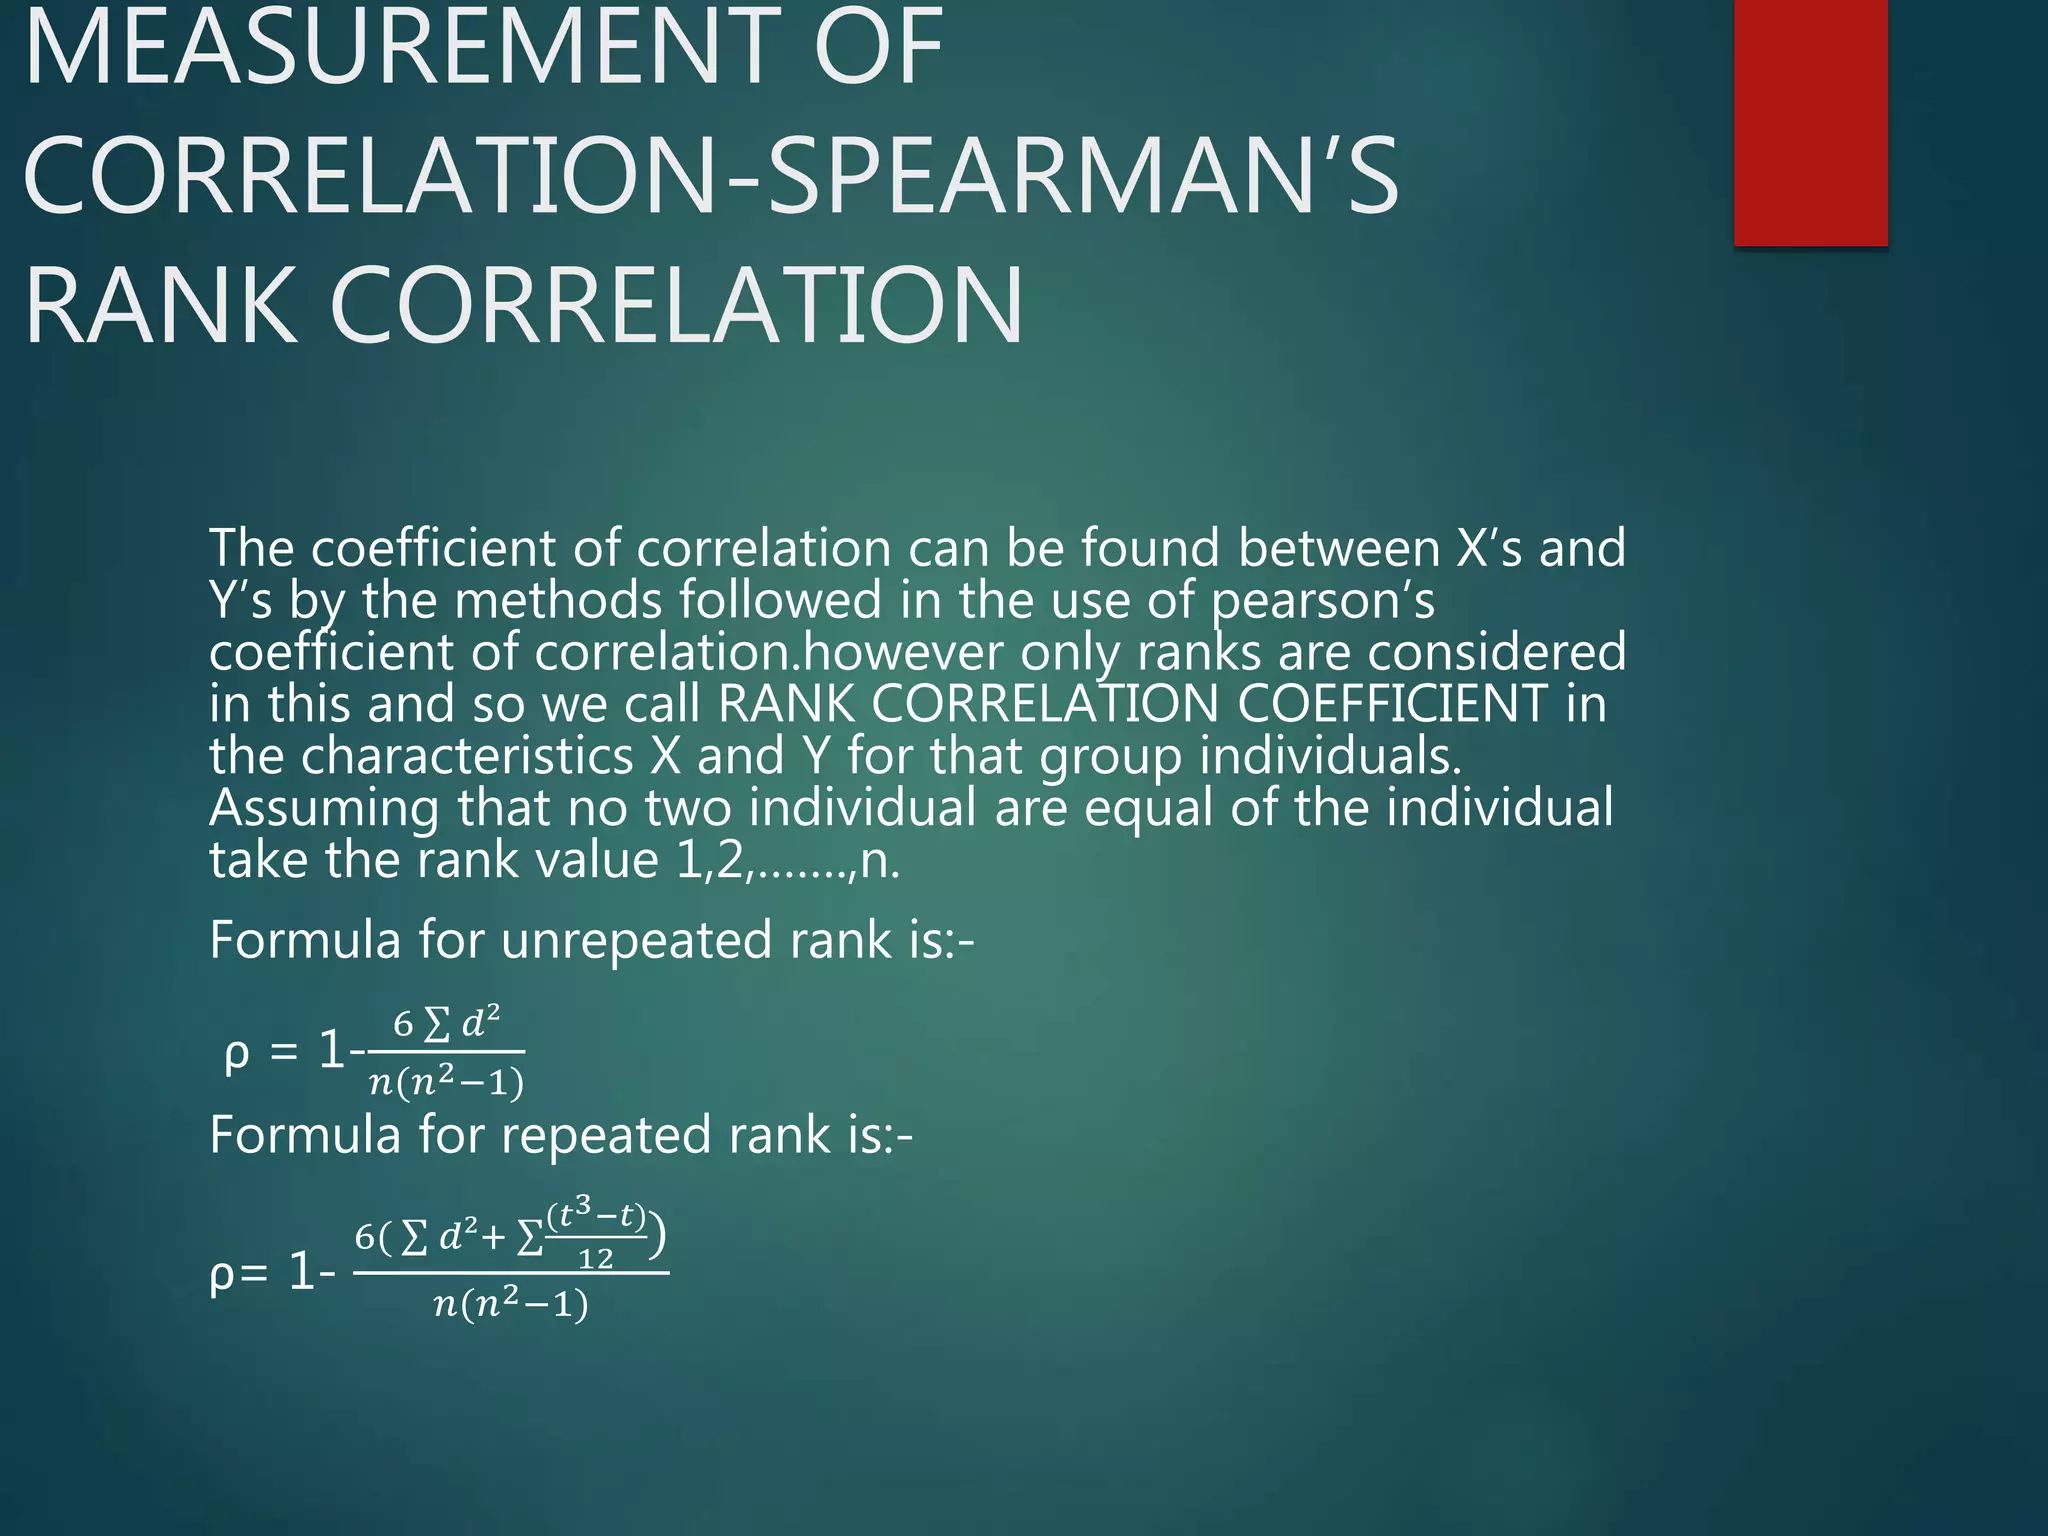
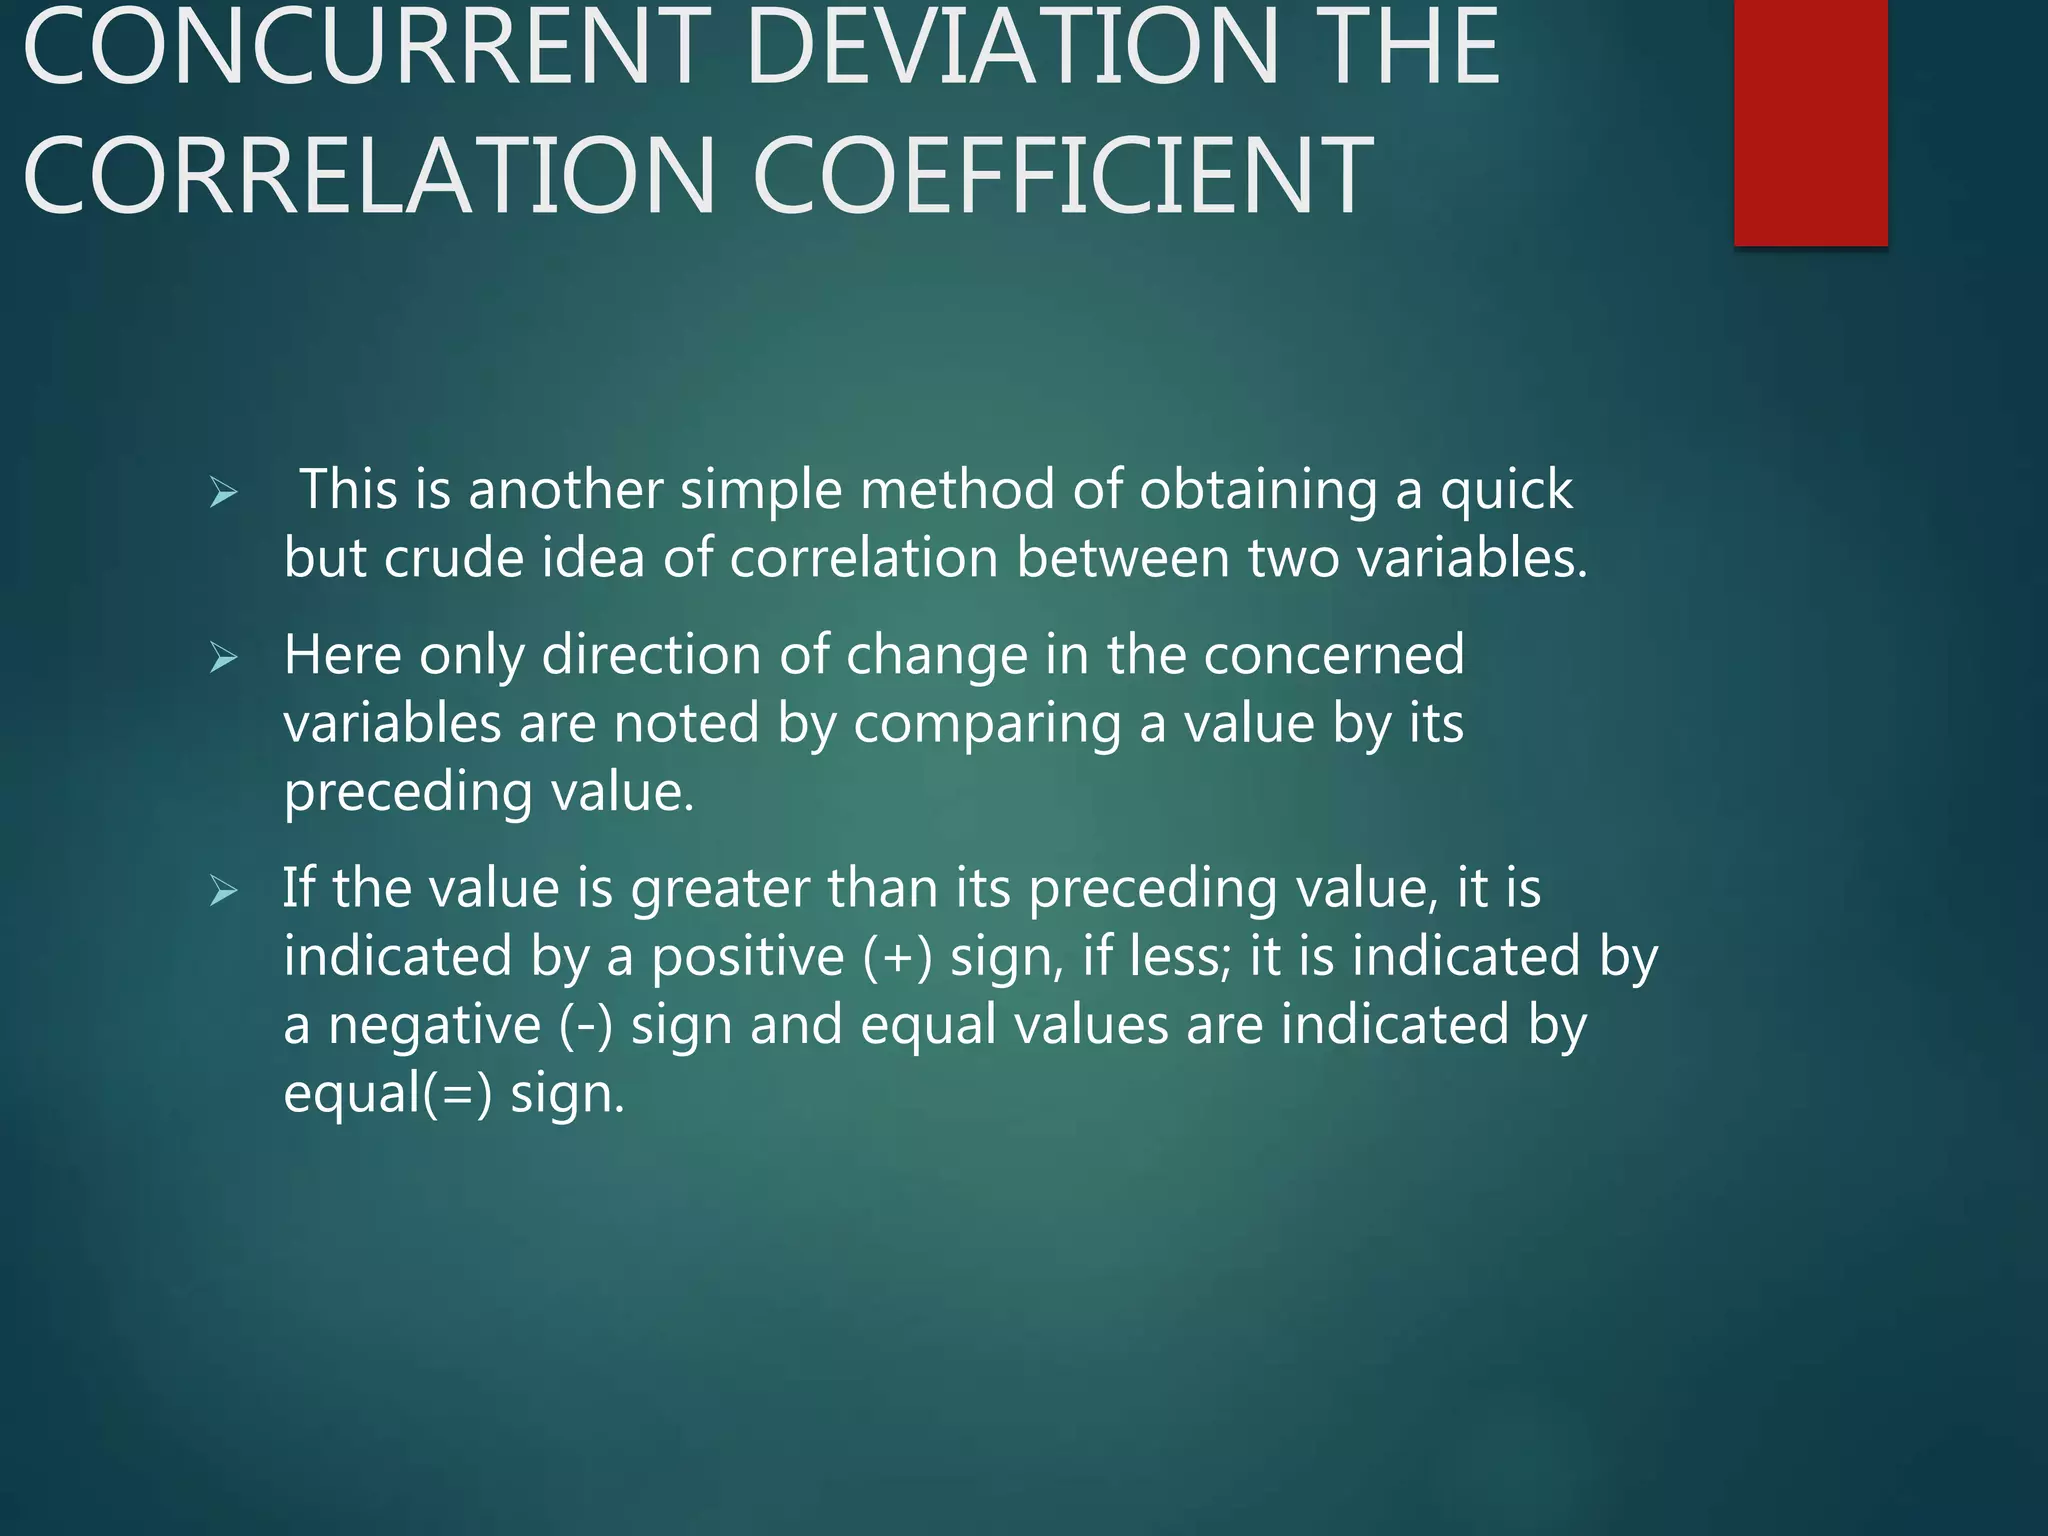
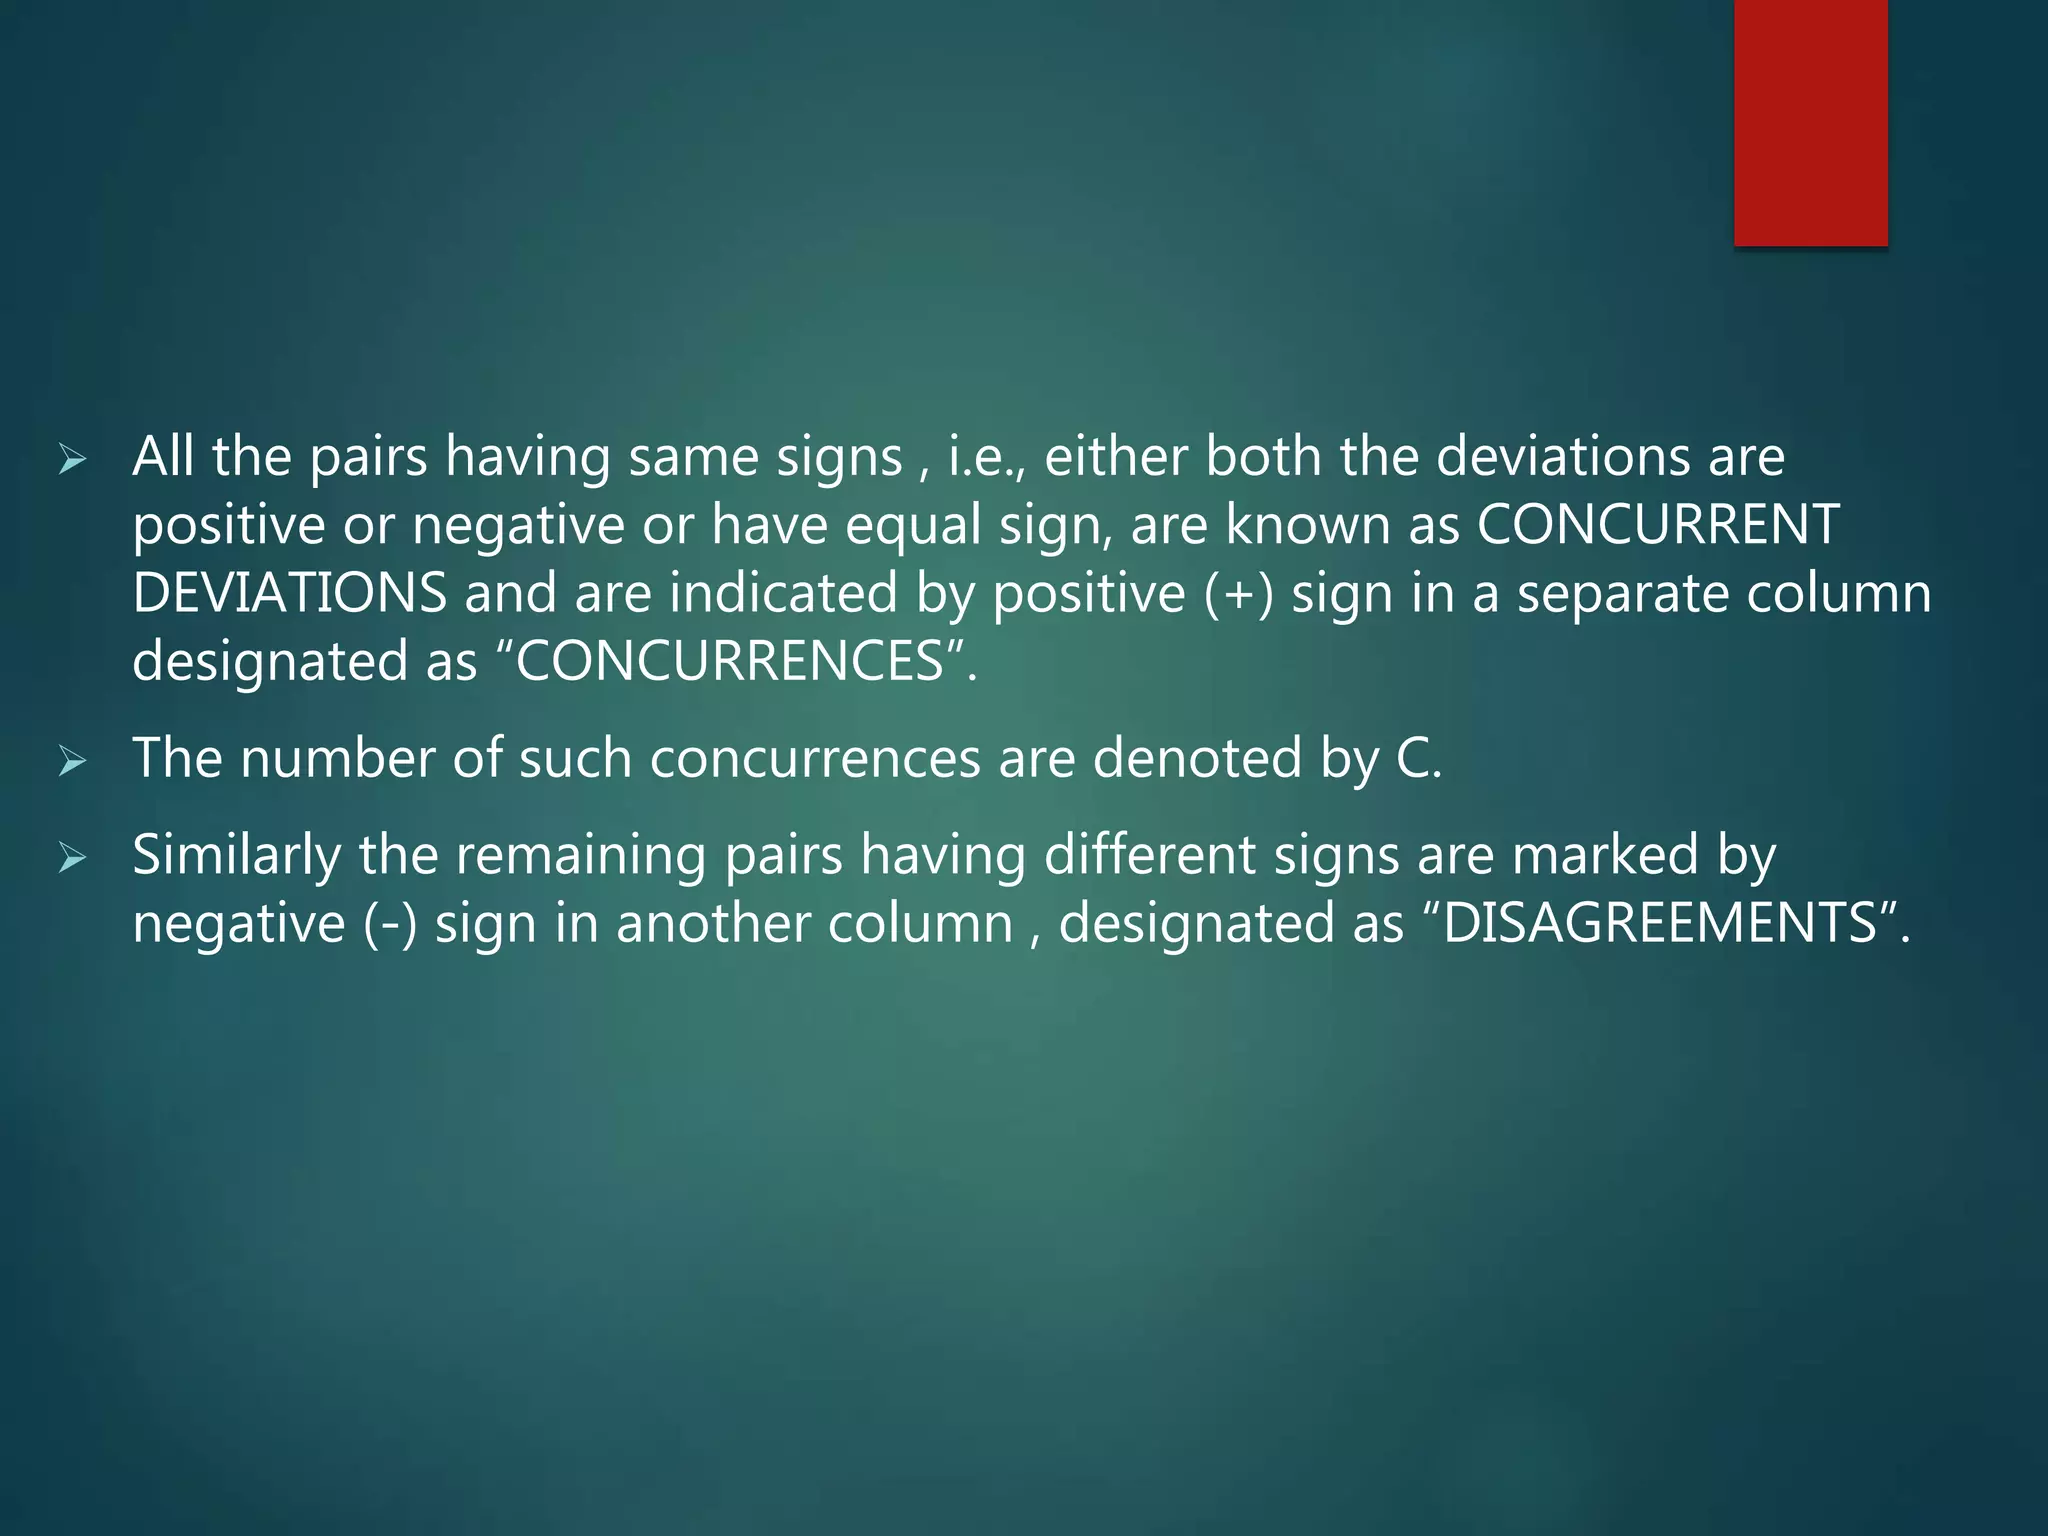
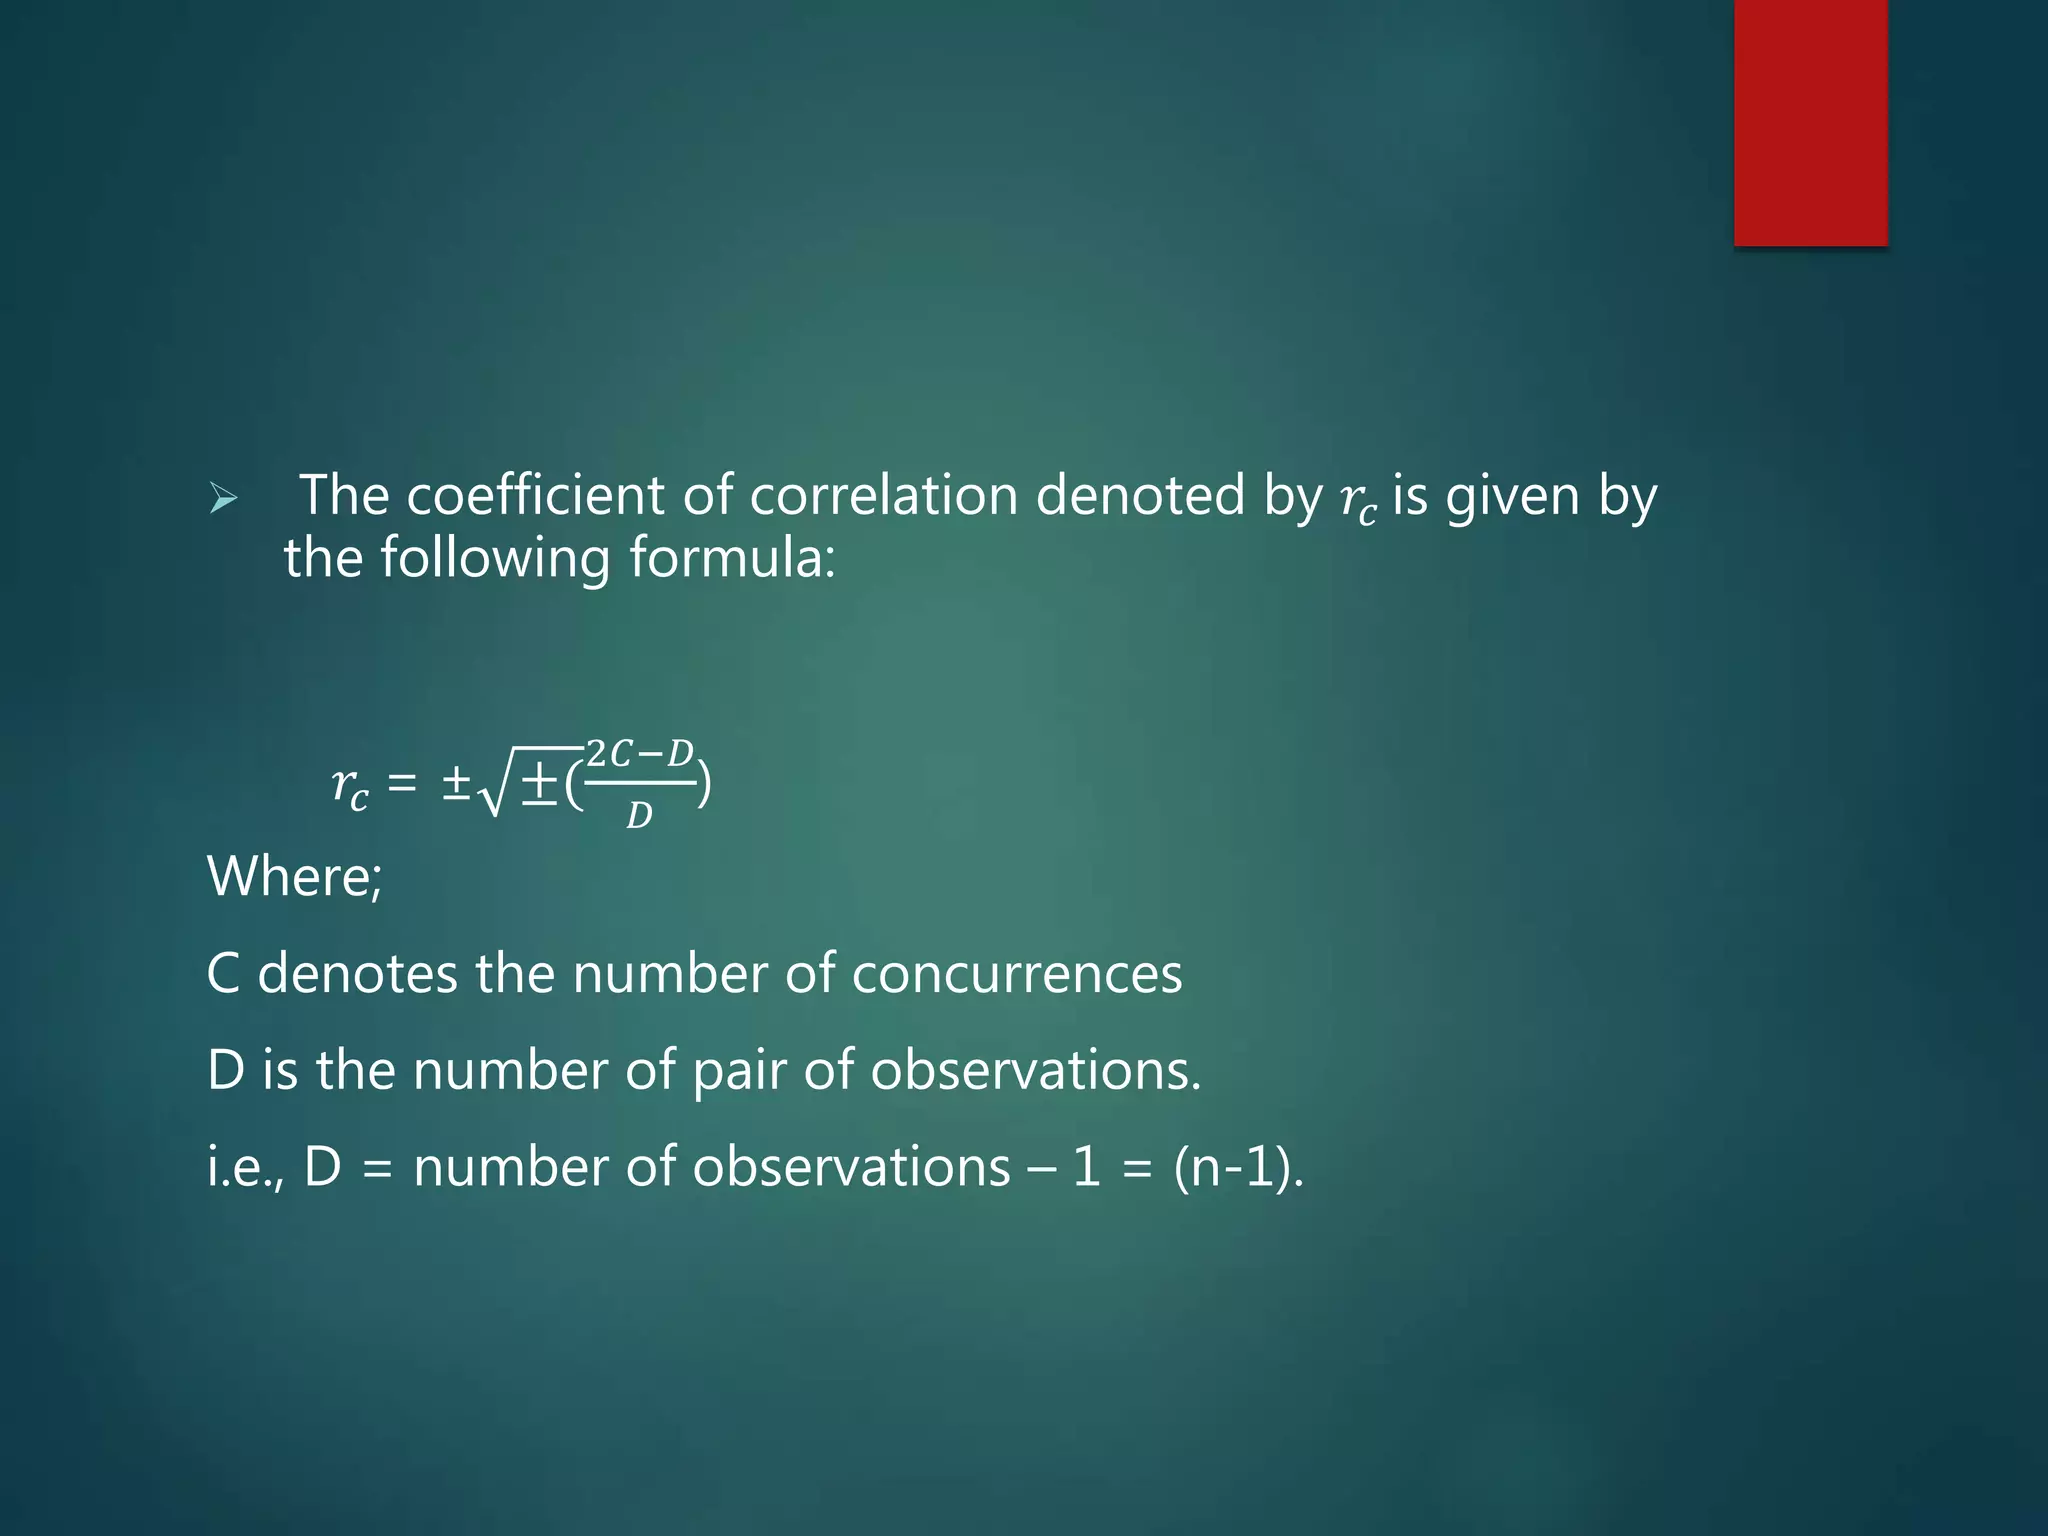
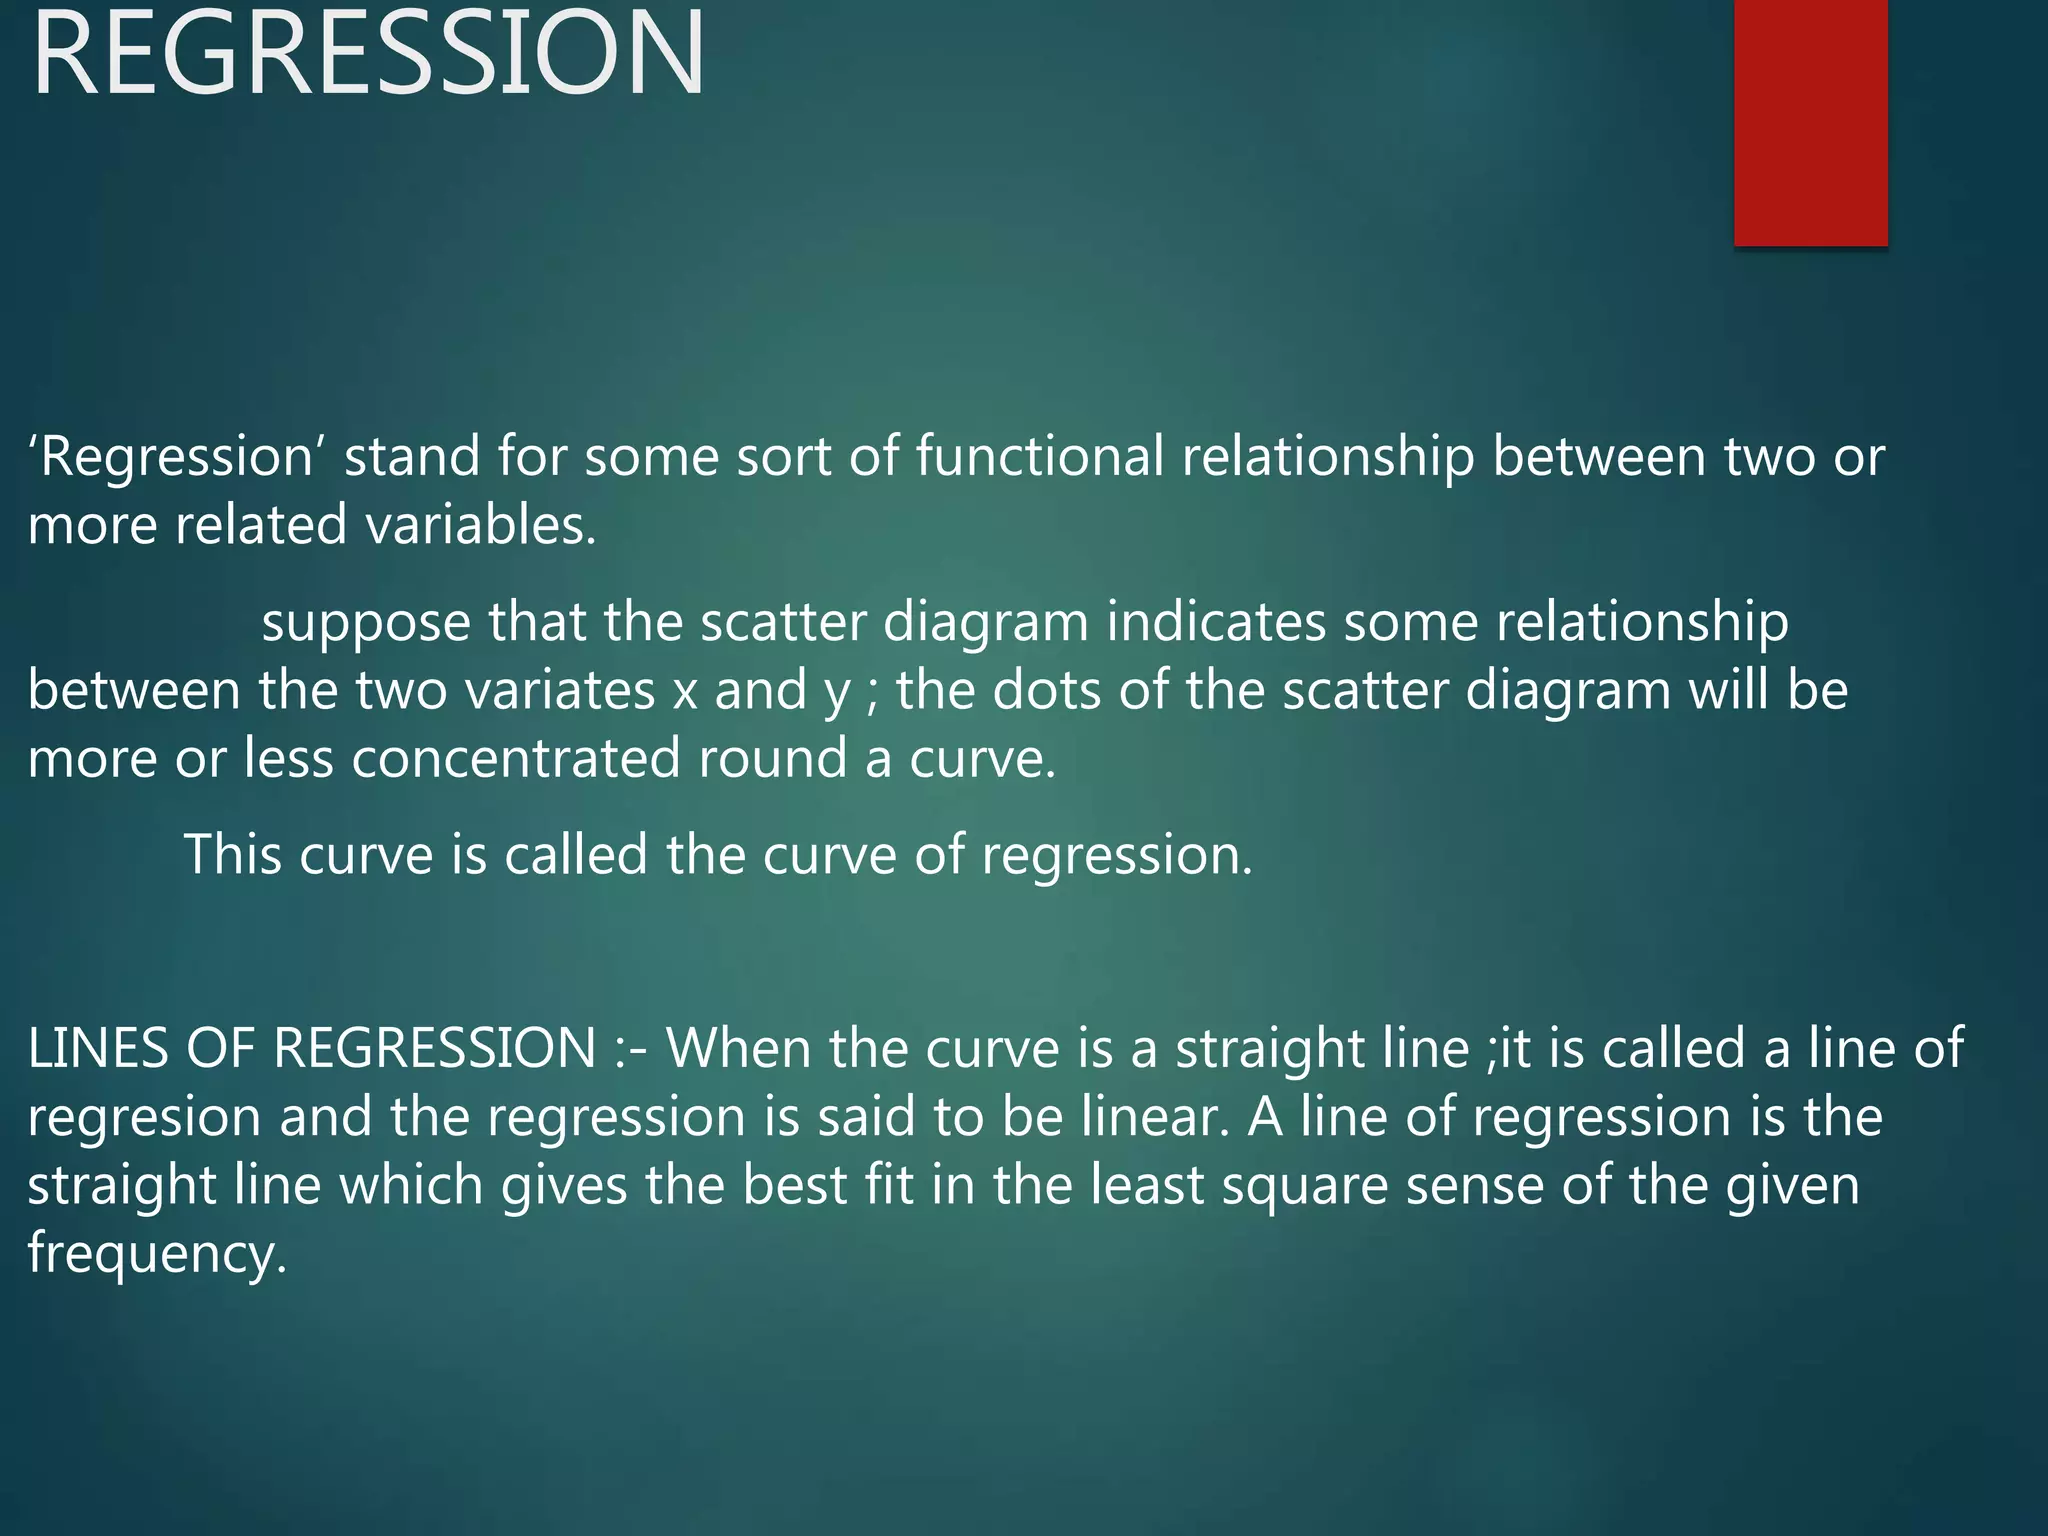
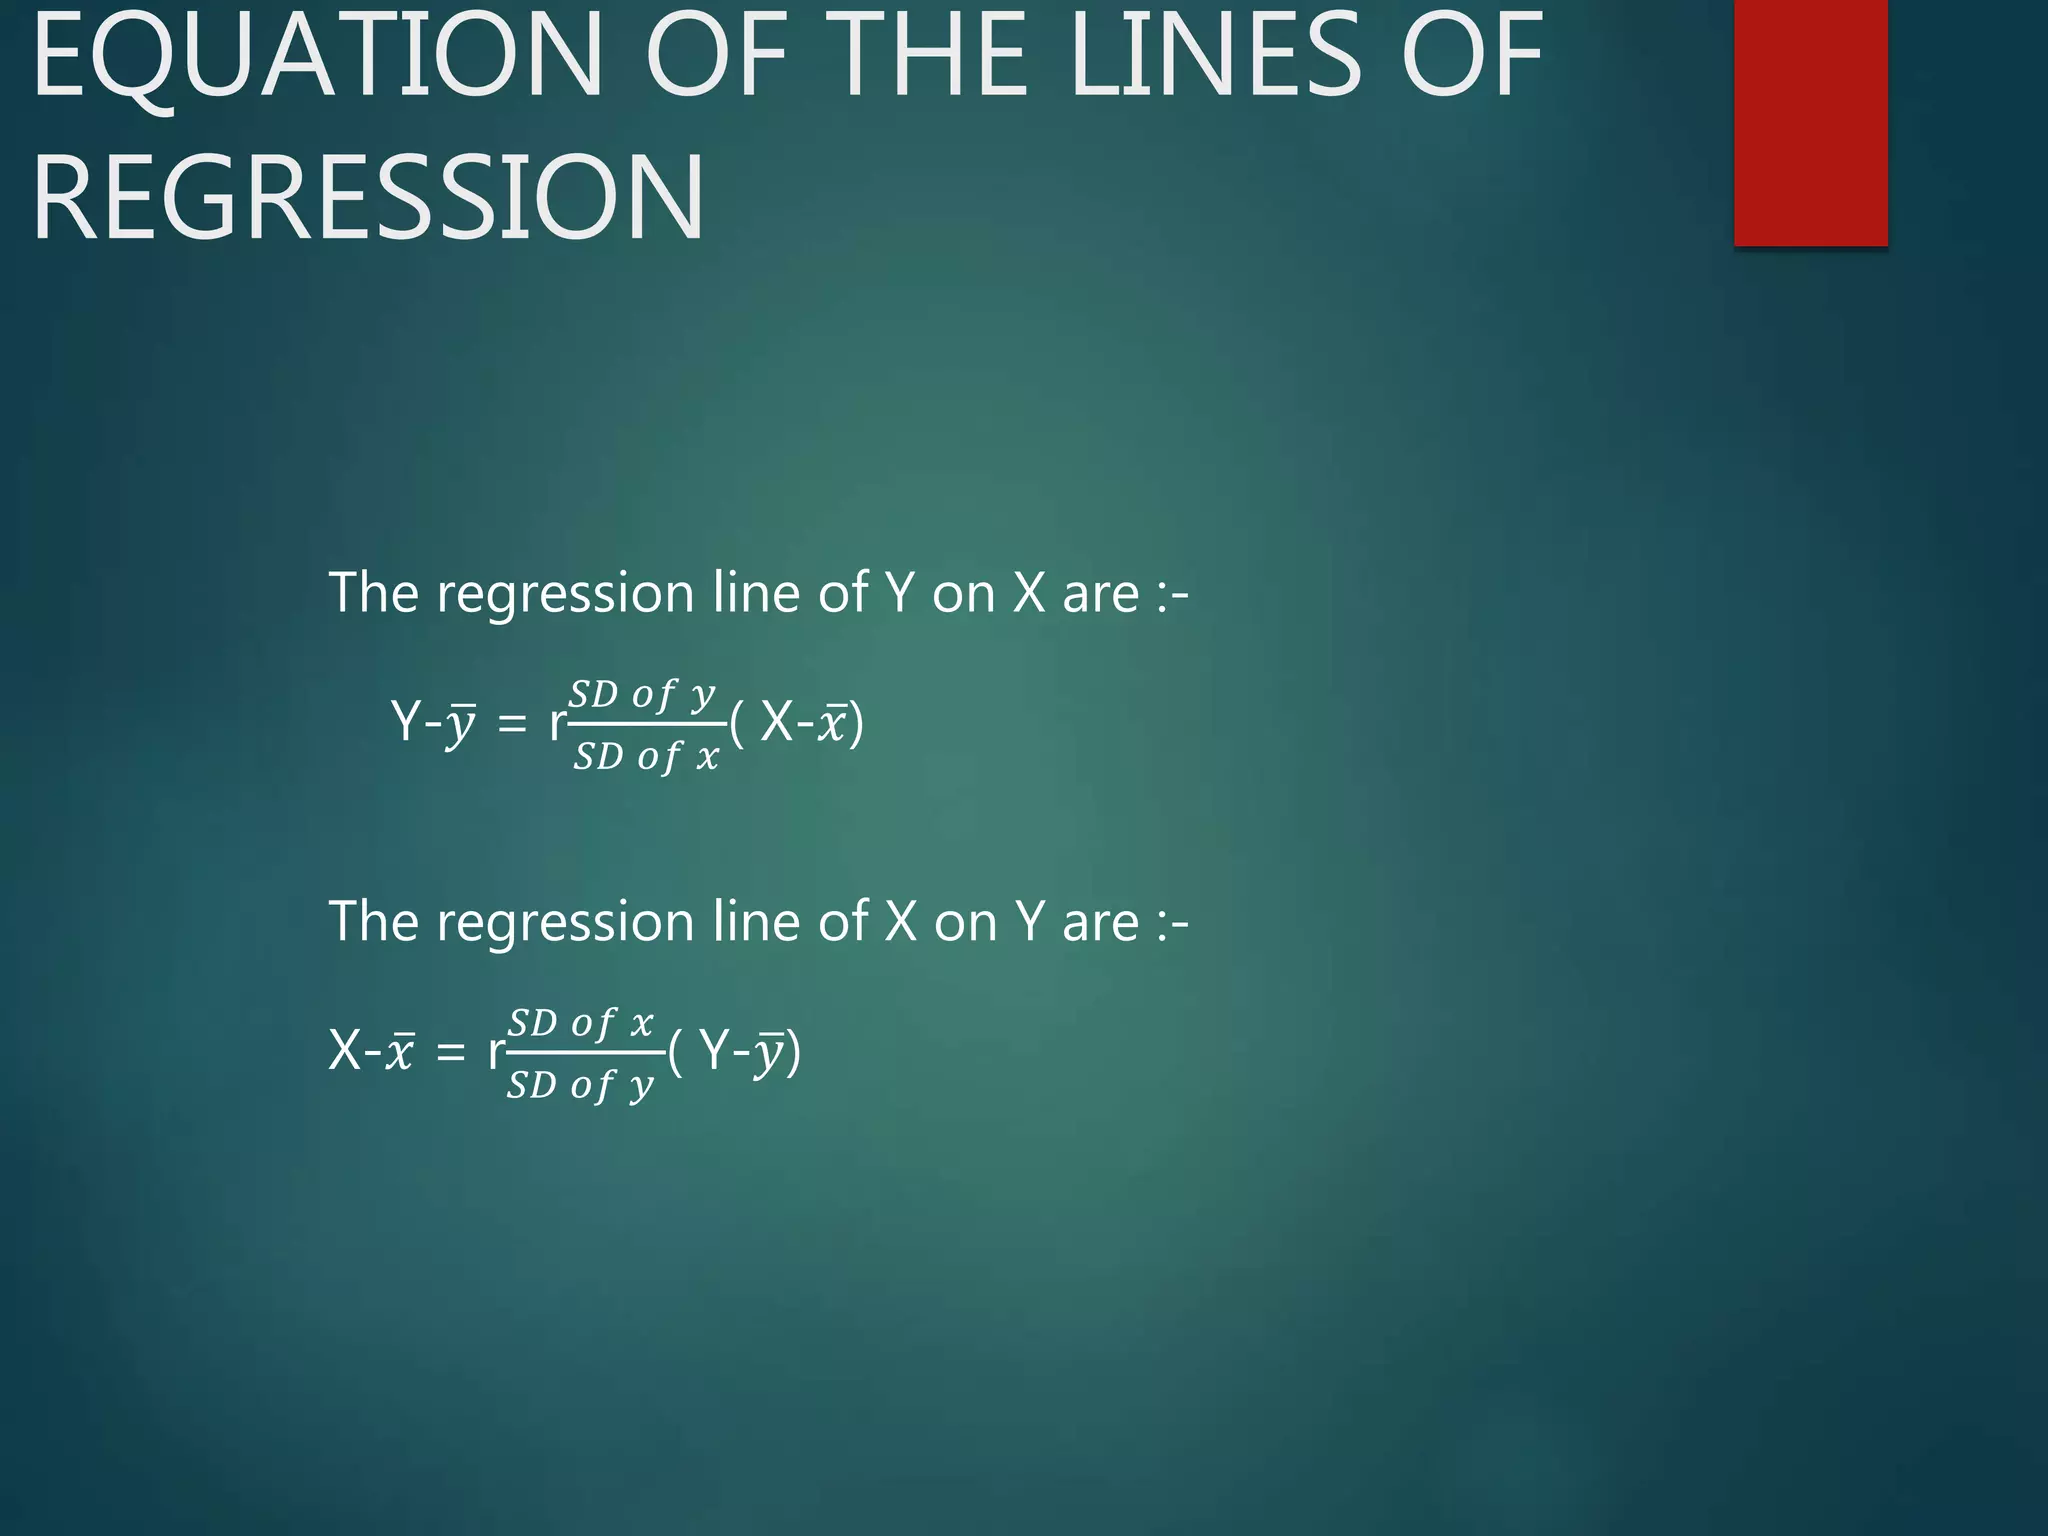
1. RNB GLOBAL UNIVERSITY
BCA 3rd SEMESTER
Mathematics-III
SUBMITTED TO : -
Ms. Purnima
SUBMITTED BY : -
Tanishq Soni
Correlation & Regression
2. CORRELATION
DEFINITION:- WHENEVER, TWO VARIABLES X AND Y ARE SO RELATED THAT
A CHANGE IN ONE IS ACCOMPANIED BY A CHANGE IN THE OTHER IN SUCH
A WAY THAT AN INCREASE(OR DECREASE) IN THE ONE ACCOMPANIED BY
AN INCREASE(OR DECREASE) IN THE OTHER, THAN VARIABLES IS CALLED
CORRELATION.
THE FOLLOWING OBSERVATIONS ARE AS FOLLOWS:-
1) IF WHEN X INCREASE Y ALSO INCREASE THEN THERE IS POSITIVE
LINEAR CORRELATION.
2) IF WHEN X INCREASE Y DECREASE THEN THERE IS NEGATIVE
CORRELATION.
3) WHEN CHANGE OF ONE VARIABLE DOES NOT EFFECT ON SECOND
VARIABLE THEN THERE IS NO CORRELATION I.E., VARIABLE ARE SAID
TO BE UNCORRELATED.
3. ASSUMPTION OF
CORRELATION ANALYSIS
The only real assumption of correlation analysis is that the
variables are interval level. However the correlation only
examines the linear relationship between X and Y. so,
while the correlation doesnβt assume anything about the
variables.
It is similar to the case with the mean: the
arithmetic mean doesnβt assume anything about the
variables except, again that they are invariant.
However, it is not necessary the case that the
mean or correltion are poor choices even with the oddly
distributed data.it depends on what you are trying to
measure.
4. COEFFICIENT OF CORRELATION
( KARL PEARSON COEFFICIENT)
Karl pearson defined the coefficient of correlation r
(ππ ππ₯π¦) between two variables x and y by the relation
r = ππ₯π¦ =
πΆππ£ (π₯,π¦)
(ππ· ππ π₯)(ππ·ππ π¦)
Where cov(x,y) =
1
π π=1
π
π₯π¦ β ( π₯ π¦ )
SD of x = {
1
π π=1
π
π₯Β²- (π₯)Β²}
SD of y = {
1
π π=1
π
π¦Β²- (π¦)Β²}
Other formula of correlation coefficient are
r =
ππ
πΒ² πΒ²
5. COEFFICIENT OF
DETERMINATION (π 2
)
Coefficient of determination is used to analyze how differences in one
variable can be explained by a differences in a second variables.
STEP-1 = Find r (correlation coefficient)
STEP-2 = Square the r (correlation coefficient)
STEP-3 = Convert the correlation coefficient to a
percent (%).
The coefficient of determination can be thought of as a % . It gives you
an idea of how many data points fall within the line formed by the
regression equation.
6. MEASUREMENT OF
CORRELATION -KARL
PEARSONβS COEFFICIENT
The pearson correlation coefficient, often referred to as the Pearson R
test, is a statistical formula that measures the strength between
variables and relationship. To determine how strong the relationship is
between two variables, you need to find the COEFFICIENT value, which
can range between -1 and 1.
Karl Pearson coefficient equation is
ππ₯π¦ = π=1
π
(π₯ β π₯)(π¦β π¦)
π=1
π
(π₯β π₯ )Β²(π¦β π¦)Β²
7. MEASUREMENT OF
CORRELATION-SPEARMANβS
RANK CORRELATION
The coefficient of correlation can be found between Xβs and
Yβs by the methods followed in the use of pearsonβs
coefficient of correlation.however only ranks are considered
in this and so we call RANK CORRELATION COEFFICIENT in
the characteristics X and Y for that group individuals.
Assuming that no two individual are equal of the individual
take the rank value 1,2,β¦β¦.,n.
Formula for unrepeated rank is:-
Ο = 1-
6 πΒ²
π(π2β1)
Formula for repeated rank is:-
Ο= 1-
6( πΒ²+
(π‘3βπ‘)
12
)
π(π2β1)
8. CONCURRENT DEVIATION THE
CORRELATION COEFFICIENT
ο This is another simple method of obtaining a quick
but crude idea of correlation between two variables.
ο Here only direction of change in the concerned
variables are noted by comparing a value by its
preceding value.
ο If the value is greater than its preceding value, it is
indicated by a positive (+) sign, if less; it is indicated by
a negative (-) sign and equal values are indicated by
equal(=) sign.
9. ο All the pairs having same signs , i.e., either both the deviations are
positive or negative or have equal sign, are known as CONCURRENT
DEVIATIONS and are indicated by positive (+) sign in a separate column
designated as βCONCURRENCESβ.
ο The number of such concurrences are denoted by C.
ο Similarly the remaining pairs having different signs are marked by
negative (-) sign in another column , designated as βDISAGREEMENTSβ.
10. ο The coefficient of correlation denoted by ππ is given by
the following formula:
ππ = Β± Β±(
2πΆβπ·
π·
)
Where;
C denotes the number of concurrences
D is the number of pair of observations.
i.e., D = number of observations β 1 = (n-1).
11. REGRESSION
βRegressionβ stand for some sort of functional relationship between two or
more related variables.
suppose that the scatter diagram indicates some relationship
between the two variates x and y ; the dots of the scatter diagram will be
more or less concentrated round a curve.
This curve is called the curve of regression.
LINES OF REGRESSION :- When the curve is a straight line ;it is called a line of
regresion and the regression is said to be linear. A line of regression is the
straight line which gives the best fit in the least square sense of the given
frequency.
12. EQUATION OF THE LINES OF
REGRESSION
The regression line of Y on X are :-
Y- π¦ = r
ππ· ππ π¦
ππ· ππ π₯
( X- π₯)
The regression line of X on Y are :-
X- π₯ = r
ππ· ππ π₯
ππ· ππ π¦
( Y- π¦)