Downloaded 336 times
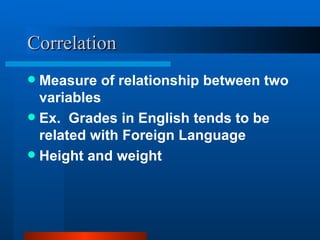
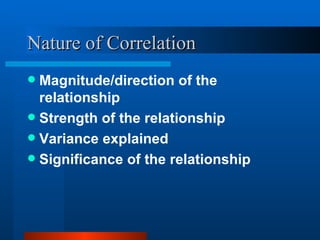
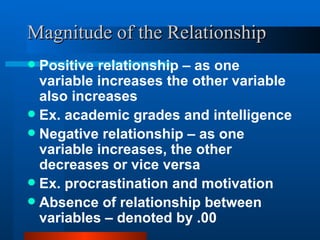
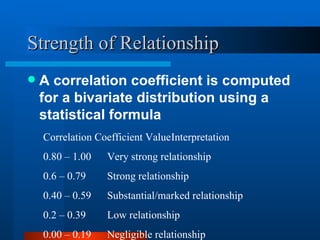
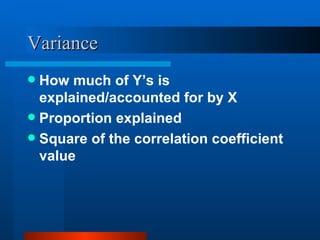
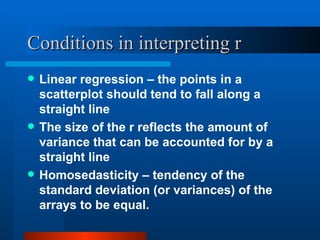
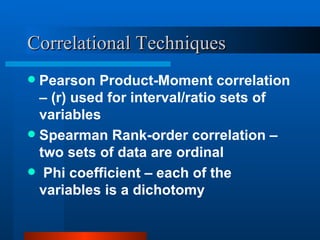

This document discusses correlation and the correlation coefficient. It defines correlation as a measure of the relationship between two variables. It explains that the correlation coefficient indicates the magnitude and direction of the relationship as well as the strength of the relationship and percentage of variance explained. Values of the correlation coefficient are interpreted as showing no relationship, a low relationship, or a strong relationship. Conditions for interpreting the correlation coefficient include data forming a linear pattern and equal variances.