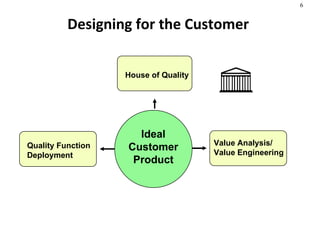
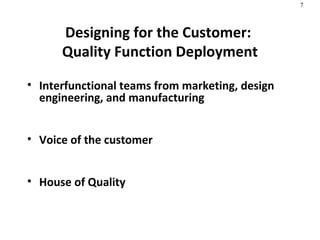
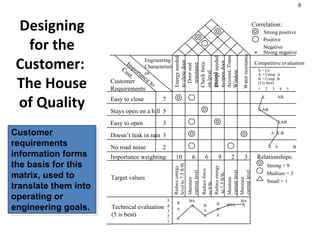
Chapter 5 Product Design & Process Selection-Manufacturing
Typical Phases of Product Design Development Designing for the Customer Design for Manufacturability   Types of Processes Process Flow Structures Process Flow Design Global Product Design and Manufacturing OBJECTIVES
Typical Phases of Product Design Development Concept Development Product Planning Product/Process Engineering Pilot Production/Ramp-Up
Concurrent Engineering Defined Concurrent engineering  can be defined as the simultaneous development of project design functions, with open and interactive communication existing among all team members for the purposes of reducing time to market, decreasing cost, and improving quality and reliability
Concurrent Engineering(Continued) Teams provide the primary integration mechanism in CE programs  There are three types of teams Program Management Team Technical Team Design-Build Teams Time savings of CE programs are created by performing activities in parallel
Designing for the Customer  Ideal Customer Product Quality Function Deployment Value Analysis/ Value Engineering House of Quality
Designing for the Customer:  Quality Function Deployment Interfunctional teams from marketing, design engineering, and manufacturing Voice of the customer House of Quality
Designing for the Customer:  The House of Quality The McGraw-Hill Companies, Inc., 2004 Customer requirements information forms the basis for this matrix, used to translate them into operating or engineering goals. Customer  Requirements Importance to Cust. Easy to close Stays open on a hill Easy to open Doesn’t leak in rain No road noise Importance weighting Engineering Characteristics Energy needed  to close door Check force on level ground Energy needed  to open door Water resistance 10 6 6 9 2 3 7 5 3 3 2 X X X X X Correlation: Strong positive Positive Negative Strong negative X * Competitive evaluation X = Us A = Comp. A B = Comp. B (5 is best) 1  2  3  4  5 X AB X AB XAB A  X B X  A B Relationships: Strong = 9 Medium = 3 Small = 1 Target values Reduce energy  level to 7.5 ft/lb Reduce force to 9 lb. Reduce energy to 7.5 ft/lb. Maintain current level Technical evaluation (5 is best) 5 4 3 2 1 B A X BA X B A X B X A BXA BA X Door seal  resistance Accoust. Trans. Window Maintain current level Maintain current level
Designing for the Customer:  Value Analysis/Value Engineering (VA/VE) Achieve equivalent or better performance at a lower cost while maintaining all functional requirements defined by the customer Does the item have any design features that are not necessary? Can two or more parts be combined into one? How can we cut down the weight? Are there nonstandard parts that can be eliminated?
Design for Manufacturability Traditional Approach “ We design it, you build it” or “Over the wall” Concurrent Engineering “ Let’s work together simultaneously”
Design for Manufacturing and Assembly Greatest improvements related to DFMA arise from simplification of the product by reducing the number of separate parts: During the operation of the product, does the part move relative to all other parts already assembled? Must the part be of a different material or be isolated from other parts already assembled? Must the part be separate from all other parts to allow the disassembly of the product for adjustment or maintenance?
Types of Processes Conversion (ex. Iron to steel) Fabrication (ex. Cloth to clothes)  Assembly (ex. Parts to components) Testing (ex. For quality of products)
Process Flow Structures Job shop (ex. Copy center making a single copy of a student term paper) Batch shop (ex. Copy center making 10,000 copies of an ad piece for a business) Assembly Line (ex. Automobile manufacturer) Continuous Flow (ex. Petroleum manufacturer)
Exhibit 5.10 These are the major stages of  product and process life cycles IV. Continuous Flow III. Assembly Line II. Batch I. Job Shop Low Volume, One of a Kind Multiple Products, Low Volume Few Major Products, Higher Volume High Volume, High Standard- ization Commercial Printer French Restaurant Heavy Equipment Automobile Assembly Burger King Sugar Refinery Flexibility (High) Unit Cost (High) Flexibility (Low) Unit Cost (Low)
Virtual Factory Defined A  virtual factory  can be defined as a manufacturing operation where activities are carried out not in one central plant, but in multiple locations by suppliers and partner firms as part of a strategic alliance
Break-Even Analysis A standard approach to choosing among alternative processes or equipment Model seeks to determine the point in units produced (and sold) where we will start making profit on the process or equipment  Model seeks to determine the point in units produced (and sold) where total revenue and total cost are equal
Break-Even Analysis (Continued) This formula can be used to find any of its components algebraically if the other parameters are known Break-even Demand= Purchase cost of process or equipment Price per unit  - Cost per unit or Total fixed costs of process or equipment   Unit price to customer  - Variable costs per unit
Break-Even Analysis (Continued) Example:  Suppose you want to purchase a new computer that will cost $5,000.  It will be used to process written orders from customers who will pay $25 each for the service.  The cost of labor, electricity and the form used to place the order is $5 per customer.  How many customers will we need to serve to permit the total revenue to break-even with our costs? Break-even Demand:   =  Total fixed costs of process or equip . Unit price to customer – Variable costs   =5,000/(25-5)   =250 customers
Process Flow Design Defined A  process flow design  can be defined as a mapping of the specific processes that raw materials, parts, and subassemblies follow as they move through a plant The most common tools to conduct a process flow design include assembly drawings, assembly charts, and operation and route sheets
Example: Assembly Chart (Gozinto) From Exhibit 5.14 A-2 SA-2 4 5 6 7 Lockring Spacer, detent spring Rivets (2) Spring-detent A-5 Component/Assy Operation Inspection
Example: Process Flow Chart   Material Received from Supplier Inspect Material for Defects Defects found? Return to Supplier for Credit Yes No , Continue…
Global Product Design and Manufacturing Strategies Joint Ventures Global Product Design Strategy
Measuring Product Development Performance Measures Freq. Of new products introduced Time to market introduction Number stated and number completed Actual versus plan Percentage of sales from new products Time-to-market Productivity Quality Engineering hours per project Cost of materials and tooling per project Actual versus plan Conformance-reliability in use Design-performance and customer satisfaction Yield-factory and field Performance  Dimension
End of Chapter 5

Product Design & Process Selection-Manufacturing

  • 1.
    Chapter 5 ProductDesign & Process Selection-Manufacturing
  • 2.
    Typical Phases ofProduct Design Development Designing for the Customer Design for Manufacturability Types of Processes Process Flow Structures Process Flow Design Global Product Design and Manufacturing OBJECTIVES
  • 3.
    Typical Phases ofProduct Design Development Concept Development Product Planning Product/Process Engineering Pilot Production/Ramp-Up
  • 4.
    Concurrent Engineering DefinedConcurrent engineering can be defined as the simultaneous development of project design functions, with open and interactive communication existing among all team members for the purposes of reducing time to market, decreasing cost, and improving quality and reliability
  • 5.
    Concurrent Engineering(Continued) Teamsprovide the primary integration mechanism in CE programs There are three types of teams Program Management Team Technical Team Design-Build Teams Time savings of CE programs are created by performing activities in parallel
  • 6.
    Designing for theCustomer Ideal Customer Product Quality Function Deployment Value Analysis/ Value Engineering House of Quality
  • 7.
    Designing for theCustomer: Quality Function Deployment Interfunctional teams from marketing, design engineering, and manufacturing Voice of the customer House of Quality
  • 8.
    Designing for theCustomer: The House of Quality The McGraw-Hill Companies, Inc., 2004 Customer requirements information forms the basis for this matrix, used to translate them into operating or engineering goals. Customer Requirements Importance to Cust. Easy to close Stays open on a hill Easy to open Doesn’t leak in rain No road noise Importance weighting Engineering Characteristics Energy needed to close door Check force on level ground Energy needed to open door Water resistance 10 6 6 9 2 3 7 5 3 3 2 X X X X X Correlation: Strong positive Positive Negative Strong negative X * Competitive evaluation X = Us A = Comp. A B = Comp. B (5 is best) 1 2 3 4 5 X AB X AB XAB A X B X A B Relationships: Strong = 9 Medium = 3 Small = 1 Target values Reduce energy level to 7.5 ft/lb Reduce force to 9 lb. Reduce energy to 7.5 ft/lb. Maintain current level Technical evaluation (5 is best) 5 4 3 2 1 B A X BA X B A X B X A BXA BA X Door seal resistance Accoust. Trans. Window Maintain current level Maintain current level
  • 9.
    Designing for theCustomer: Value Analysis/Value Engineering (VA/VE) Achieve equivalent or better performance at a lower cost while maintaining all functional requirements defined by the customer Does the item have any design features that are not necessary? Can two or more parts be combined into one? How can we cut down the weight? Are there nonstandard parts that can be eliminated?
  • 10.
    Design for ManufacturabilityTraditional Approach “ We design it, you build it” or “Over the wall” Concurrent Engineering “ Let’s work together simultaneously”
  • 11.
    Design for Manufacturingand Assembly Greatest improvements related to DFMA arise from simplification of the product by reducing the number of separate parts: During the operation of the product, does the part move relative to all other parts already assembled? Must the part be of a different material or be isolated from other parts already assembled? Must the part be separate from all other parts to allow the disassembly of the product for adjustment or maintenance?
  • 12.
    Types of ProcessesConversion (ex. Iron to steel) Fabrication (ex. Cloth to clothes) Assembly (ex. Parts to components) Testing (ex. For quality of products)
  • 13.
    Process Flow StructuresJob shop (ex. Copy center making a single copy of a student term paper) Batch shop (ex. Copy center making 10,000 copies of an ad piece for a business) Assembly Line (ex. Automobile manufacturer) Continuous Flow (ex. Petroleum manufacturer)
  • 14.
    Exhibit 5.10 Theseare the major stages of product and process life cycles IV. Continuous Flow III. Assembly Line II. Batch I. Job Shop Low Volume, One of a Kind Multiple Products, Low Volume Few Major Products, Higher Volume High Volume, High Standard- ization Commercial Printer French Restaurant Heavy Equipment Automobile Assembly Burger King Sugar Refinery Flexibility (High) Unit Cost (High) Flexibility (Low) Unit Cost (Low)
  • 15.
    Virtual Factory DefinedA virtual factory can be defined as a manufacturing operation where activities are carried out not in one central plant, but in multiple locations by suppliers and partner firms as part of a strategic alliance
  • 16.
    Break-Even Analysis Astandard approach to choosing among alternative processes or equipment Model seeks to determine the point in units produced (and sold) where we will start making profit on the process or equipment Model seeks to determine the point in units produced (and sold) where total revenue and total cost are equal
  • 17.
    Break-Even Analysis (Continued)This formula can be used to find any of its components algebraically if the other parameters are known Break-even Demand= Purchase cost of process or equipment Price per unit - Cost per unit or Total fixed costs of process or equipment Unit price to customer - Variable costs per unit
  • 18.
    Break-Even Analysis (Continued)Example: Suppose you want to purchase a new computer that will cost $5,000. It will be used to process written orders from customers who will pay $25 each for the service. The cost of labor, electricity and the form used to place the order is $5 per customer. How many customers will we need to serve to permit the total revenue to break-even with our costs? Break-even Demand: = Total fixed costs of process or equip . Unit price to customer – Variable costs =5,000/(25-5) =250 customers
  • 19.
    Process Flow DesignDefined A process flow design can be defined as a mapping of the specific processes that raw materials, parts, and subassemblies follow as they move through a plant The most common tools to conduct a process flow design include assembly drawings, assembly charts, and operation and route sheets
  • 20.
    Example: Assembly Chart(Gozinto) From Exhibit 5.14 A-2 SA-2 4 5 6 7 Lockring Spacer, detent spring Rivets (2) Spring-detent A-5 Component/Assy Operation Inspection
  • 21.
    Example: Process FlowChart Material Received from Supplier Inspect Material for Defects Defects found? Return to Supplier for Credit Yes No , Continue…
  • 22.
    Global Product Designand Manufacturing Strategies Joint Ventures Global Product Design Strategy
  • 23.
    Measuring Product DevelopmentPerformance Measures Freq. Of new products introduced Time to market introduction Number stated and number completed Actual versus plan Percentage of sales from new products Time-to-market Productivity Quality Engineering hours per project Cost of materials and tooling per project Actual versus plan Conformance-reliability in use Design-performance and customer satisfaction Yield-factory and field Performance Dimension
  • 24.

Editor's Notes