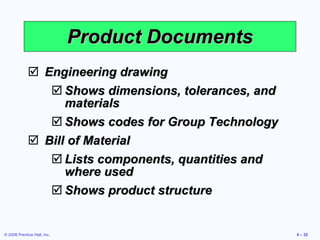
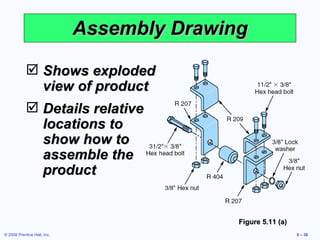
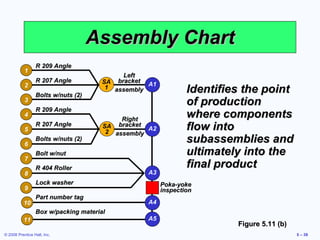
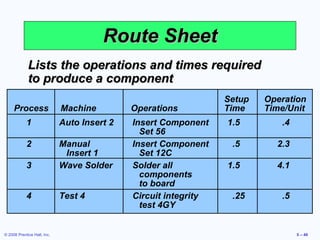
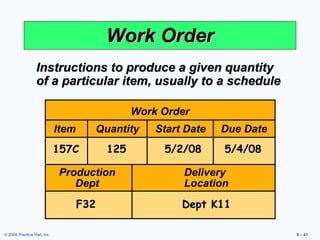
Operations Management Chapter 5 –  Design of Goods  and Services PowerPoint presentation to accompany  Heizer/Render  Principles of Operations Management, 7e Operations Management, 9e
Learning Objectives Define product life cycle Describe a product development system Describe how time-based competition is implemented 4.  Describe how products and services are defined 5.  Prepare the documents needed for production When you complete this chapter you should be able to :
The good or service the organization provides society Top organizations typically focus on core products Customers buy satisfaction, not just a physical good or particular service Fundamental to an organization's strategy with implications throughout the operations function Product Decision
Product Strategy Options Differentiation Shouldice Hospital Low cost Taco Bell Rapid response Toyota
Product Life Cycles May be any length from a few hours to decades The operations function must be able to introduce new products successfully
Product Life Cycles Negative cash flow Figure 5.1 Introduction Growth Maturity Decline Sales, cost, and cash flow Cost of development and production Cash flow Net revenue (profit) Sales revenue Loss
Product Life Cycle Introduction Fine tuning may warrant unusual expenses for Research Product development Process modification and enhancement Supplier development
Product Life Cycle Growth Product design begins to stabilize Effective forecasting of capacity becomes necessary Adding or enhancing capacity may be necessary
Product Life Cycle Maturity Competitors now established High volume, innovative production may be needed Improved cost control, reduction in options, paring down of product line
Product Life Cycle Decline Unless product makes a special contribution to the organization, must plan to terminate offering
Product-by-Value Analysis Lists products in descending order of their individual dollar contribution to the firm Lists the total annual dollar contribution of the product Helps management evaluate alternative strategies
Product-by-Value Analysis Sam’s Furniture Factory $51,000 $136 Recliner $6,240 $12 Foot Stool $51,765 $87 Arm Chair $36,720 $102 Love Seat Total Annual Contribution ($) Individual Contribution ($)
New Product Opportunities Understanding the  customer Economic change Sociological and  demographic change Technological change Political/legal change Market practice, professional standards, suppliers, distributors Brainstorming is a useful tool
Importance of New Products Figure 5.2 Industry leader Top third Middle third Bottom third Percentage of Sales from New Products 50%  40%  30%  20%  10%  Position of Firm in Its Industry
Organizing for Product Development Historically – distinct departments Duties and responsibilities are defined Difficult to foster forward thinking A Champion Product manager drives the product through the product development system and related organizations
Organizing for Product Development Team approach Cross functional – representatives from all disciplines or functions Product development teams, design for manufacturability teams, value engineering teams Japanese “whole organization” approach No organizational divisions
Manufacturability and  Value Engineering Benefits: Reduced complexity of products Additional standardization of products Improved functional aspects of product Improved job design and job safety Improved maintainability (serviceability) of the product Robust design
Cost Reduction of a Bracket via Value Engineering Figure 5.5
Issues for Product Development Robust design Modular design Computer-aided design (CAD) Computer-aided manufacturing (CAM) Virtual reality technology Value analysis Environmentally friendly design
Robust Design Product is designed so that small variations in production or assembly do not adversely affect the product Typically results in lower cost and higher quality
Modular Design Products designed in easily segmented components Adds flexibility to both production and marketing Improved ability to satisfy customer requirements
Using computers to design products and prepare engineering documentation Shorter development cycles, improved accuracy, lower cost Information and designs can be deployed worldwide Computer Aided Design (CAD)
Computer-Aided Manufacturing (CAM) Utilizing specialized computers and program to control manufacturing equipment Often driven by the CAD system (CAD/CAM)
Product quality Shorter design time Production cost reductions Database availability New range of capabilities Benefits of CAD/CAM
Virtual Reality Technology Computer technology used to develop an interactive, 3-D model of a product from the basic CAD data Allows people to ‘see’ the finished design before a physical model is built Very effective in large-scale designs such as plant layout
Value Analysis Focuses on design improvement during production Seeks improvements leading either to a better product or a product which can be produced more economically
Legal and Industry Standards For Design … Federal Drug Administration Consumer Products Safety Commission National Highway Safety Administration Children’s Product Safety Act
Legal and Industry Standards For Manufacture/Assembly … Occupational Safety and Health Administration Environmental Protection Agency Professional ergonomic standards State and local laws dealing with employment standards, discrimination, etc.
Legal and Industry Standards For Disassembly/Disposal … Vehicle Recycling Partnership Increasingly rigid laws worldwide
Acquiring Technology By Purchasing a Firm Speeds development Issues concern the fit between the acquired organization and product and the host Through Joint Ventures Both organizations learn Risks are shared Through Alliances Cooperative agreements between independent organizations
Defining The Product First definition is in terms of functions Rigorous specifications are developed during the design phase Manufactured products will have an engineering drawing Bill of material (BOM) lists the components of a product
Engineering drawing Shows dimensions, tolerances, and materials Shows codes for Group Technology Bill of Material  Lists components, quantities and where used Shows product structure Product Documents
Monterey Jack Cheese (a)  U.S. grade AA . Monterey cheese shall conform to the following requirements: (1)  Flavor .  Is fine and highly pleasing, free from undesirable flavors and odors.  May possess a very slight acid or feed flavor. (2)  Body and texture .  A plug drawn from the cheese shall be reasonably firm.  It shall have numerous small mechanical openings evenly distributed throughout the plug.  It shall not possess sweet holes, yeast holes, or other gas holes. (3)  Color .  Shall have a natural, uniform, bright and attractive appearance. (4)  Finish and appearance - bandaged and paraffin-dipped .  The rind shall be sound, firm, and smooth providing a good protection to the cheese. Code of Federal Regulation, Parts 53 to 109, General Service Administration
Bills of Material Hard Rock Cafe’s Hickory BBQ Bacon Cheeseburger Figure 5.9 (b) DESCRIPTION QTY Bun 1 Hamburger patty 8 oz. Cheddar cheese 2 slices Bacon 2 strips BBQ onions 1/2 cup Hickory BBQ sauce 1 oz. Burger set Lettuce 1 leaf Tomato 1 slice Red onion 4 rings Pickle 1 slice French fries 5 oz. Seasoned salt 1 tsp. 11-inch plate 1 HRC flag 1
Parts grouped into families with similar characteristics Coding system describes processing and physical characteristics Part families can be produced  in dedicated manufacturing cells Group Technology
Improved design Reduced raw material and purchases Simplified production planning and control Improved layout, routing, and machine loading Reduced tooling setup time, work-in-process, and production time Group Technology Benefits
Documents for Production Assembly drawing Assembly chart Route sheet Work order Engineering change notices (ECNs)
Assembly Drawing Shows exploded view of product Details relative locations to show how to assemble the product Figure 5.11 (a)
Assembly Chart Figure 5.11 (b) Identifies the point of production where components flow into subassemblies and ultimately into the final product 1 2 3 4 5 6 7 8 9 10 11 R 209 Angle R 207 Angle Bolts w/nuts (2) R 209 Angle R 207 Angle Bolt w/nut R 404 Roller Lock washer Part number tag Box w/packing material Bolts w/nuts (2) SA 1 SA 2 A1 A2 A3 A4 A5 Left bracket assembly Right bracket assembly Poka-yoke inspection
Route Sheet Lists the operations and times required to produce a component Setup Operation Process Machine Operations Time Time/Unit 1 Auto Insert 2 Insert Component  1.5 .4   Set 56 2 Manual  Insert Component  .5 2.3     Insert 1  Set 12C 3 Wave Solder Solder all  1.5 4.1 components  to board 4 Test 4 Circuit integrity  .25 .5 test 4GY
Work Order Instructions to produce a given quantity of a particular item, usually to a schedule Work Order Item Quantity Start Date Due Date Production Delivery Dept Location 157C 125 5/2/08 5/4/08 F32 Dept K11
Engineering Change Notice (ECN) A correction or modification to a product’s definition or documentation Engineering drawings Bill of material Quite common with long product life cycles, long manufacturing lead times, or rapidly changing technologies
Service Design Service typically includes direct interaction with the customer Increased opportunity for customization Reduced productivity Cost and quality are still determined at the design stage Delay customization Modularization Reduce customer interaction, often through automation
Moments of Truth Concept created by Jan Carlzon of Scandinavian Airways Critical moments between the customer and the organization that determine customer satisfaction There may be many of these moments These are opportunities to gain or lose business
Transition to Production Know when to move to production Product development can be viewed as evolutionary and never complete Product must move from design to production in a timely manner Most products have a trial production period to insure producibility Develop tooling, quality control, training Ensures successful production
Transition to Production Responsibility must also transition as the product moves through its life cycle Line management takes over from design Three common approaches to managing transition Project managers Product development teams Integrate product development and manufacturing organizations
Operations Management Chapter 6 –  Managing Quality PowerPoint presentation to accompany  Heizer/Render  Principles of Operations Management, 7e Operations Management, 9e
Learning Objectives When you complete this chapter you should be able to: Define quality and TQM Explain Six Sigma Explain how benchmarking is used  Explain quality robust products and Taguchi concepts
Two Ways Quality  Improves Profitability Figure 6.1 Improved Quality Increased Profits Increased productivity Lower rework and scrap costs Lower warranty costs Reduced Costs via Improved response Flexible pricing Improved reputation Sales Gains via
Defining Quality The totality of features and characteristics of a product or service that bears on its ability to satisfy stated or implied needs American Society for Quality
Different Views User-based – better performance, more features Manufacturing-based – conformance to standards, making it right the first time Product-based – specific and measurable attributes of the product
Key Dimensions of Quality Performance Features Reliability Conformance Durability Serviceability Aesthetics Perceived quality Value
Takumi A Japanese character that symbolizes a broader dimension than quality, a deeper process than education, and a more perfect method than persistence
Costs of Quality Prevention costs - reducing the potential for defects Appraisal costs - evaluating products, parts, and services Internal failure - producing defective parts or service before delivery External costs - defects discovered  after delivery
TQM Encompasses entire organization, from supplier to customer Stresses a commitment by management to have a continuing, companywide drive toward excellence in all aspects of products and services that are important to the customer
Seven Concepts of TQM Continuous improvement Six Sigma Employee empowerment Benchmarking Just-in-time (JIT) Taguchi concepts Knowledge of TQM tools
Continuous Improvement Represents continual improvement of all processes  Involves all operations and work centers including suppliers and customers People, Equipment, Materials, Procedures
Six Sigma Two meanings Statistical definition of a process that is 99.9997% capable, 3.4 defects per million opportunities (DPMO) A program designed to reduce defects, lower costs, and improve customer satisfaction
Six Sigma Two meanings Statistical definition of a process that is 99.9997% capable, 3.4 defects per million opportunities (DPMO) A program designed to reduce defects, lower costs, and improve customer satisfaction Figure 6.4 Mean Lower limits Upper limits 3.4 defects/million ±6  2,700 defects/million ±3 
Six Sigma DMAIC Approach Define critical outputs  and identify gaps for improvement Measure the work and  collect process data Analyze the data Improve the process Control the new process to make sure new performance is maintained
Benchmarking Use internal benchmarking if you’re big enough Selecting best practices to use as a standard for performance Determine what to  benchmark Form a benchmark team Identify benchmarking partners Collect and analyze benchmarking information Take action to match or exceed the benchmark
Just-in-Time (JIT) Relationship to quality: JIT cuts the cost of quality JIT improves quality Better quality means less inventory and better, easier-to-employ JIT system
Just-in-Time (JIT) ‘ Pull’ system of production scheduling including supply management Production only when signaled Allows reduced inventory levels Inventory costs money and hides process and material problems Encourages improved process and product quality
Taguchi Concepts Engineering and experimental design methods to improve product and process design Identify key component and process variables affecting product variation Taguchi Concepts Quality robustness Quality loss function Target-oriented quality
Quality Robustness Ability to produce products uniformly in adverse manufacturing and environmental conditions Remove the effects of adverse conditions Small variations in materials and process do not destroy product quality
Quality Loss Function Shows that costs increase as the product moves away from what the customer wants Costs include customer dissatisfaction, warranty  and service, internal  scrap and repair, and costs to society Traditional conformance specifications are too simplistic Target-oriented quality
Inspection Involves examining items to see if an item is good or defective Detect a defective product Does not correct deficiencies in process or product It is expensive Issues When to inspect Where in process to inspect
When and Where to Inspect At the supplier’s plant while the supplier is producing At your facility upon receipt of goods from the supplier Before costly or irreversible processes During the step-by-step production process When production or service is complete Before delivery to your customer At the point of customer contact
Inspection Many problems Worker fatigue Measurement error Process variability Cannot inspect quality into a product Robust design, empowered employees, and sound processes are better solutions
TQM In Services Service quality is more difficult to measure than the quality of goods Service quality perceptions depend on  Intangible differences between products Intangible expectations customers have of those products
Service Quality The Operations Manager must recognize: The tangible component of services is important The service process is important The service is judged against the customer’s expectations Exceptions will occur
Service Specifications at UPS
Determinants of Service Quality Reliability Responsiveness Competence Access Courtesy Communication Credibility Security Understanding/ knowing the customer Tangibles
Service Recovery Strategy Managers should have a plan for when services fail Marriott’s LEARN routine Listen Empathize Apologize React Notify

Product Design

  • 1.
    Operations Management Chapter5 – Design of Goods and Services PowerPoint presentation to accompany Heizer/Render Principles of Operations Management, 7e Operations Management, 9e
  • 2.
    Learning Objectives Defineproduct life cycle Describe a product development system Describe how time-based competition is implemented 4. Describe how products and services are defined 5. Prepare the documents needed for production When you complete this chapter you should be able to :
  • 3.
    The good orservice the organization provides society Top organizations typically focus on core products Customers buy satisfaction, not just a physical good or particular service Fundamental to an organization's strategy with implications throughout the operations function Product Decision
  • 4.
    Product Strategy OptionsDifferentiation Shouldice Hospital Low cost Taco Bell Rapid response Toyota
  • 5.
    Product Life CyclesMay be any length from a few hours to decades The operations function must be able to introduce new products successfully
  • 6.
    Product Life CyclesNegative cash flow Figure 5.1 Introduction Growth Maturity Decline Sales, cost, and cash flow Cost of development and production Cash flow Net revenue (profit) Sales revenue Loss
  • 7.
    Product Life CycleIntroduction Fine tuning may warrant unusual expenses for Research Product development Process modification and enhancement Supplier development
  • 8.
    Product Life CycleGrowth Product design begins to stabilize Effective forecasting of capacity becomes necessary Adding or enhancing capacity may be necessary
  • 9.
    Product Life CycleMaturity Competitors now established High volume, innovative production may be needed Improved cost control, reduction in options, paring down of product line
  • 10.
    Product Life CycleDecline Unless product makes a special contribution to the organization, must plan to terminate offering
  • 11.
    Product-by-Value Analysis Listsproducts in descending order of their individual dollar contribution to the firm Lists the total annual dollar contribution of the product Helps management evaluate alternative strategies
  • 12.
    Product-by-Value Analysis Sam’sFurniture Factory $51,000 $136 Recliner $6,240 $12 Foot Stool $51,765 $87 Arm Chair $36,720 $102 Love Seat Total Annual Contribution ($) Individual Contribution ($)
  • 13.
    New Product OpportunitiesUnderstanding the customer Economic change Sociological and demographic change Technological change Political/legal change Market practice, professional standards, suppliers, distributors Brainstorming is a useful tool
  • 14.
    Importance of NewProducts Figure 5.2 Industry leader Top third Middle third Bottom third Percentage of Sales from New Products 50% 40% 30% 20% 10% Position of Firm in Its Industry
  • 15.
    Organizing for ProductDevelopment Historically – distinct departments Duties and responsibilities are defined Difficult to foster forward thinking A Champion Product manager drives the product through the product development system and related organizations
  • 16.
    Organizing for ProductDevelopment Team approach Cross functional – representatives from all disciplines or functions Product development teams, design for manufacturability teams, value engineering teams Japanese “whole organization” approach No organizational divisions
  • 17.
    Manufacturability and Value Engineering Benefits: Reduced complexity of products Additional standardization of products Improved functional aspects of product Improved job design and job safety Improved maintainability (serviceability) of the product Robust design
  • 18.
    Cost Reduction ofa Bracket via Value Engineering Figure 5.5
  • 19.
    Issues for ProductDevelopment Robust design Modular design Computer-aided design (CAD) Computer-aided manufacturing (CAM) Virtual reality technology Value analysis Environmentally friendly design
  • 20.
    Robust Design Productis designed so that small variations in production or assembly do not adversely affect the product Typically results in lower cost and higher quality
  • 21.
    Modular Design Productsdesigned in easily segmented components Adds flexibility to both production and marketing Improved ability to satisfy customer requirements
  • 22.
    Using computers todesign products and prepare engineering documentation Shorter development cycles, improved accuracy, lower cost Information and designs can be deployed worldwide Computer Aided Design (CAD)
  • 23.
    Computer-Aided Manufacturing (CAM)Utilizing specialized computers and program to control manufacturing equipment Often driven by the CAD system (CAD/CAM)
  • 24.
    Product quality Shorterdesign time Production cost reductions Database availability New range of capabilities Benefits of CAD/CAM
  • 25.
    Virtual Reality TechnologyComputer technology used to develop an interactive, 3-D model of a product from the basic CAD data Allows people to ‘see’ the finished design before a physical model is built Very effective in large-scale designs such as plant layout
  • 26.
    Value Analysis Focuseson design improvement during production Seeks improvements leading either to a better product or a product which can be produced more economically
  • 27.
    Legal and IndustryStandards For Design … Federal Drug Administration Consumer Products Safety Commission National Highway Safety Administration Children’s Product Safety Act
  • 28.
    Legal and IndustryStandards For Manufacture/Assembly … Occupational Safety and Health Administration Environmental Protection Agency Professional ergonomic standards State and local laws dealing with employment standards, discrimination, etc.
  • 29.
    Legal and IndustryStandards For Disassembly/Disposal … Vehicle Recycling Partnership Increasingly rigid laws worldwide
  • 30.
    Acquiring Technology ByPurchasing a Firm Speeds development Issues concern the fit between the acquired organization and product and the host Through Joint Ventures Both organizations learn Risks are shared Through Alliances Cooperative agreements between independent organizations
  • 31.
    Defining The ProductFirst definition is in terms of functions Rigorous specifications are developed during the design phase Manufactured products will have an engineering drawing Bill of material (BOM) lists the components of a product
  • 32.
    Engineering drawing Showsdimensions, tolerances, and materials Shows codes for Group Technology Bill of Material Lists components, quantities and where used Shows product structure Product Documents
  • 33.
    Monterey Jack Cheese(a) U.S. grade AA . Monterey cheese shall conform to the following requirements: (1) Flavor . Is fine and highly pleasing, free from undesirable flavors and odors. May possess a very slight acid or feed flavor. (2) Body and texture . A plug drawn from the cheese shall be reasonably firm. It shall have numerous small mechanical openings evenly distributed throughout the plug. It shall not possess sweet holes, yeast holes, or other gas holes. (3) Color . Shall have a natural, uniform, bright and attractive appearance. (4) Finish and appearance - bandaged and paraffin-dipped . The rind shall be sound, firm, and smooth providing a good protection to the cheese. Code of Federal Regulation, Parts 53 to 109, General Service Administration
  • 34.
    Bills of MaterialHard Rock Cafe’s Hickory BBQ Bacon Cheeseburger Figure 5.9 (b) DESCRIPTION QTY Bun 1 Hamburger patty 8 oz. Cheddar cheese 2 slices Bacon 2 strips BBQ onions 1/2 cup Hickory BBQ sauce 1 oz. Burger set Lettuce 1 leaf Tomato 1 slice Red onion 4 rings Pickle 1 slice French fries 5 oz. Seasoned salt 1 tsp. 11-inch plate 1 HRC flag 1
  • 35.
    Parts grouped intofamilies with similar characteristics Coding system describes processing and physical characteristics Part families can be produced in dedicated manufacturing cells Group Technology
  • 36.
    Improved design Reducedraw material and purchases Simplified production planning and control Improved layout, routing, and machine loading Reduced tooling setup time, work-in-process, and production time Group Technology Benefits
  • 37.
    Documents for ProductionAssembly drawing Assembly chart Route sheet Work order Engineering change notices (ECNs)
  • 38.
    Assembly Drawing Showsexploded view of product Details relative locations to show how to assemble the product Figure 5.11 (a)
  • 39.
    Assembly Chart Figure5.11 (b) Identifies the point of production where components flow into subassemblies and ultimately into the final product 1 2 3 4 5 6 7 8 9 10 11 R 209 Angle R 207 Angle Bolts w/nuts (2) R 209 Angle R 207 Angle Bolt w/nut R 404 Roller Lock washer Part number tag Box w/packing material Bolts w/nuts (2) SA 1 SA 2 A1 A2 A3 A4 A5 Left bracket assembly Right bracket assembly Poka-yoke inspection
  • 40.
    Route Sheet Liststhe operations and times required to produce a component Setup Operation Process Machine Operations Time Time/Unit 1 Auto Insert 2 Insert Component 1.5 .4 Set 56 2 Manual Insert Component .5 2.3 Insert 1 Set 12C 3 Wave Solder Solder all 1.5 4.1 components to board 4 Test 4 Circuit integrity .25 .5 test 4GY
  • 41.
    Work Order Instructionsto produce a given quantity of a particular item, usually to a schedule Work Order Item Quantity Start Date Due Date Production Delivery Dept Location 157C 125 5/2/08 5/4/08 F32 Dept K11
  • 42.
    Engineering Change Notice(ECN) A correction or modification to a product’s definition or documentation Engineering drawings Bill of material Quite common with long product life cycles, long manufacturing lead times, or rapidly changing technologies
  • 43.
    Service Design Servicetypically includes direct interaction with the customer Increased opportunity for customization Reduced productivity Cost and quality are still determined at the design stage Delay customization Modularization Reduce customer interaction, often through automation
  • 44.
    Moments of TruthConcept created by Jan Carlzon of Scandinavian Airways Critical moments between the customer and the organization that determine customer satisfaction There may be many of these moments These are opportunities to gain or lose business
  • 45.
    Transition to ProductionKnow when to move to production Product development can be viewed as evolutionary and never complete Product must move from design to production in a timely manner Most products have a trial production period to insure producibility Develop tooling, quality control, training Ensures successful production
  • 46.
    Transition to ProductionResponsibility must also transition as the product moves through its life cycle Line management takes over from design Three common approaches to managing transition Project managers Product development teams Integrate product development and manufacturing organizations
  • 47.
    Operations Management Chapter6 – Managing Quality PowerPoint presentation to accompany Heizer/Render Principles of Operations Management, 7e Operations Management, 9e
  • 48.
    Learning Objectives Whenyou complete this chapter you should be able to: Define quality and TQM Explain Six Sigma Explain how benchmarking is used Explain quality robust products and Taguchi concepts
  • 49.
    Two Ways Quality Improves Profitability Figure 6.1 Improved Quality Increased Profits Increased productivity Lower rework and scrap costs Lower warranty costs Reduced Costs via Improved response Flexible pricing Improved reputation Sales Gains via
  • 50.
    Defining Quality Thetotality of features and characteristics of a product or service that bears on its ability to satisfy stated or implied needs American Society for Quality
  • 51.
    Different Views User-based– better performance, more features Manufacturing-based – conformance to standards, making it right the first time Product-based – specific and measurable attributes of the product
  • 52.
    Key Dimensions ofQuality Performance Features Reliability Conformance Durability Serviceability Aesthetics Perceived quality Value
  • 53.
    Takumi A Japanesecharacter that symbolizes a broader dimension than quality, a deeper process than education, and a more perfect method than persistence
  • 54.
    Costs of QualityPrevention costs - reducing the potential for defects Appraisal costs - evaluating products, parts, and services Internal failure - producing defective parts or service before delivery External costs - defects discovered after delivery
  • 55.
    TQM Encompasses entireorganization, from supplier to customer Stresses a commitment by management to have a continuing, companywide drive toward excellence in all aspects of products and services that are important to the customer
  • 56.
    Seven Concepts ofTQM Continuous improvement Six Sigma Employee empowerment Benchmarking Just-in-time (JIT) Taguchi concepts Knowledge of TQM tools
  • 57.
    Continuous Improvement Representscontinual improvement of all processes Involves all operations and work centers including suppliers and customers People, Equipment, Materials, Procedures
  • 58.
    Six Sigma Twomeanings Statistical definition of a process that is 99.9997% capable, 3.4 defects per million opportunities (DPMO) A program designed to reduce defects, lower costs, and improve customer satisfaction
  • 59.
    Six Sigma Twomeanings Statistical definition of a process that is 99.9997% capable, 3.4 defects per million opportunities (DPMO) A program designed to reduce defects, lower costs, and improve customer satisfaction Figure 6.4 Mean Lower limits Upper limits 3.4 defects/million ±6  2,700 defects/million ±3 
  • 60.
    Six Sigma DMAICApproach Define critical outputs and identify gaps for improvement Measure the work and collect process data Analyze the data Improve the process Control the new process to make sure new performance is maintained
  • 61.
    Benchmarking Use internalbenchmarking if you’re big enough Selecting best practices to use as a standard for performance Determine what to benchmark Form a benchmark team Identify benchmarking partners Collect and analyze benchmarking information Take action to match or exceed the benchmark
  • 62.
    Just-in-Time (JIT) Relationshipto quality: JIT cuts the cost of quality JIT improves quality Better quality means less inventory and better, easier-to-employ JIT system
  • 63.
    Just-in-Time (JIT) ‘Pull’ system of production scheduling including supply management Production only when signaled Allows reduced inventory levels Inventory costs money and hides process and material problems Encourages improved process and product quality
  • 64.
    Taguchi Concepts Engineeringand experimental design methods to improve product and process design Identify key component and process variables affecting product variation Taguchi Concepts Quality robustness Quality loss function Target-oriented quality
  • 65.
    Quality Robustness Abilityto produce products uniformly in adverse manufacturing and environmental conditions Remove the effects of adverse conditions Small variations in materials and process do not destroy product quality
  • 66.
    Quality Loss FunctionShows that costs increase as the product moves away from what the customer wants Costs include customer dissatisfaction, warranty and service, internal scrap and repair, and costs to society Traditional conformance specifications are too simplistic Target-oriented quality
  • 67.
    Inspection Involves examiningitems to see if an item is good or defective Detect a defective product Does not correct deficiencies in process or product It is expensive Issues When to inspect Where in process to inspect
  • 68.
    When and Whereto Inspect At the supplier’s plant while the supplier is producing At your facility upon receipt of goods from the supplier Before costly or irreversible processes During the step-by-step production process When production or service is complete Before delivery to your customer At the point of customer contact
  • 69.
    Inspection Many problemsWorker fatigue Measurement error Process variability Cannot inspect quality into a product Robust design, empowered employees, and sound processes are better solutions
  • 70.
    TQM In ServicesService quality is more difficult to measure than the quality of goods Service quality perceptions depend on Intangible differences between products Intangible expectations customers have of those products
  • 71.
    Service Quality TheOperations Manager must recognize: The tangible component of services is important The service process is important The service is judged against the customer’s expectations Exceptions will occur
  • 72.
  • 73.
    Determinants of ServiceQuality Reliability Responsiveness Competence Access Courtesy Communication Credibility Security Understanding/ knowing the customer Tangibles
  • 74.
    Service Recovery StrategyManagers should have a plan for when services fail Marriott’s LEARN routine Listen Empathize Apologize React Notify

Editor's Notes