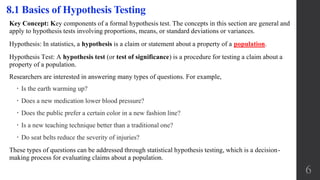
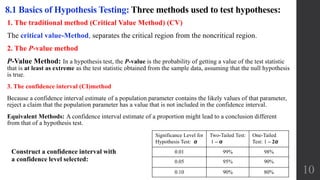
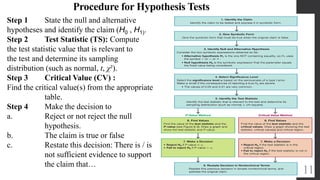
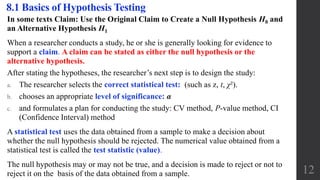
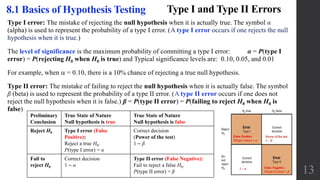
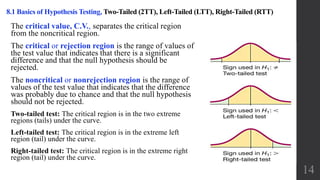
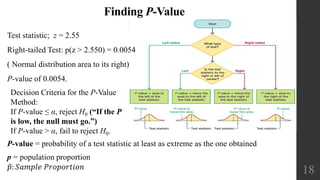
SlideShare a Scribd company logo
Elementary Statistics
Chapter 8:
Hypothesis Testing
8.1 Basics of
Hypothesis Testing
1
Chapter 8: Hypothesis Testing
8.1 Basics of Hypothesis Testing
8.2 Testing a Claim about a Proportion
8.3 Testing a Claim About a Mean
8.4 Testing a Claim About a Standard Deviation or Variance
2
Objectives:
• Understand the definitions used in hypothesis testing.
• State the null and alternative hypotheses.
• State the steps used in hypothesis testing.
• Test proportions, using the z test.
• Test means when  is known, using the z test.
• Test means when  is unknown, using the t test.
• Test variances or standard deviations, using the chi-square test.
• Test hypotheses, using confidence intervals.
Point estimate of p: 𝑝 =
𝑈𝐶𝐿+𝐿𝐶𝐿
2
, UCL: Upper Confidence Limit
Margin of error: 𝐸 =
𝑈𝐶𝐿−𝐿𝐶𝐿
2
, LCL: Lower Confidence Limit
Margin of Error & Confidence Interval for Estimating a Population
Proportion p & Determining Sample Size:
When data from a simple random sample are used to estimate a population
proportion p, the margin of error (maximum error of the estimate ),
denoted by E, is the maximum likely difference (with probability 1 – α, such
as 0.95) between the observed (sample) proportion 𝑝 and the true value of
the population proportion p.
3
ˆ
ˆ ˆ
p E
p E p p E

    2 2
ˆ ˆ ˆ ˆ
ˆ ˆ   
pq pq
p z p p z
n n
 
Recall: 7.1 Estimating a Population Proportion
2
ˆ ˆpq
E z
n

2
2
2
ˆ ˆ( )z pq
n
E


2
2
2
( ) 0.25z
n
E

When no estimate of 𝒑
is known: 𝒑 = 𝒒 =0.5
Determine the sample
size n required to
estimate the value of a
population proportion p
TI Calculator:
Confidence Interval:
proportion
1. Stat
2. Tests
3. 1-prop ZINT
4. Enter: x, n & CL
4
Recall: 7.2 Estimating a Population Mean
Determine the sample size n required to estimate the
value of a population mean µ.
Confidence Interval for Estimating a Population Mean
2
2  
  
 
z
n
E
 
2 2
   
      
   
X z X z
n n
 
 

𝐶𝐼: 𝑥 ± 𝐸 →
2E z
n

 
  
 
2
s
E t
n

 
  
 
2 2
   
      
   
s s
X t X t
n n
 
Confidence Interval for Estimating a Population Mean with σ un Known
Point estimate of µ: 𝑥 =
𝑈𝐶𝐿+𝐿𝐶𝐿
2
, UCL: Upper Confidence Limit
Margin of error: 𝐸 =
𝑈𝐶𝐿−𝐿𝐶𝐿
2
,LCL: Lower Confidence Limit
σ Known
TI Calculator:
Z - interval
1. Stat
2. Tests
3. Z - Interval
4. Enter Data or Stats
( 𝒙 , s & CL)
TI Calculator:
T- Distribution: find the t-score
1. 2nd + VARS
2. invT(
3. 2 entries (Left Area,df)
4. Enter
TI Calculator:
T- interval
1. Stat
2. Tests
3. T - Interval
4. Enter Data or Stats
( 𝒙 , s & CL)
5. Enter
Critical Values of χ² We denote a right-tailed critical value by χR
² and we denote a left-tailed critical value
by χL
². Those critical values can be found by using technology or χ² -Table.
Degrees of Freedom: df = n − 1
As the number of degrees of freedom increases, the chi-square distribution approaches a normal
distribution.
Not symmetric: Confidence interval estimate of σ² does not fit a format of
s² − E < σ² < s² + E, so we must do separate calculations for the upper and lower confidence interval limits.
Critical value of χ² in the body of the table corresponds to an area given in the top row of the table, and
each area in that top row is a cumulative area to the right of the critical value.
5
Recall: 7.3 Estimating a Population Standard Deviation or Variance, Chi-Square Distribution
2 2
2
2 2
right left
( 1) ( 1)
, d.f. = 1
n s n s
n
 
 
  
2 2
2 2
right left
( 1) ( 1)
, d.f. = 1
n s n s
n
 
 
  
Key Concept: Key components of a formal hypothesis test. The concepts in this section are general and
apply to hypothesis tests involving proportions, means, or standard deviations or variances.
Hypothesis: In statistics, a hypothesis is a claim or statement about a property of a population.
Hypothesis Test: A hypothesis test (or test of significance) is a procedure for testing a claim about a
property of a population.
Researchers are interested in answering many types of questions. For example,
 Is the earth warming up?
 Does a new medication lower blood pressure?
 Does the public prefer a certain color in a new fashion line?
 Is a new teaching technique better than a traditional one?
 Do seat belts reduce the severity of injuries?
These types of questions can be addressed through statistical hypothesis testing, which is a decision-
making process for evaluating claims about a population.
8.1 Basics of Hypothesis Testing
6
1009 consumers were asked if they are comfortable with having drones deliver
their purchases, and 54% (or 545) of them responded with “no.” Using p to
denote the proportion of consumers not comfortable with drone deliveries, the
“majority” claim is equivalent to the claim that the proportion is greater than
half, or p > 0.5. The expression p > 0.5 is the symbolic form of the original
claim.
Example 1
The Claim: The population proportion p; p > 0.5.
Among 1009 consumers, how many do we need to get a significantly high number who
are not comfortable with drone delivery?
A result of 506 (or 50.1%) is just barely more than half, so 506 is clearly not
significantly high.
A result of 1006 (or 99.7%) is clearly significantly high.
What about the result of 545 (or 54.0%)?
Is 545 (or 54.0%) significantly high? The method of hypothesis testing allows us to
answer that key question.
7
8.1 Basics of Hypothesis Testing
A statistical hypothesis is a conjecture (assumption) about a population
parameter. This conjecture may or may not be true.
The null hypothesis, symbolized by H0, is a statistical hypothesis that states that
there is no difference between a parameter and a specific value, or that there is
no difference between two parameters.
(It states that the value of a population parameter such as proportion, mean, or
standard deviation is equal to some claimed value.)
The alternative hypothesis, symbolized by H1 , or Ha ,or HA , is a statistical
hypothesis that states the existence of a difference between a parameter and a
specific value, or states that there is a difference between two parameters.
(It states that the parameter has a value that somehow differs from the null
hypothesis. the symbolic form of the alternative hypothesis: <, >, ≠)
8
a. A researcher is interested in
finding out whether a new
medication will have a side
effect on the pulse rate of the
patients who take the
medication. Will the pulse
rate increase, decrease, or
remain unchanged after a
patient takes the medication?
The researcher knows that the
mean pulse rate for the
population under study is 82
beats per minute.
Example 2: Identify the null and alternative Hypotheses.
H0 : 𝜇 = 82 H1 : 𝜇 ≠ 82
This is called a two-tailed
(2TT) hypothesis test.
9
b. A chemist invents
an additive to
increase the life of an
automobile battery.
The mean lifetime of
the automobile
battery without the
additive is 36 months.
H0 : 𝜇 = 36 H1 : 𝜇 > 36
This is called a Right-tailed
(RTT) hypothesis test.
c. A contractor wishes
to lower heating bills
by using a special
type of insulation in
houses. If the average
of the monthly
heating bills is $78,
her hypotheses about
heating costs with the
use of insulation are
H0 : 𝜇 = 78 H1 : 𝜇 < 78
This is called a Left-tailed
(LTT) hypothesis test.
1. The traditional method (Critical Value Method) (CV)
The critical value-Method, separates the critical region from the noncritical region.
2. The P-value method
P-Value Method: In a hypothesis test, the P-value is the probability of getting a value of the test statistic
that is at least as extreme as the test statistic obtained from the sample data, assuming that the null hypothesis
is true.
3. The confidence interval (CI)method
Because a confidence interval estimate of a population parameter contains the likely values of that parameter,
reject a claim that the population parameter has a value that is not included in the confidence interval.
Equivalent Methods: A confidence interval estimate of a proportion might lead to a conclusion different
from that of a hypothesis test.
8.1 Basics of Hypothesis Testing: Three methods used to test hypotheses:
10
Construct a confidence interval with
a confidence level selected:
Significance Level for
Hypothesis Test: α
Two-Tailed Test:
1 – α
One-Tailed
Test: 1 – 2α
0.01 99% 98%
0.05 95% 90%
0.10 90% 80%
Procedure for Hypothesis Tests
11
Step 1 State the null and alternative
hypotheses and identify the claim (H0 , H1).
Step 2 Test Statistic (TS): Compute
the test statistic value that is relevant to
the test and determine its sampling
distribution (such as normal, t, χ²).
Step 3 Critical Value (CV) :
Find the critical value(s) from the appropriate
table.
Step 4 Make the decision to
a. Reject or not reject the null
hypothesis.
b. The claim is true or false
c. Restate this decision: There is / is
not sufficient evidence to support
the claim that…
In some texts Claim: Use the Original Claim to Create a Null Hypothesis H0 and
an Alternative Hypothesis H1
When a researcher conducts a study, he or she is generally looking for evidence to
support a claim. A claim can be stated as either the null hypothesis or the
alternative hypothesis.
After stating the hypotheses, the researcher’s next step is to design the study:
a. The researcher selects the correct statistical test: (such as z, t, χ²).
b. chooses an appropriate level of significance: α
c. and formulates a plan for conducting the study: CV method, P-value method, CI
(Confidence Interval) method
A statistical test uses the data obtained from a sample to make a decision about
whether the null hypothesis should be rejected. The numerical value obtained from a
statistical test is called the test statistic (value).
The null hypothesis may or may not be true, and a decision is made to reject or not to
reject it on the basis of the data obtained from a sample.
8.1 Basics of Hypothesis Testing
12
Type I and Type II Errors
Type I error: The mistake of rejecting the null hypothesis when it is actually true. The symbol α
(alpha) is used to represent the probability of a type I error. (A type I error occurs if one rejects the null
hypothesis when it is true.)
The level of significance is the maximum probability of committing a type I error: α = P(type I
error) = P(rejecting H0 when H0 is true) and Typical significance levels are: 0.10, 0.05, and 0.01
For example, when  = 0.10, there is a 10% chance of rejecting a true null hypothesis.
Type II error: The mistake of failing to reject the null hypothesis when it is actually false. The symbol
β (beta) is used to represent the probability of a type II error. (A type II error occurs if one does not
reject the null hypothesis when it is false.) β = P(type II error) = P(failing to reject H0 when H0 is
false)
13
Preliminary
Conclusion
True State of Nature
Null hypothesis is true
True State of Nature
Null hypothesis is false
Reject H0 Type I error (False
Positive):
Reject a true H0.
P(type I error) = α
Correct decision
(Power of the test)
1 ‒ β
Fail to
reject H0
Correct decision
1 ‒ α
Type II error (False Negative):
Fail to reject a false H0.
P(type II error) = β
8.1 Basics of Hypothesis Testing
The critical value, C.V., separates the critical region
from the noncritical region.
The critical or rejection region is the range of values of
the test value that indicates that there is a significant
difference and that the null hypothesis should be
rejected.
The noncritical or nonrejection region is the range of
values of the test value that indicates that the difference
was probably due to chance and that the null hypothesis
should not be rejected.
Two-tailed test: The critical region is in the two extreme
regions (tails) under the curve.
Left-tailed test: The critical region is in the extreme left
region (tail) under the curve.
Right-tailed test: The critical region is in the extreme right
region (tail) under the curve.
14
8.1 Basics of Hypothesis Testing, Two-Tailed (2TT), Left-Tailed (LTT), Right-Tailed (RTT)
a. Finding the Critical Value for
α = 0.01 (Right-Tailed Test)
b. Finding the Critical Value for
α = 0.01 (Left-Tailed Test)
c. Finding the Critical Value for
α = 0.01 (Two-Tailed Test)
Example 3: z-table
15
z = 2.33 for α = 0.01 (RTT)
Because of symmetry,
z = –2.33 for α = 0.01 (LTT)
z = ±2.575
Find the critical value(s) for each situation and draw the
appropriate figure, showing the critical region.
a. A left-tailed test with α = 0.10.
b. A two-tailed test with α = 0.02.
c. A right-tailed test with α = 0.005.
Example 4: z-table
Solution: z = –1.28
16
Solution: z = 2.575 or 2.58
Solution: z = ± 2.33
Identify the test statistic that is relevant to the test and determine its
sampling distribution (such as z, t, χ²)
17
Parameter
Sampling
Distribution
Requirements Test Statistics
Proportion:
p
Normal (Z) 𝑛𝑝 ≥ 5, & 𝑛𝑞 ≥ 5
𝑍 =
𝑝 − 𝑝
𝑝𝑞/𝑛
Mean: 𝝁 t 𝝈 not known & Normally
Distributed Population or
𝑛 > 30
𝑡 =
𝑥 − 𝜇
𝑠/ 𝑛
Mean: 𝝁 Normal (Z) 𝝈 known & Normally
Distributed Population or
𝑛 > 30
𝑍 =
𝑥 − 𝜇
𝜎/ 𝑛
Standard
Deviation: 𝝈
Or Variance: 𝝈 𝟐
𝝌 𝟐 Normally Distributed
Population 𝜒2
=
(𝑛 − 1)𝑠2
𝜎2
Finding P-Value
18
P-value = probability of a test statistic at least as extreme as the one obtained
p = population proportion
𝑝: 𝑆𝑎𝑚𝑝𝑙𝑒 𝑃𝑟𝑜𝑝𝑜𝑟𝑡𝑖𝑜𝑛
Test statistic; z = 2.55
Right-tailed Test: p(z > 2.550) = 0.0054
( Normal distribution area to its right)
P-value of 0.0054.
Decision Criteria for the P-Value
Method:
If P-value ≤ α, reject H0 (“If the P
is low, the null must go.”)
If P-value > α, fail to reject H0.
Example 6: Describing Type I and Type II Errors
Consider the claim that a medical procedure designed to increase the likelihood of a baby girl is effective, so that
the probability of a baby girl is p > 0.5. Given the following null and alternative hypotheses, write statements
describing a) type I error, and (b) a type II error.
(HINT FOR DESCRIBING TYPE I AND TYPE II ERRORS: Descriptions of a type I error and a
type II error refer to the null hypothesis being true or false, but when wording a statement representing
a type I error or a type II error, be sure that the conclusion addresses the original claim (which may
or may not be the null hypothesis).
H0: p = 0.5
H1: p > 0.5 (original claim that will be addressed in the final conclusion)
19
Solution
a. Type I Error: A type I error is the mistake of rejecting a true null hypothesis, so
the following is a type I error: In reality p = 0.5, but sample evidence leads us to
conclude that p > 0.5. (In this case, a type I error is to conclude that the medical
procedure is effective when in reality it has no effect.)
b. Type II Error: A type II error is the mistake of failing to reject the null hypothesis
when it is false, so the following is a type II error: In reality p > 0.5, but we fail to
support that conclusion. (In this case, a type II error is to conclude that the
medical procedure has no effect, when it really is effective in increasing the
likelihood of a baby girl.)

More Related Content

What's hot

Hypothesis testing
Hypothesis testingHypothesis testing
Hypothesis testing
Rashmi Vaishya
 
Hypothesis testing1
Hypothesis testing1Hypothesis testing1
Hypothesis testing1
HanaaBayomy
 
Statistical inference: Estimation
Statistical inference: EstimationStatistical inference: Estimation
Statistical inference: Estimation
Parag Shah
 
Hypothesis testing
Hypothesis testingHypothesis testing
Hypothesis testing
Madhuranath R
 
Hypothesis
HypothesisHypothesis
Hypothesis
Nilanjan Bhaumik
 
LEVEL OF SIGNIFICANCE.pptx
LEVEL OF SIGNIFICANCE.pptxLEVEL OF SIGNIFICANCE.pptx
LEVEL OF SIGNIFICANCE.pptx
RingoNavarro3
 
Lecture2 hypothesis testing
Lecture2 hypothesis testingLecture2 hypothesis testing
Lecture2 hypothesis testing
o_devinyak
 
Testing of hypotheses
Testing of hypothesesTesting of hypotheses
Testing of hypotheses
RajThakuri
 
T-Test
T-TestT-Test
Statistical Estimation
Statistical Estimation Statistical Estimation
Statistical Estimation
Remyagharishs
 
Hypothesis testing and p values 06
Hypothesis testing and p values  06Hypothesis testing and p values  06
Hypothesis testing and p values 06
DrZahid Khan
 
z-test
z-testz-test
Estimation in statistics
Estimation in statisticsEstimation in statistics
Estimation in statistics
Rabea Jamal
 
Statistical inference
Statistical inferenceStatistical inference
Statistical inferenceJags Jagdish
 
Testing Hypothesis
Testing HypothesisTesting Hypothesis
Testing Hypothesis
Azmi Mohd Tamil
 
One sided or one-tailed tests
One sided or one-tailed testsOne sided or one-tailed tests
One sided or one-tailed testsHasnain Baber
 
Point and Interval Estimation
Point and Interval EstimationPoint and Interval Estimation
Point and Interval EstimationShubham Mehta
 
Hypothesis Testing
Hypothesis TestingHypothesis Testing
Hypothesis Testing
Kalyan Acharjya
 
F test and ANOVA
F test and ANOVAF test and ANOVA
F test and ANOVA
MEENURANJI
 

What's hot (20)

Hypothesis testing
Hypothesis testingHypothesis testing
Hypothesis testing
 
Hypothesis testing1
Hypothesis testing1Hypothesis testing1
Hypothesis testing1
 
Statistical inference: Estimation
Statistical inference: EstimationStatistical inference: Estimation
Statistical inference: Estimation
 
Hypothesis testing
Hypothesis testingHypothesis testing
Hypothesis testing
 
Hypothesis
HypothesisHypothesis
Hypothesis
 
LEVEL OF SIGNIFICANCE.pptx
LEVEL OF SIGNIFICANCE.pptxLEVEL OF SIGNIFICANCE.pptx
LEVEL OF SIGNIFICANCE.pptx
 
Lecture2 hypothesis testing
Lecture2 hypothesis testingLecture2 hypothesis testing
Lecture2 hypothesis testing
 
Testing of hypotheses
Testing of hypothesesTesting of hypotheses
Testing of hypotheses
 
T-Test
T-TestT-Test
T-Test
 
Statistical Estimation
Statistical Estimation Statistical Estimation
Statistical Estimation
 
Hypothesis testing and p values 06
Hypothesis testing and p values  06Hypothesis testing and p values  06
Hypothesis testing and p values 06
 
z-test
z-testz-test
z-test
 
Estimation in statistics
Estimation in statisticsEstimation in statistics
Estimation in statistics
 
Statistical inference
Statistical inferenceStatistical inference
Statistical inference
 
Testing Hypothesis
Testing HypothesisTesting Hypothesis
Testing Hypothesis
 
One sided or one-tailed tests
One sided or one-tailed testsOne sided or one-tailed tests
One sided or one-tailed tests
 
Point and Interval Estimation
Point and Interval EstimationPoint and Interval Estimation
Point and Interval Estimation
 
Hypothesis Testing
Hypothesis TestingHypothesis Testing
Hypothesis Testing
 
Hypothesis Testing
Hypothesis TestingHypothesis Testing
Hypothesis Testing
 
F test and ANOVA
F test and ANOVAF test and ANOVA
F test and ANOVA
 

Similar to Basics of Hypothesis Testing

Testing a claim about a mean
Testing a claim about a mean  Testing a claim about a mean
Testing a claim about a mean
Long Beach City College
 
Two Proportions
Two Proportions  Two Proportions
Two Proportions
Long Beach City College
 
Basics of Hypothesis Testing
Basics of Hypothesis TestingBasics of Hypothesis Testing
Basics of Hypothesis Testing
Long Beach City College
 
Unit 3
Unit 3Unit 3
Testing a claim about a standard deviation or variance
Testing a claim about a standard deviation or variance  Testing a claim about a standard deviation or variance
Testing a claim about a standard deviation or variance
Long Beach City College
 
Day 3 SPSS
Day 3 SPSSDay 3 SPSS
Day 3 SPSS
abir hossain
 
Testing a Claim About a Mean
Testing a Claim About a MeanTesting a Claim About a Mean
Testing a Claim About a Mean
Long Beach City College
 
Data Science : Unit-I -Hypothesis and Inferences.pptx
Data Science : Unit-I -Hypothesis and Inferences.pptxData Science : Unit-I -Hypothesis and Inferences.pptx
Data Science : Unit-I -Hypothesis and Inferences.pptx
subhashchandra197
 
Int 150 The Moral Instinct”1. Most cultures agree that abus.docx
Int 150 The Moral Instinct”1.   Most cultures agree that abus.docxInt 150 The Moral Instinct”1.   Most cultures agree that abus.docx
Int 150 The Moral Instinct”1. Most cultures agree that abus.docx
mariuse18nolet
 
Testing of hypothesis
Testing of hypothesisTesting of hypothesis
Testing of hypothesis
Sanjay Basukala
 
Hypothesis testing.pdf
Hypothesis testing.pdfHypothesis testing.pdf
Hypothesis testing.pdf
KingslyNdanga2
 
STATISTIC ESTIMATION
STATISTIC ESTIMATIONSTATISTIC ESTIMATION
STATISTIC ESTIMATION
Smruti Ranjan Parida
 
Testing of Hypothesis, p-value, Gaussian distribution, null hypothesis
Testing of Hypothesis, p-value, Gaussian distribution, null hypothesisTesting of Hypothesis, p-value, Gaussian distribution, null hypothesis
Testing of Hypothesis, p-value, Gaussian distribution, null hypothesis
svmmcradonco1
 
hypothesis test
 hypothesis test hypothesis test
hypothesis test
Unsa Shakir
 
Day-2_Presentation for SPSS parametric workshop.pptx
Day-2_Presentation for SPSS parametric workshop.pptxDay-2_Presentation for SPSS parametric workshop.pptx
Day-2_Presentation for SPSS parametric workshop.pptx
rjaisankar
 
7 hypothesis testing
7 hypothesis testing7 hypothesis testing
7 hypothesis testing
AASHISHSHRIVASTAV1
 
Testing a claim about a proportion
Testing a claim about a proportion  Testing a claim about a proportion
Testing a claim about a proportion
Long Beach City College
 
Chi-square IMP.ppt
Chi-square IMP.pptChi-square IMP.ppt
Chi-square IMP.ppt
Shivraj Nile
 
Estimation and hypothesis testing 1 (graduate statistics2)
Estimation and hypothesis testing 1 (graduate statistics2)Estimation and hypothesis testing 1 (graduate statistics2)
Estimation and hypothesis testing 1 (graduate statistics2)Harve Abella
 

Similar to Basics of Hypothesis Testing (20)

Testing a claim about a mean
Testing a claim about a mean  Testing a claim about a mean
Testing a claim about a mean
 
Two Proportions
Two Proportions  Two Proportions
Two Proportions
 
Basics of Hypothesis Testing
Basics of Hypothesis TestingBasics of Hypothesis Testing
Basics of Hypothesis Testing
 
Unit 3
Unit 3Unit 3
Unit 3
 
Testing a claim about a standard deviation or variance
Testing a claim about a standard deviation or variance  Testing a claim about a standard deviation or variance
Testing a claim about a standard deviation or variance
 
Day 3 SPSS
Day 3 SPSSDay 3 SPSS
Day 3 SPSS
 
Testing a Claim About a Mean
Testing a Claim About a MeanTesting a Claim About a Mean
Testing a Claim About a Mean
 
Sampling theory
Sampling theorySampling theory
Sampling theory
 
Data Science : Unit-I -Hypothesis and Inferences.pptx
Data Science : Unit-I -Hypothesis and Inferences.pptxData Science : Unit-I -Hypothesis and Inferences.pptx
Data Science : Unit-I -Hypothesis and Inferences.pptx
 
Int 150 The Moral Instinct”1. Most cultures agree that abus.docx
Int 150 The Moral Instinct”1.   Most cultures agree that abus.docxInt 150 The Moral Instinct”1.   Most cultures agree that abus.docx
Int 150 The Moral Instinct”1. Most cultures agree that abus.docx
 
Testing of hypothesis
Testing of hypothesisTesting of hypothesis
Testing of hypothesis
 
Hypothesis testing.pdf
Hypothesis testing.pdfHypothesis testing.pdf
Hypothesis testing.pdf
 
STATISTIC ESTIMATION
STATISTIC ESTIMATIONSTATISTIC ESTIMATION
STATISTIC ESTIMATION
 
Testing of Hypothesis, p-value, Gaussian distribution, null hypothesis
Testing of Hypothesis, p-value, Gaussian distribution, null hypothesisTesting of Hypothesis, p-value, Gaussian distribution, null hypothesis
Testing of Hypothesis, p-value, Gaussian distribution, null hypothesis
 
hypothesis test
 hypothesis test hypothesis test
hypothesis test
 
Day-2_Presentation for SPSS parametric workshop.pptx
Day-2_Presentation for SPSS parametric workshop.pptxDay-2_Presentation for SPSS parametric workshop.pptx
Day-2_Presentation for SPSS parametric workshop.pptx
 
7 hypothesis testing
7 hypothesis testing7 hypothesis testing
7 hypothesis testing
 
Testing a claim about a proportion
Testing a claim about a proportion  Testing a claim about a proportion
Testing a claim about a proportion
 
Chi-square IMP.ppt
Chi-square IMP.pptChi-square IMP.ppt
Chi-square IMP.ppt
 
Estimation and hypothesis testing 1 (graduate statistics2)
Estimation and hypothesis testing 1 (graduate statistics2)Estimation and hypothesis testing 1 (graduate statistics2)
Estimation and hypothesis testing 1 (graduate statistics2)
 

More from Long Beach City College

Practice test ch 9 inferences from two samples
Practice test ch 9 inferences from two samplesPractice test ch 9 inferences from two samples
Practice test ch 9 inferences from two samples
Long Beach City College
 
Practice Test Ch 8 Hypothesis Testing
Practice Test Ch 8 Hypothesis TestingPractice Test Ch 8 Hypothesis Testing
Practice Test Ch 8 Hypothesis Testing
Long Beach City College
 
Solution to the practice test ch 10 correlation reg ch 11 gof ch12 anova
Solution to the practice test ch 10 correlation reg ch 11 gof ch12 anovaSolution to the practice test ch 10 correlation reg ch 11 gof ch12 anova
Solution to the practice test ch 10 correlation reg ch 11 gof ch12 anova
Long Beach City College
 
Practice test ch 10 correlation reg ch 11 gof ch12 anova
Practice test ch 10 correlation reg ch 11 gof ch12 anovaPractice test ch 10 correlation reg ch 11 gof ch12 anova
Practice test ch 10 correlation reg ch 11 gof ch12 anova
Long Beach City College
 
Practice test ch 8 hypothesis testing ch 9 two populations
Practice test ch 8 hypothesis testing ch 9 two populationsPractice test ch 8 hypothesis testing ch 9 two populations
Practice test ch 8 hypothesis testing ch 9 two populations
Long Beach City College
 
Solution to the practice test ch 8 hypothesis testing ch 9 two populations
Solution to the practice test ch 8 hypothesis testing ch 9 two populationsSolution to the practice test ch 8 hypothesis testing ch 9 two populations
Solution to the practice test ch 8 hypothesis testing ch 9 two populations
Long Beach City College
 
Solution to the Practice Test 3A, Chapter 6 Normal Probability Distribution
Solution to the Practice Test 3A, Chapter 6 Normal Probability DistributionSolution to the Practice Test 3A, Chapter 6 Normal Probability Distribution
Solution to the Practice Test 3A, Chapter 6 Normal Probability Distribution
Long Beach City College
 
Practice Test Chapter 6 (Normal Probability Distributions)
Practice Test Chapter 6 (Normal Probability Distributions)Practice Test Chapter 6 (Normal Probability Distributions)
Practice Test Chapter 6 (Normal Probability Distributions)
Long Beach City College
 
Practice Test 2 Solutions
Practice Test 2  SolutionsPractice Test 2  Solutions
Practice Test 2 Solutions
Long Beach City College
 
Practice Test 2 Probability
Practice Test 2 ProbabilityPractice Test 2 Probability
Practice Test 2 Probability
Long Beach City College
 
Practice Test 1 solutions
Practice Test 1 solutions  Practice Test 1 solutions
Practice Test 1 solutions
Long Beach City College
 
Practice Test 1
Practice Test 1Practice Test 1
Practice Test 1
Long Beach City College
 
Stat sample test ch 12 solution
Stat sample test ch 12 solutionStat sample test ch 12 solution
Stat sample test ch 12 solution
Long Beach City College
 
Stat sample test ch 12
Stat sample test ch 12Stat sample test ch 12
Stat sample test ch 12
Long Beach City College
 
Stat sample test ch 11
Stat sample test ch 11Stat sample test ch 11
Stat sample test ch 11
Long Beach City College
 
Stat sample test ch 10
Stat sample test ch 10Stat sample test ch 10
Stat sample test ch 10
Long Beach City College
 
Two-Way ANOVA
Two-Way ANOVATwo-Way ANOVA
One-Way ANOVA
One-Way ANOVAOne-Way ANOVA
Contingency Tables
Contingency TablesContingency Tables
Contingency Tables
Long Beach City College
 
Goodness of Fit Notation
Goodness of Fit NotationGoodness of Fit Notation
Goodness of Fit Notation
Long Beach City College
 

More from Long Beach City College (20)

Practice test ch 9 inferences from two samples
Practice test ch 9 inferences from two samplesPractice test ch 9 inferences from two samples
Practice test ch 9 inferences from two samples
 
Practice Test Ch 8 Hypothesis Testing
Practice Test Ch 8 Hypothesis TestingPractice Test Ch 8 Hypothesis Testing
Practice Test Ch 8 Hypothesis Testing
 
Solution to the practice test ch 10 correlation reg ch 11 gof ch12 anova
Solution to the practice test ch 10 correlation reg ch 11 gof ch12 anovaSolution to the practice test ch 10 correlation reg ch 11 gof ch12 anova
Solution to the practice test ch 10 correlation reg ch 11 gof ch12 anova
 
Practice test ch 10 correlation reg ch 11 gof ch12 anova
Practice test ch 10 correlation reg ch 11 gof ch12 anovaPractice test ch 10 correlation reg ch 11 gof ch12 anova
Practice test ch 10 correlation reg ch 11 gof ch12 anova
 
Practice test ch 8 hypothesis testing ch 9 two populations
Practice test ch 8 hypothesis testing ch 9 two populationsPractice test ch 8 hypothesis testing ch 9 two populations
Practice test ch 8 hypothesis testing ch 9 two populations
 
Solution to the practice test ch 8 hypothesis testing ch 9 two populations
Solution to the practice test ch 8 hypothesis testing ch 9 two populationsSolution to the practice test ch 8 hypothesis testing ch 9 two populations
Solution to the practice test ch 8 hypothesis testing ch 9 two populations
 
Solution to the Practice Test 3A, Chapter 6 Normal Probability Distribution
Solution to the Practice Test 3A, Chapter 6 Normal Probability DistributionSolution to the Practice Test 3A, Chapter 6 Normal Probability Distribution
Solution to the Practice Test 3A, Chapter 6 Normal Probability Distribution
 
Practice Test Chapter 6 (Normal Probability Distributions)
Practice Test Chapter 6 (Normal Probability Distributions)Practice Test Chapter 6 (Normal Probability Distributions)
Practice Test Chapter 6 (Normal Probability Distributions)
 
Practice Test 2 Solutions
Practice Test 2  SolutionsPractice Test 2  Solutions
Practice Test 2 Solutions
 
Practice Test 2 Probability
Practice Test 2 ProbabilityPractice Test 2 Probability
Practice Test 2 Probability
 
Practice Test 1 solutions
Practice Test 1 solutions  Practice Test 1 solutions
Practice Test 1 solutions
 
Practice Test 1
Practice Test 1Practice Test 1
Practice Test 1
 
Stat sample test ch 12 solution
Stat sample test ch 12 solutionStat sample test ch 12 solution
Stat sample test ch 12 solution
 
Stat sample test ch 12
Stat sample test ch 12Stat sample test ch 12
Stat sample test ch 12
 
Stat sample test ch 11
Stat sample test ch 11Stat sample test ch 11
Stat sample test ch 11
 
Stat sample test ch 10
Stat sample test ch 10Stat sample test ch 10
Stat sample test ch 10
 
Two-Way ANOVA
Two-Way ANOVATwo-Way ANOVA
Two-Way ANOVA
 
One-Way ANOVA
One-Way ANOVAOne-Way ANOVA
One-Way ANOVA
 
Contingency Tables
Contingency TablesContingency Tables
Contingency Tables
 
Goodness of Fit Notation
Goodness of Fit NotationGoodness of Fit Notation
Goodness of Fit Notation
 

Recently uploaded

Acetabularia Information For Class 9 .docx
Acetabularia Information For Class 9  .docxAcetabularia Information For Class 9  .docx
Acetabularia Information For Class 9 .docx
vaibhavrinwa19
 
Model Attribute Check Company Auto Property
Model Attribute  Check Company Auto PropertyModel Attribute  Check Company Auto Property
Model Attribute Check Company Auto Property
Celine George
 
Synthetic Fiber Construction in lab .pptx
Synthetic Fiber Construction in lab .pptxSynthetic Fiber Construction in lab .pptx
Synthetic Fiber Construction in lab .pptx
Pavel ( NSTU)
 
BÀI TẬP BỔ TRỢ TIẾNG ANH GLOBAL SUCCESS LỚP 3 - CẢ NĂM (CÓ FILE NGHE VÀ ĐÁP Á...
BÀI TẬP BỔ TRỢ TIẾNG ANH GLOBAL SUCCESS LỚP 3 - CẢ NĂM (CÓ FILE NGHE VÀ ĐÁP Á...BÀI TẬP BỔ TRỢ TIẾNG ANH GLOBAL SUCCESS LỚP 3 - CẢ NĂM (CÓ FILE NGHE VÀ ĐÁP Á...
BÀI TẬP BỔ TRỢ TIẾNG ANH GLOBAL SUCCESS LỚP 3 - CẢ NĂM (CÓ FILE NGHE VÀ ĐÁP Á...
Nguyen Thanh Tu Collection
 
Overview on Edible Vaccine: Pros & Cons with Mechanism
Overview on Edible Vaccine: Pros & Cons with MechanismOverview on Edible Vaccine: Pros & Cons with Mechanism
Overview on Edible Vaccine: Pros & Cons with Mechanism
DeeptiGupta154
 
CACJapan - GROUP Presentation 1- Wk 4.pdf
CACJapan - GROUP Presentation 1- Wk 4.pdfCACJapan - GROUP Presentation 1- Wk 4.pdf
CACJapan - GROUP Presentation 1- Wk 4.pdf
camakaiclarkmusic
 
JEE1_This_section_contains_FOUR_ questions
JEE1_This_section_contains_FOUR_ questionsJEE1_This_section_contains_FOUR_ questions
JEE1_This_section_contains_FOUR_ questions
ShivajiThube2
 
MASS MEDIA STUDIES-835-CLASS XI Resource Material.pdf
MASS MEDIA STUDIES-835-CLASS XI Resource Material.pdfMASS MEDIA STUDIES-835-CLASS XI Resource Material.pdf
MASS MEDIA STUDIES-835-CLASS XI Resource Material.pdf
goswamiyash170123
 
STRAND 3 HYGIENIC PRACTICES.pptx GRADE 7 CBC
STRAND 3 HYGIENIC PRACTICES.pptx GRADE 7 CBCSTRAND 3 HYGIENIC PRACTICES.pptx GRADE 7 CBC
STRAND 3 HYGIENIC PRACTICES.pptx GRADE 7 CBC
kimdan468
 
How libraries can support authors with open access requirements for UKRI fund...
How libraries can support authors with open access requirements for UKRI fund...How libraries can support authors with open access requirements for UKRI fund...
How libraries can support authors with open access requirements for UKRI fund...
Jisc
 
A Strategic Approach: GenAI in Education
A Strategic Approach: GenAI in EducationA Strategic Approach: GenAI in Education
A Strategic Approach: GenAI in Education
Peter Windle
 
Mule 4.6 & Java 17 Upgrade | MuleSoft Mysore Meetup #46
Mule 4.6 & Java 17 Upgrade | MuleSoft Mysore Meetup #46Mule 4.6 & Java 17 Upgrade | MuleSoft Mysore Meetup #46
Mule 4.6 & Java 17 Upgrade | MuleSoft Mysore Meetup #46
MysoreMuleSoftMeetup
 
Unit 8 - Information and Communication Technology (Paper I).pdf
Unit 8 - Information and Communication Technology (Paper I).pdfUnit 8 - Information and Communication Technology (Paper I).pdf
Unit 8 - Information and Communication Technology (Paper I).pdf
Thiyagu K
 
special B.ed 2nd year old paper_20240531.pdf
special B.ed 2nd year old paper_20240531.pdfspecial B.ed 2nd year old paper_20240531.pdf
special B.ed 2nd year old paper_20240531.pdf
Special education needs
 
Thesis Statement for students diagnonsed withADHD.ppt
Thesis Statement for students diagnonsed withADHD.pptThesis Statement for students diagnonsed withADHD.ppt
Thesis Statement for students diagnonsed withADHD.ppt
EverAndrsGuerraGuerr
 
1.4 modern child centered education - mahatma gandhi-2.pptx
1.4 modern child centered education - mahatma gandhi-2.pptx1.4 modern child centered education - mahatma gandhi-2.pptx
1.4 modern child centered education - mahatma gandhi-2.pptx
JosvitaDsouza2
 
The Challenger.pdf DNHS Official Publication
The Challenger.pdf DNHS Official PublicationThe Challenger.pdf DNHS Official Publication
The Challenger.pdf DNHS Official Publication
Delapenabediema
 
Francesca Gottschalk - How can education support child empowerment.pptx
Francesca Gottschalk - How can education support child empowerment.pptxFrancesca Gottschalk - How can education support child empowerment.pptx
Francesca Gottschalk - How can education support child empowerment.pptx
EduSkills OECD
 
Advantages and Disadvantages of CMS from an SEO Perspective
Advantages and Disadvantages of CMS from an SEO PerspectiveAdvantages and Disadvantages of CMS from an SEO Perspective
Advantages and Disadvantages of CMS from an SEO Perspective
Krisztián Száraz
 
A Survey of Techniques for Maximizing LLM Performance.pptx
A Survey of Techniques for Maximizing LLM Performance.pptxA Survey of Techniques for Maximizing LLM Performance.pptx
A Survey of Techniques for Maximizing LLM Performance.pptx
thanhdowork
 

Recently uploaded (20)

Acetabularia Information For Class 9 .docx
Acetabularia Information For Class 9  .docxAcetabularia Information For Class 9  .docx
Acetabularia Information For Class 9 .docx
 
Model Attribute Check Company Auto Property
Model Attribute  Check Company Auto PropertyModel Attribute  Check Company Auto Property
Model Attribute Check Company Auto Property
 
Synthetic Fiber Construction in lab .pptx
Synthetic Fiber Construction in lab .pptxSynthetic Fiber Construction in lab .pptx
Synthetic Fiber Construction in lab .pptx
 
BÀI TẬP BỔ TRỢ TIẾNG ANH GLOBAL SUCCESS LỚP 3 - CẢ NĂM (CÓ FILE NGHE VÀ ĐÁP Á...
BÀI TẬP BỔ TRỢ TIẾNG ANH GLOBAL SUCCESS LỚP 3 - CẢ NĂM (CÓ FILE NGHE VÀ ĐÁP Á...BÀI TẬP BỔ TRỢ TIẾNG ANH GLOBAL SUCCESS LỚP 3 - CẢ NĂM (CÓ FILE NGHE VÀ ĐÁP Á...
BÀI TẬP BỔ TRỢ TIẾNG ANH GLOBAL SUCCESS LỚP 3 - CẢ NĂM (CÓ FILE NGHE VÀ ĐÁP Á...
 
Overview on Edible Vaccine: Pros & Cons with Mechanism
Overview on Edible Vaccine: Pros & Cons with MechanismOverview on Edible Vaccine: Pros & Cons with Mechanism
Overview on Edible Vaccine: Pros & Cons with Mechanism
 
CACJapan - GROUP Presentation 1- Wk 4.pdf
CACJapan - GROUP Presentation 1- Wk 4.pdfCACJapan - GROUP Presentation 1- Wk 4.pdf
CACJapan - GROUP Presentation 1- Wk 4.pdf
 
JEE1_This_section_contains_FOUR_ questions
JEE1_This_section_contains_FOUR_ questionsJEE1_This_section_contains_FOUR_ questions
JEE1_This_section_contains_FOUR_ questions
 
MASS MEDIA STUDIES-835-CLASS XI Resource Material.pdf
MASS MEDIA STUDIES-835-CLASS XI Resource Material.pdfMASS MEDIA STUDIES-835-CLASS XI Resource Material.pdf
MASS MEDIA STUDIES-835-CLASS XI Resource Material.pdf
 
STRAND 3 HYGIENIC PRACTICES.pptx GRADE 7 CBC
STRAND 3 HYGIENIC PRACTICES.pptx GRADE 7 CBCSTRAND 3 HYGIENIC PRACTICES.pptx GRADE 7 CBC
STRAND 3 HYGIENIC PRACTICES.pptx GRADE 7 CBC
 
How libraries can support authors with open access requirements for UKRI fund...
How libraries can support authors with open access requirements for UKRI fund...How libraries can support authors with open access requirements for UKRI fund...
How libraries can support authors with open access requirements for UKRI fund...
 
A Strategic Approach: GenAI in Education
A Strategic Approach: GenAI in EducationA Strategic Approach: GenAI in Education
A Strategic Approach: GenAI in Education
 
Mule 4.6 & Java 17 Upgrade | MuleSoft Mysore Meetup #46
Mule 4.6 & Java 17 Upgrade | MuleSoft Mysore Meetup #46Mule 4.6 & Java 17 Upgrade | MuleSoft Mysore Meetup #46
Mule 4.6 & Java 17 Upgrade | MuleSoft Mysore Meetup #46
 
Unit 8 - Information and Communication Technology (Paper I).pdf
Unit 8 - Information and Communication Technology (Paper I).pdfUnit 8 - Information and Communication Technology (Paper I).pdf
Unit 8 - Information and Communication Technology (Paper I).pdf
 
special B.ed 2nd year old paper_20240531.pdf
special B.ed 2nd year old paper_20240531.pdfspecial B.ed 2nd year old paper_20240531.pdf
special B.ed 2nd year old paper_20240531.pdf
 
Thesis Statement for students diagnonsed withADHD.ppt
Thesis Statement for students diagnonsed withADHD.pptThesis Statement for students diagnonsed withADHD.ppt
Thesis Statement for students diagnonsed withADHD.ppt
 
1.4 modern child centered education - mahatma gandhi-2.pptx
1.4 modern child centered education - mahatma gandhi-2.pptx1.4 modern child centered education - mahatma gandhi-2.pptx
1.4 modern child centered education - mahatma gandhi-2.pptx
 
The Challenger.pdf DNHS Official Publication
The Challenger.pdf DNHS Official PublicationThe Challenger.pdf DNHS Official Publication
The Challenger.pdf DNHS Official Publication
 
Francesca Gottschalk - How can education support child empowerment.pptx
Francesca Gottschalk - How can education support child empowerment.pptxFrancesca Gottschalk - How can education support child empowerment.pptx
Francesca Gottschalk - How can education support child empowerment.pptx
 
Advantages and Disadvantages of CMS from an SEO Perspective
Advantages and Disadvantages of CMS from an SEO PerspectiveAdvantages and Disadvantages of CMS from an SEO Perspective
Advantages and Disadvantages of CMS from an SEO Perspective
 
A Survey of Techniques for Maximizing LLM Performance.pptx
A Survey of Techniques for Maximizing LLM Performance.pptxA Survey of Techniques for Maximizing LLM Performance.pptx
A Survey of Techniques for Maximizing LLM Performance.pptx
 

Basics of Hypothesis Testing

  • 1. Elementary Statistics Chapter 8: Hypothesis Testing 8.1 Basics of Hypothesis Testing 1
  • 2. Chapter 8: Hypothesis Testing 8.1 Basics of Hypothesis Testing 8.2 Testing a Claim about a Proportion 8.3 Testing a Claim About a Mean 8.4 Testing a Claim About a Standard Deviation or Variance 2 Objectives: • Understand the definitions used in hypothesis testing. • State the null and alternative hypotheses. • State the steps used in hypothesis testing. • Test proportions, using the z test. • Test means when  is known, using the z test. • Test means when  is unknown, using the t test. • Test variances or standard deviations, using the chi-square test. • Test hypotheses, using confidence intervals.
  • 3. Point estimate of p: 𝑝 = 𝑈𝐶𝐿+𝐿𝐶𝐿 2 , UCL: Upper Confidence Limit Margin of error: 𝐸 = 𝑈𝐶𝐿−𝐿𝐶𝐿 2 , LCL: Lower Confidence Limit Margin of Error & Confidence Interval for Estimating a Population Proportion p & Determining Sample Size: When data from a simple random sample are used to estimate a population proportion p, the margin of error (maximum error of the estimate ), denoted by E, is the maximum likely difference (with probability 1 – α, such as 0.95) between the observed (sample) proportion 𝑝 and the true value of the population proportion p. 3 ˆ ˆ ˆ p E p E p p E      2 2 ˆ ˆ ˆ ˆ ˆ ˆ    pq pq p z p p z n n   Recall: 7.1 Estimating a Population Proportion 2 ˆ ˆpq E z n  2 2 2 ˆ ˆ( )z pq n E   2 2 2 ( ) 0.25z n E  When no estimate of 𝒑 is known: 𝒑 = 𝒒 =0.5 Determine the sample size n required to estimate the value of a population proportion p TI Calculator: Confidence Interval: proportion 1. Stat 2. Tests 3. 1-prop ZINT 4. Enter: x, n & CL
  • 4. 4 Recall: 7.2 Estimating a Population Mean Determine the sample size n required to estimate the value of a population mean µ. Confidence Interval for Estimating a Population Mean 2 2        z n E   2 2                X z X z n n      𝐶𝐼: 𝑥 ± 𝐸 → 2E z n         2 s E t n         2 2                s s X t X t n n   Confidence Interval for Estimating a Population Mean with σ un Known Point estimate of µ: 𝑥 = 𝑈𝐶𝐿+𝐿𝐶𝐿 2 , UCL: Upper Confidence Limit Margin of error: 𝐸 = 𝑈𝐶𝐿−𝐿𝐶𝐿 2 ,LCL: Lower Confidence Limit σ Known TI Calculator: Z - interval 1. Stat 2. Tests 3. Z - Interval 4. Enter Data or Stats ( 𝒙 , s & CL) TI Calculator: T- Distribution: find the t-score 1. 2nd + VARS 2. invT( 3. 2 entries (Left Area,df) 4. Enter TI Calculator: T- interval 1. Stat 2. Tests 3. T - Interval 4. Enter Data or Stats ( 𝒙 , s & CL) 5. Enter
  • 5. Critical Values of χ² We denote a right-tailed critical value by χR ² and we denote a left-tailed critical value by χL ². Those critical values can be found by using technology or χ² -Table. Degrees of Freedom: df = n − 1 As the number of degrees of freedom increases, the chi-square distribution approaches a normal distribution. Not symmetric: Confidence interval estimate of σ² does not fit a format of s² − E < σ² < s² + E, so we must do separate calculations for the upper and lower confidence interval limits. Critical value of χ² in the body of the table corresponds to an area given in the top row of the table, and each area in that top row is a cumulative area to the right of the critical value. 5 Recall: 7.3 Estimating a Population Standard Deviation or Variance, Chi-Square Distribution 2 2 2 2 2 right left ( 1) ( 1) , d.f. = 1 n s n s n        2 2 2 2 right left ( 1) ( 1) , d.f. = 1 n s n s n       
  • 6. Key Concept: Key components of a formal hypothesis test. The concepts in this section are general and apply to hypothesis tests involving proportions, means, or standard deviations or variances. Hypothesis: In statistics, a hypothesis is a claim or statement about a property of a population. Hypothesis Test: A hypothesis test (or test of significance) is a procedure for testing a claim about a property of a population. Researchers are interested in answering many types of questions. For example,  Is the earth warming up?  Does a new medication lower blood pressure?  Does the public prefer a certain color in a new fashion line?  Is a new teaching technique better than a traditional one?  Do seat belts reduce the severity of injuries? These types of questions can be addressed through statistical hypothesis testing, which is a decision- making process for evaluating claims about a population. 8.1 Basics of Hypothesis Testing 6
  • 7. 1009 consumers were asked if they are comfortable with having drones deliver their purchases, and 54% (or 545) of them responded with “no.” Using p to denote the proportion of consumers not comfortable with drone deliveries, the “majority” claim is equivalent to the claim that the proportion is greater than half, or p > 0.5. The expression p > 0.5 is the symbolic form of the original claim. Example 1 The Claim: The population proportion p; p > 0.5. Among 1009 consumers, how many do we need to get a significantly high number who are not comfortable with drone delivery? A result of 506 (or 50.1%) is just barely more than half, so 506 is clearly not significantly high. A result of 1006 (or 99.7%) is clearly significantly high. What about the result of 545 (or 54.0%)? Is 545 (or 54.0%) significantly high? The method of hypothesis testing allows us to answer that key question. 7
  • 8. 8.1 Basics of Hypothesis Testing A statistical hypothesis is a conjecture (assumption) about a population parameter. This conjecture may or may not be true. The null hypothesis, symbolized by H0, is a statistical hypothesis that states that there is no difference between a parameter and a specific value, or that there is no difference between two parameters. (It states that the value of a population parameter such as proportion, mean, or standard deviation is equal to some claimed value.) The alternative hypothesis, symbolized by H1 , or Ha ,or HA , is a statistical hypothesis that states the existence of a difference between a parameter and a specific value, or states that there is a difference between two parameters. (It states that the parameter has a value that somehow differs from the null hypothesis. the symbolic form of the alternative hypothesis: <, >, ≠) 8
  • 9. a. A researcher is interested in finding out whether a new medication will have a side effect on the pulse rate of the patients who take the medication. Will the pulse rate increase, decrease, or remain unchanged after a patient takes the medication? The researcher knows that the mean pulse rate for the population under study is 82 beats per minute. Example 2: Identify the null and alternative Hypotheses. H0 : 𝜇 = 82 H1 : 𝜇 ≠ 82 This is called a two-tailed (2TT) hypothesis test. 9 b. A chemist invents an additive to increase the life of an automobile battery. The mean lifetime of the automobile battery without the additive is 36 months. H0 : 𝜇 = 36 H1 : 𝜇 > 36 This is called a Right-tailed (RTT) hypothesis test. c. A contractor wishes to lower heating bills by using a special type of insulation in houses. If the average of the monthly heating bills is $78, her hypotheses about heating costs with the use of insulation are H0 : 𝜇 = 78 H1 : 𝜇 < 78 This is called a Left-tailed (LTT) hypothesis test.
  • 10. 1. The traditional method (Critical Value Method) (CV) The critical value-Method, separates the critical region from the noncritical region. 2. The P-value method P-Value Method: In a hypothesis test, the P-value is the probability of getting a value of the test statistic that is at least as extreme as the test statistic obtained from the sample data, assuming that the null hypothesis is true. 3. The confidence interval (CI)method Because a confidence interval estimate of a population parameter contains the likely values of that parameter, reject a claim that the population parameter has a value that is not included in the confidence interval. Equivalent Methods: A confidence interval estimate of a proportion might lead to a conclusion different from that of a hypothesis test. 8.1 Basics of Hypothesis Testing: Three methods used to test hypotheses: 10 Construct a confidence interval with a confidence level selected: Significance Level for Hypothesis Test: α Two-Tailed Test: 1 – α One-Tailed Test: 1 – 2α 0.01 99% 98% 0.05 95% 90% 0.10 90% 80%
  • 11. Procedure for Hypothesis Tests 11 Step 1 State the null and alternative hypotheses and identify the claim (H0 , H1). Step 2 Test Statistic (TS): Compute the test statistic value that is relevant to the test and determine its sampling distribution (such as normal, t, χ²). Step 3 Critical Value (CV) : Find the critical value(s) from the appropriate table. Step 4 Make the decision to a. Reject or not reject the null hypothesis. b. The claim is true or false c. Restate this decision: There is / is not sufficient evidence to support the claim that…
  • 12. In some texts Claim: Use the Original Claim to Create a Null Hypothesis H0 and an Alternative Hypothesis H1 When a researcher conducts a study, he or she is generally looking for evidence to support a claim. A claim can be stated as either the null hypothesis or the alternative hypothesis. After stating the hypotheses, the researcher’s next step is to design the study: a. The researcher selects the correct statistical test: (such as z, t, χ²). b. chooses an appropriate level of significance: α c. and formulates a plan for conducting the study: CV method, P-value method, CI (Confidence Interval) method A statistical test uses the data obtained from a sample to make a decision about whether the null hypothesis should be rejected. The numerical value obtained from a statistical test is called the test statistic (value). The null hypothesis may or may not be true, and a decision is made to reject or not to reject it on the basis of the data obtained from a sample. 8.1 Basics of Hypothesis Testing 12
  • 13. Type I and Type II Errors Type I error: The mistake of rejecting the null hypothesis when it is actually true. The symbol α (alpha) is used to represent the probability of a type I error. (A type I error occurs if one rejects the null hypothesis when it is true.) The level of significance is the maximum probability of committing a type I error: α = P(type I error) = P(rejecting H0 when H0 is true) and Typical significance levels are: 0.10, 0.05, and 0.01 For example, when  = 0.10, there is a 10% chance of rejecting a true null hypothesis. Type II error: The mistake of failing to reject the null hypothesis when it is actually false. The symbol β (beta) is used to represent the probability of a type II error. (A type II error occurs if one does not reject the null hypothesis when it is false.) β = P(type II error) = P(failing to reject H0 when H0 is false) 13 Preliminary Conclusion True State of Nature Null hypothesis is true True State of Nature Null hypothesis is false Reject H0 Type I error (False Positive): Reject a true H0. P(type I error) = α Correct decision (Power of the test) 1 ‒ β Fail to reject H0 Correct decision 1 ‒ α Type II error (False Negative): Fail to reject a false H0. P(type II error) = β 8.1 Basics of Hypothesis Testing
  • 14. The critical value, C.V., separates the critical region from the noncritical region. The critical or rejection region is the range of values of the test value that indicates that there is a significant difference and that the null hypothesis should be rejected. The noncritical or nonrejection region is the range of values of the test value that indicates that the difference was probably due to chance and that the null hypothesis should not be rejected. Two-tailed test: The critical region is in the two extreme regions (tails) under the curve. Left-tailed test: The critical region is in the extreme left region (tail) under the curve. Right-tailed test: The critical region is in the extreme right region (tail) under the curve. 14 8.1 Basics of Hypothesis Testing, Two-Tailed (2TT), Left-Tailed (LTT), Right-Tailed (RTT)
  • 15. a. Finding the Critical Value for α = 0.01 (Right-Tailed Test) b. Finding the Critical Value for α = 0.01 (Left-Tailed Test) c. Finding the Critical Value for α = 0.01 (Two-Tailed Test) Example 3: z-table 15 z = 2.33 for α = 0.01 (RTT) Because of symmetry, z = –2.33 for α = 0.01 (LTT) z = ±2.575
  • 16. Find the critical value(s) for each situation and draw the appropriate figure, showing the critical region. a. A left-tailed test with α = 0.10. b. A two-tailed test with α = 0.02. c. A right-tailed test with α = 0.005. Example 4: z-table Solution: z = –1.28 16 Solution: z = 2.575 or 2.58 Solution: z = ± 2.33
  • 17. Identify the test statistic that is relevant to the test and determine its sampling distribution (such as z, t, χ²) 17 Parameter Sampling Distribution Requirements Test Statistics Proportion: p Normal (Z) 𝑛𝑝 ≥ 5, & 𝑛𝑞 ≥ 5 𝑍 = 𝑝 − 𝑝 𝑝𝑞/𝑛 Mean: 𝝁 t 𝝈 not known & Normally Distributed Population or 𝑛 > 30 𝑡 = 𝑥 − 𝜇 𝑠/ 𝑛 Mean: 𝝁 Normal (Z) 𝝈 known & Normally Distributed Population or 𝑛 > 30 𝑍 = 𝑥 − 𝜇 𝜎/ 𝑛 Standard Deviation: 𝝈 Or Variance: 𝝈 𝟐 𝝌 𝟐 Normally Distributed Population 𝜒2 = (𝑛 − 1)𝑠2 𝜎2
  • 18. Finding P-Value 18 P-value = probability of a test statistic at least as extreme as the one obtained p = population proportion 𝑝: 𝑆𝑎𝑚𝑝𝑙𝑒 𝑃𝑟𝑜𝑝𝑜𝑟𝑡𝑖𝑜𝑛 Test statistic; z = 2.55 Right-tailed Test: p(z > 2.550) = 0.0054 ( Normal distribution area to its right) P-value of 0.0054. Decision Criteria for the P-Value Method: If P-value ≤ α, reject H0 (“If the P is low, the null must go.”) If P-value > α, fail to reject H0.
  • 19. Example 6: Describing Type I and Type II Errors Consider the claim that a medical procedure designed to increase the likelihood of a baby girl is effective, so that the probability of a baby girl is p > 0.5. Given the following null and alternative hypotheses, write statements describing a) type I error, and (b) a type II error. (HINT FOR DESCRIBING TYPE I AND TYPE II ERRORS: Descriptions of a type I error and a type II error refer to the null hypothesis being true or false, but when wording a statement representing a type I error or a type II error, be sure that the conclusion addresses the original claim (which may or may not be the null hypothesis). H0: p = 0.5 H1: p > 0.5 (original claim that will be addressed in the final conclusion) 19 Solution a. Type I Error: A type I error is the mistake of rejecting a true null hypothesis, so the following is a type I error: In reality p = 0.5, but sample evidence leads us to conclude that p > 0.5. (In this case, a type I error is to conclude that the medical procedure is effective when in reality it has no effect.) b. Type II Error: A type II error is the mistake of failing to reject the null hypothesis when it is false, so the following is a type II error: In reality p > 0.5, but we fail to support that conclusion. (In this case, a type II error is to conclude that the medical procedure has no effect, when it really is effective in increasing the likelihood of a baby girl.)