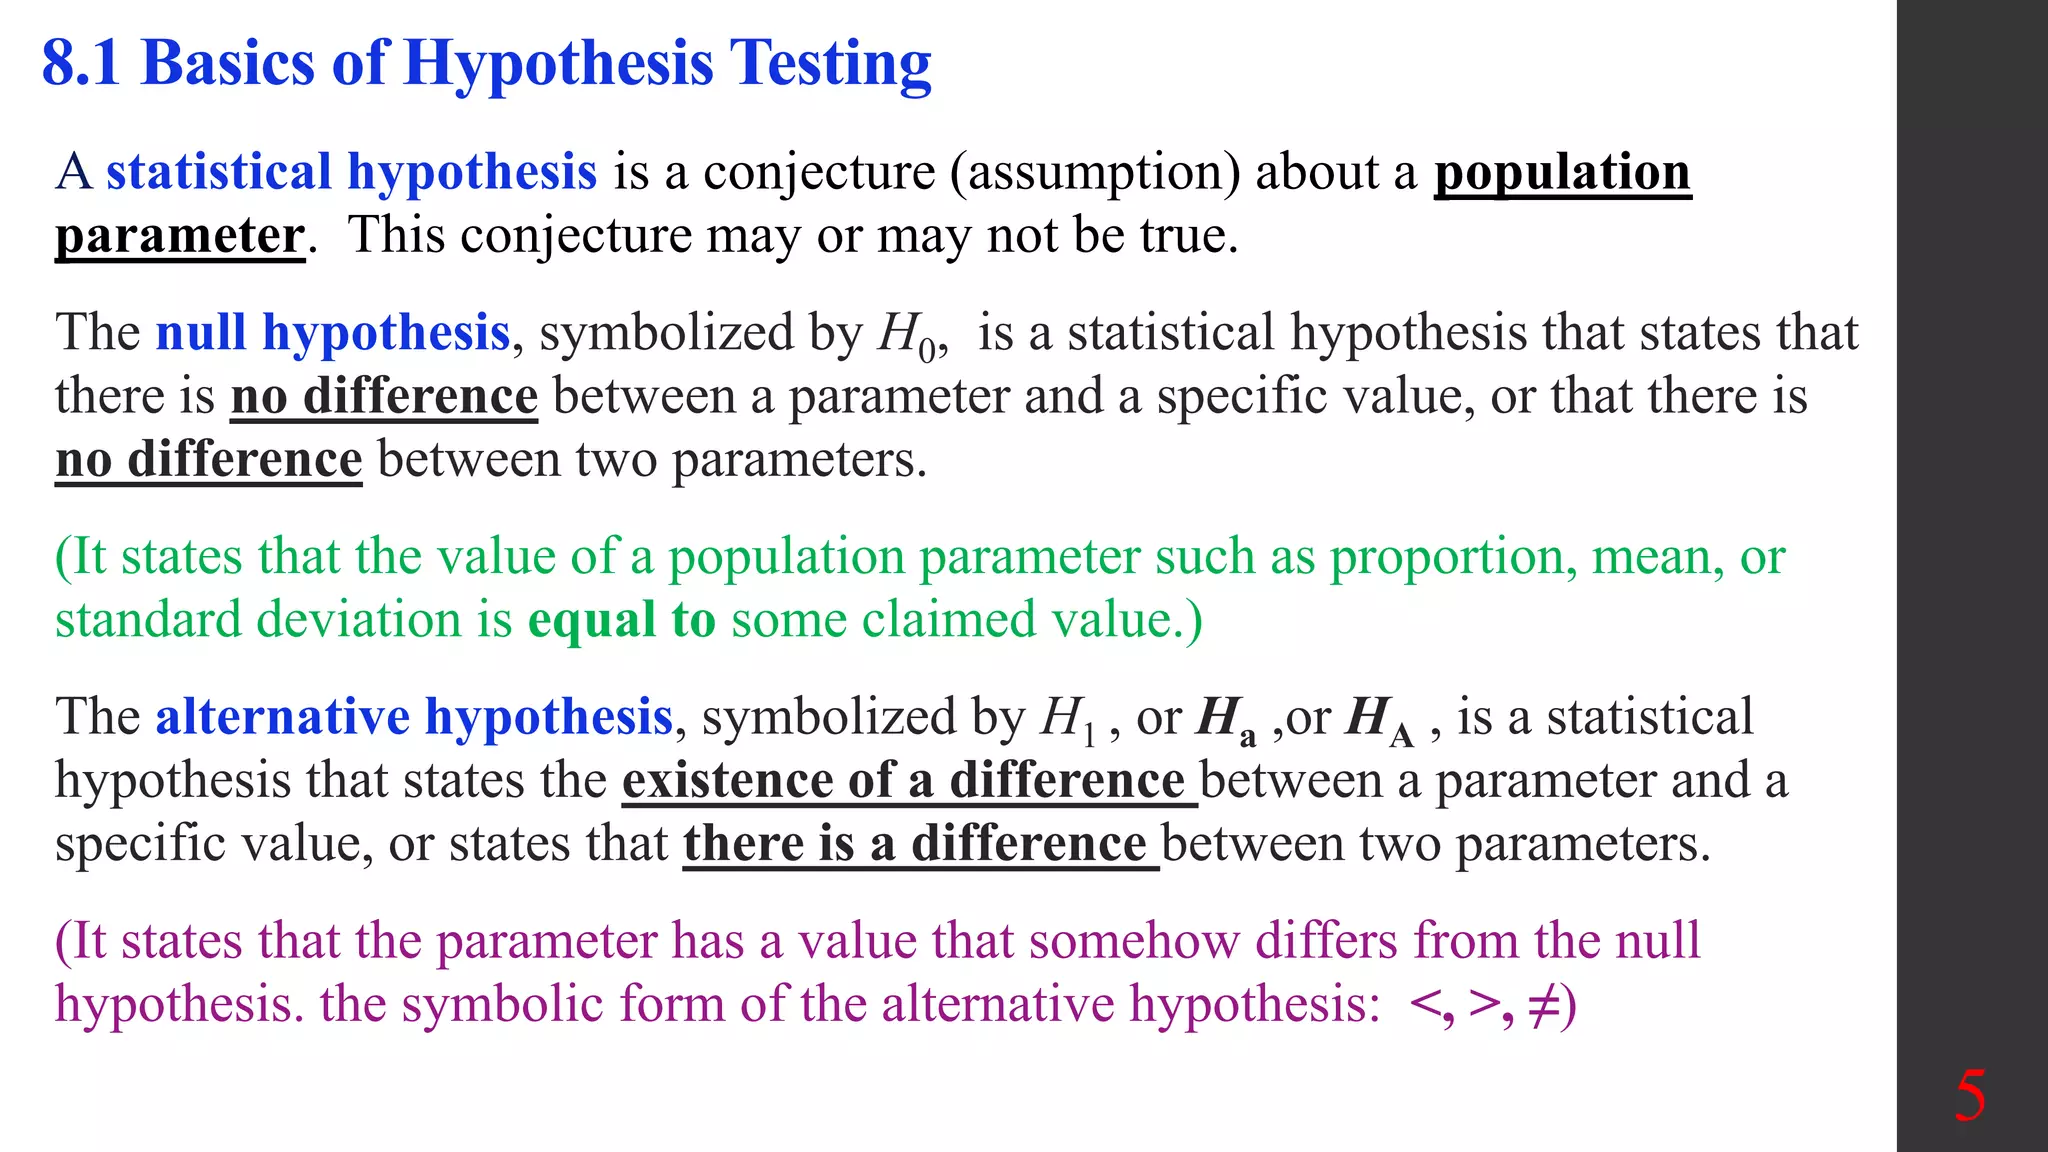
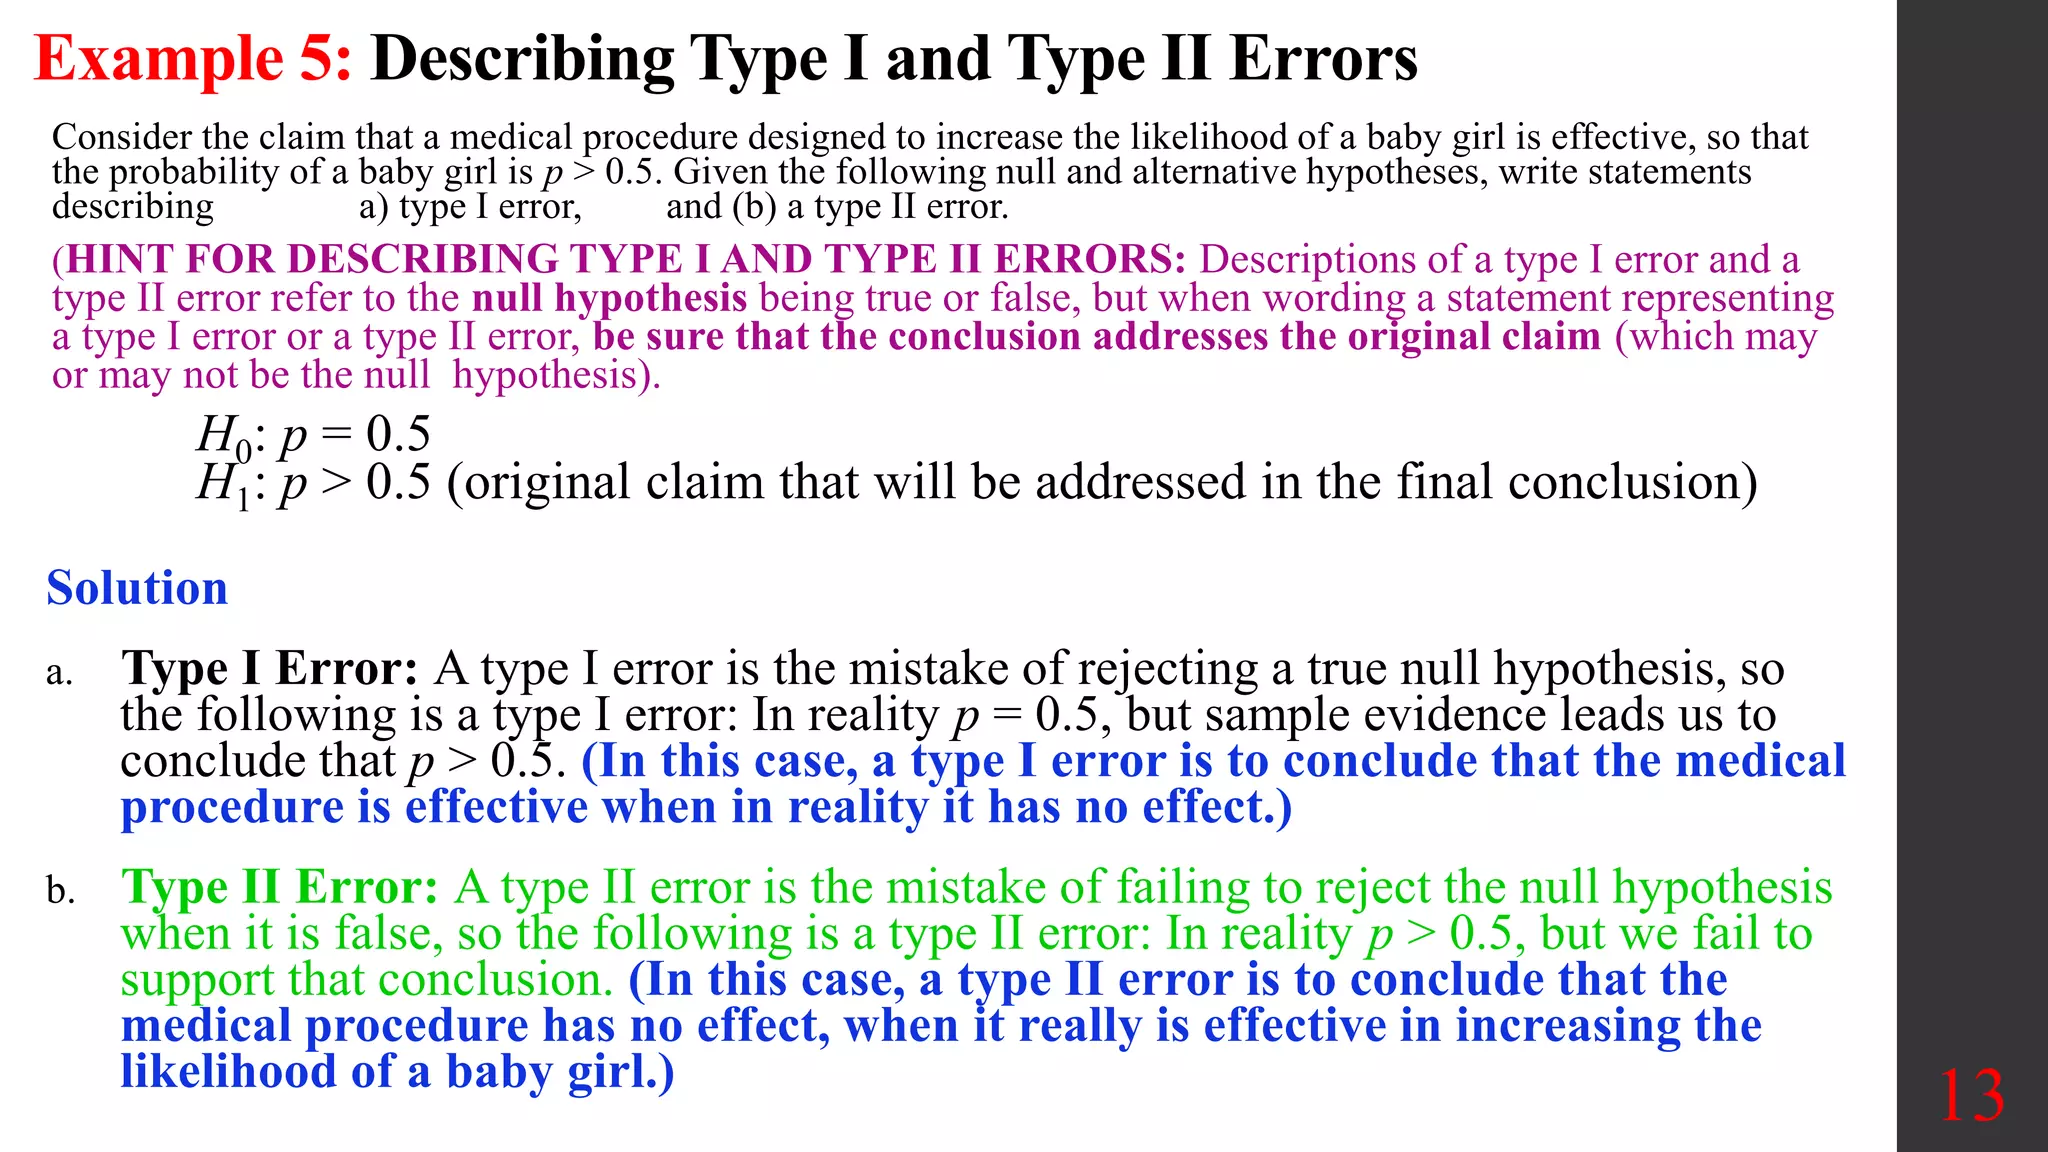
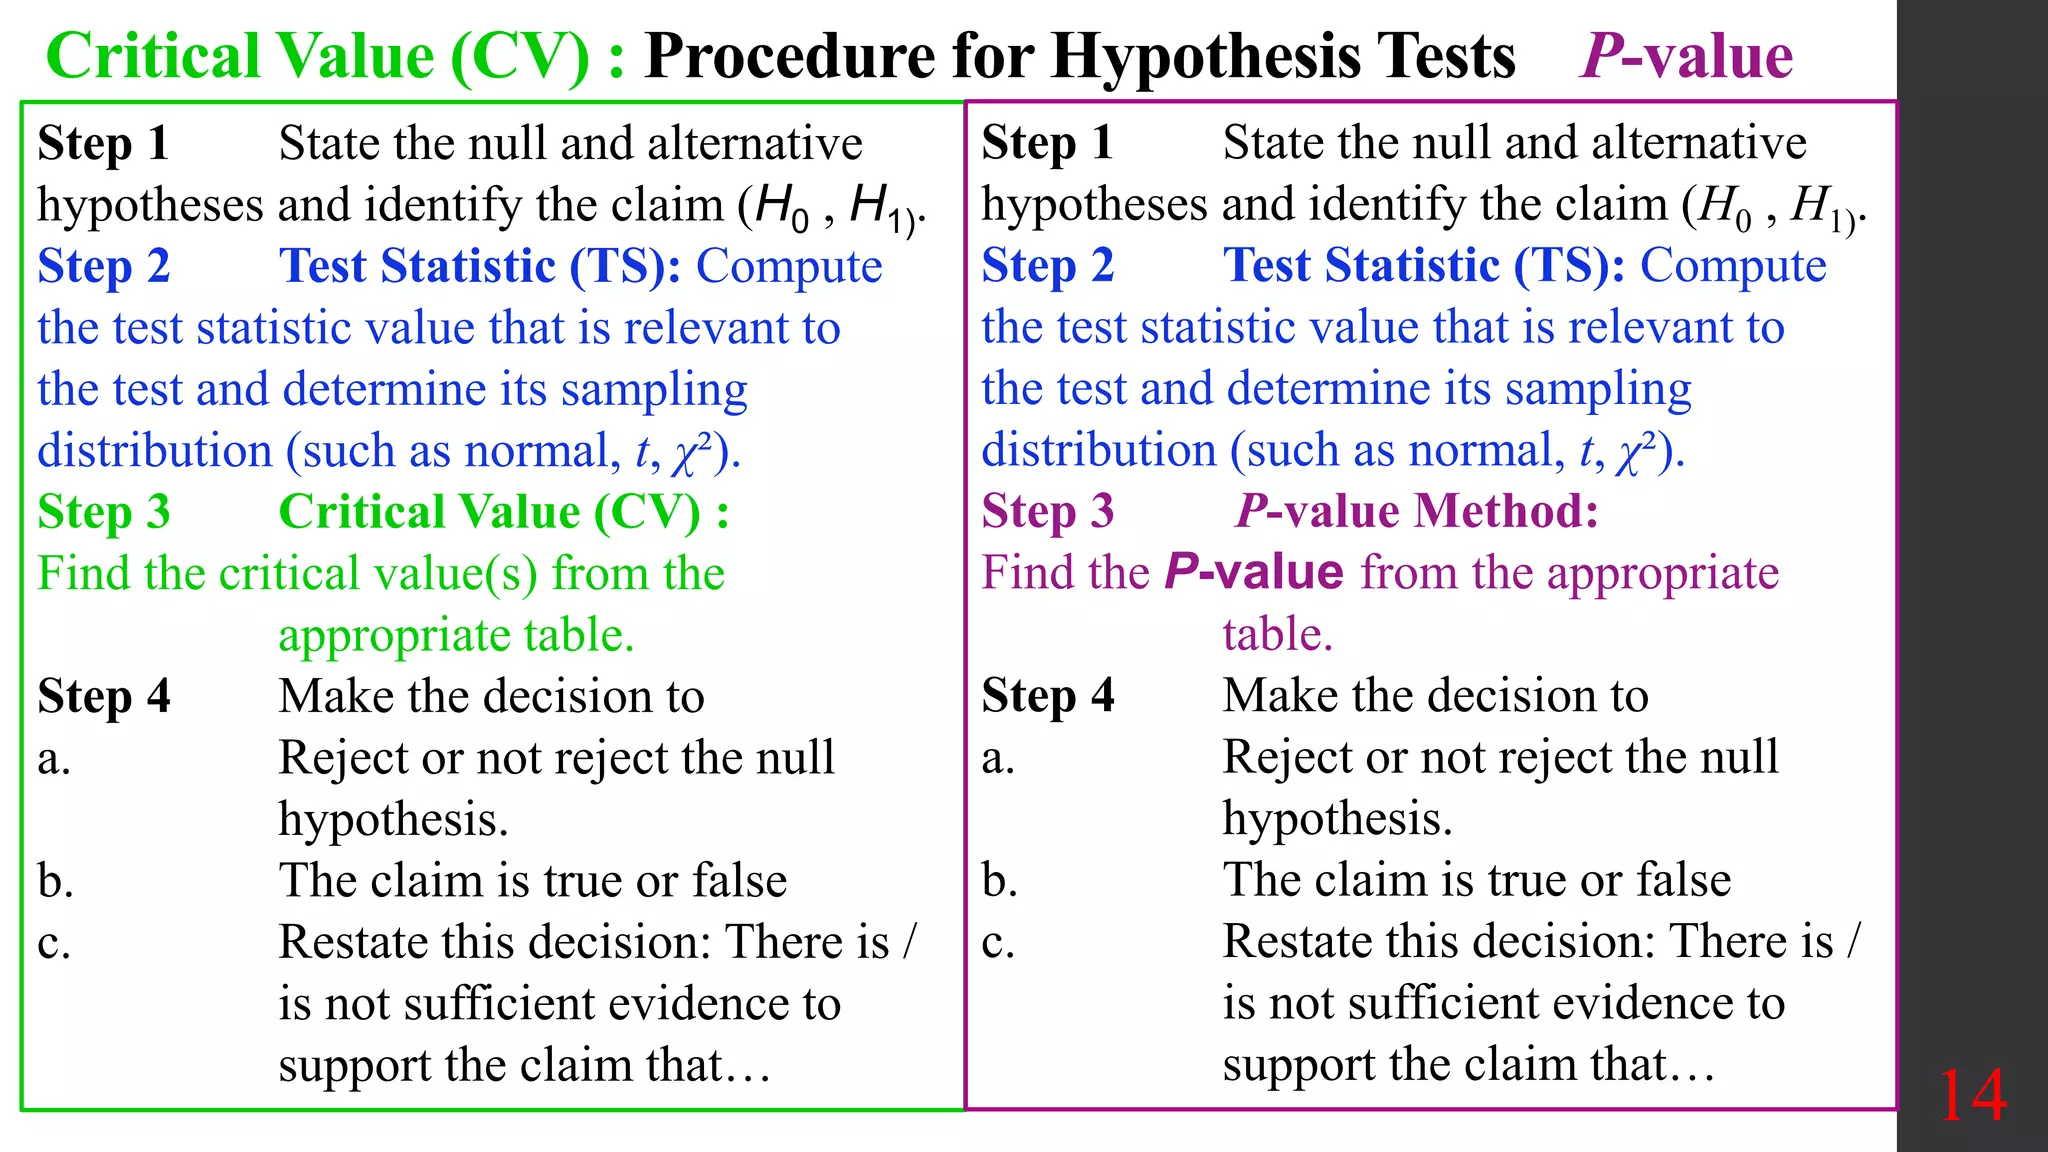
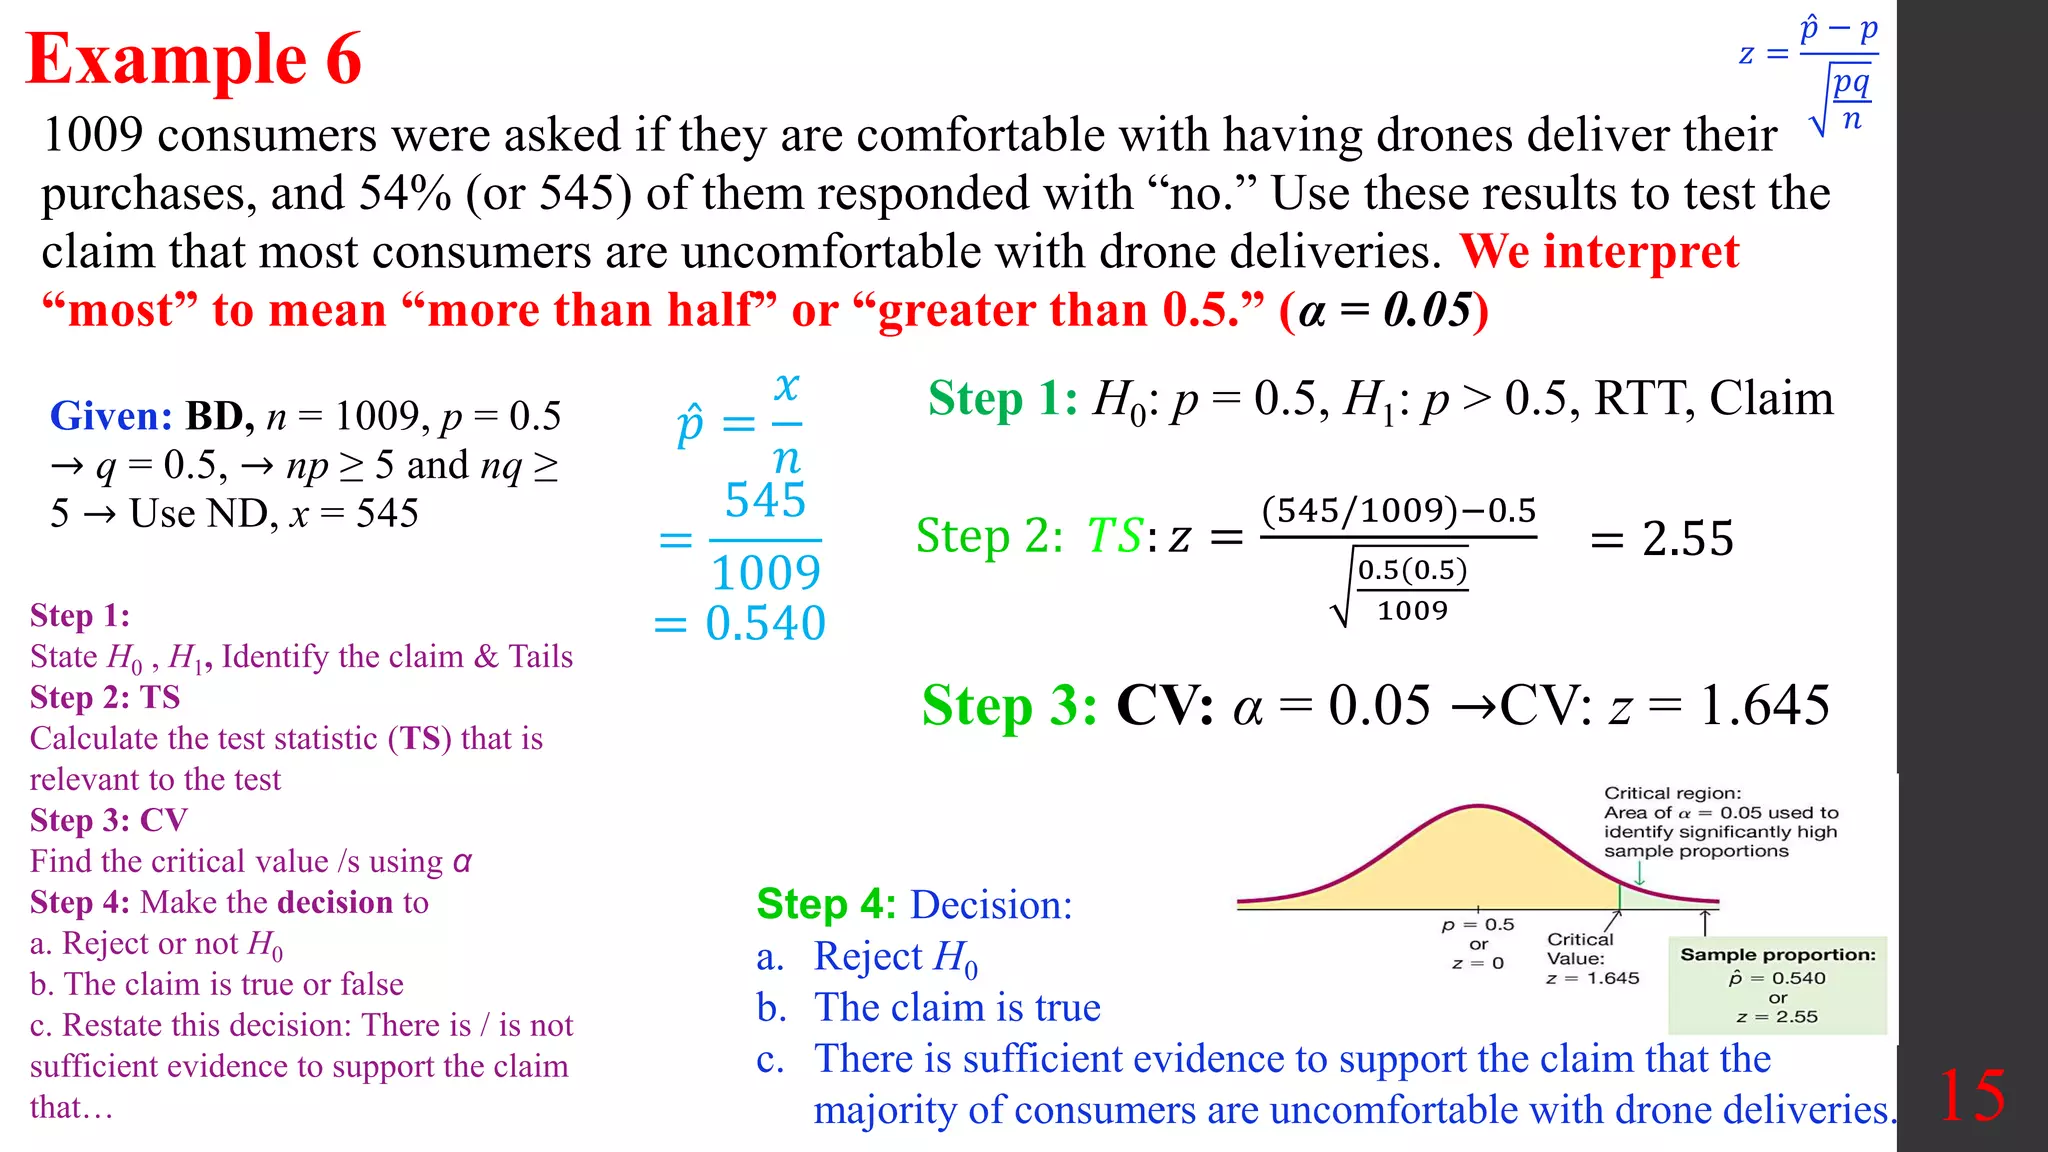
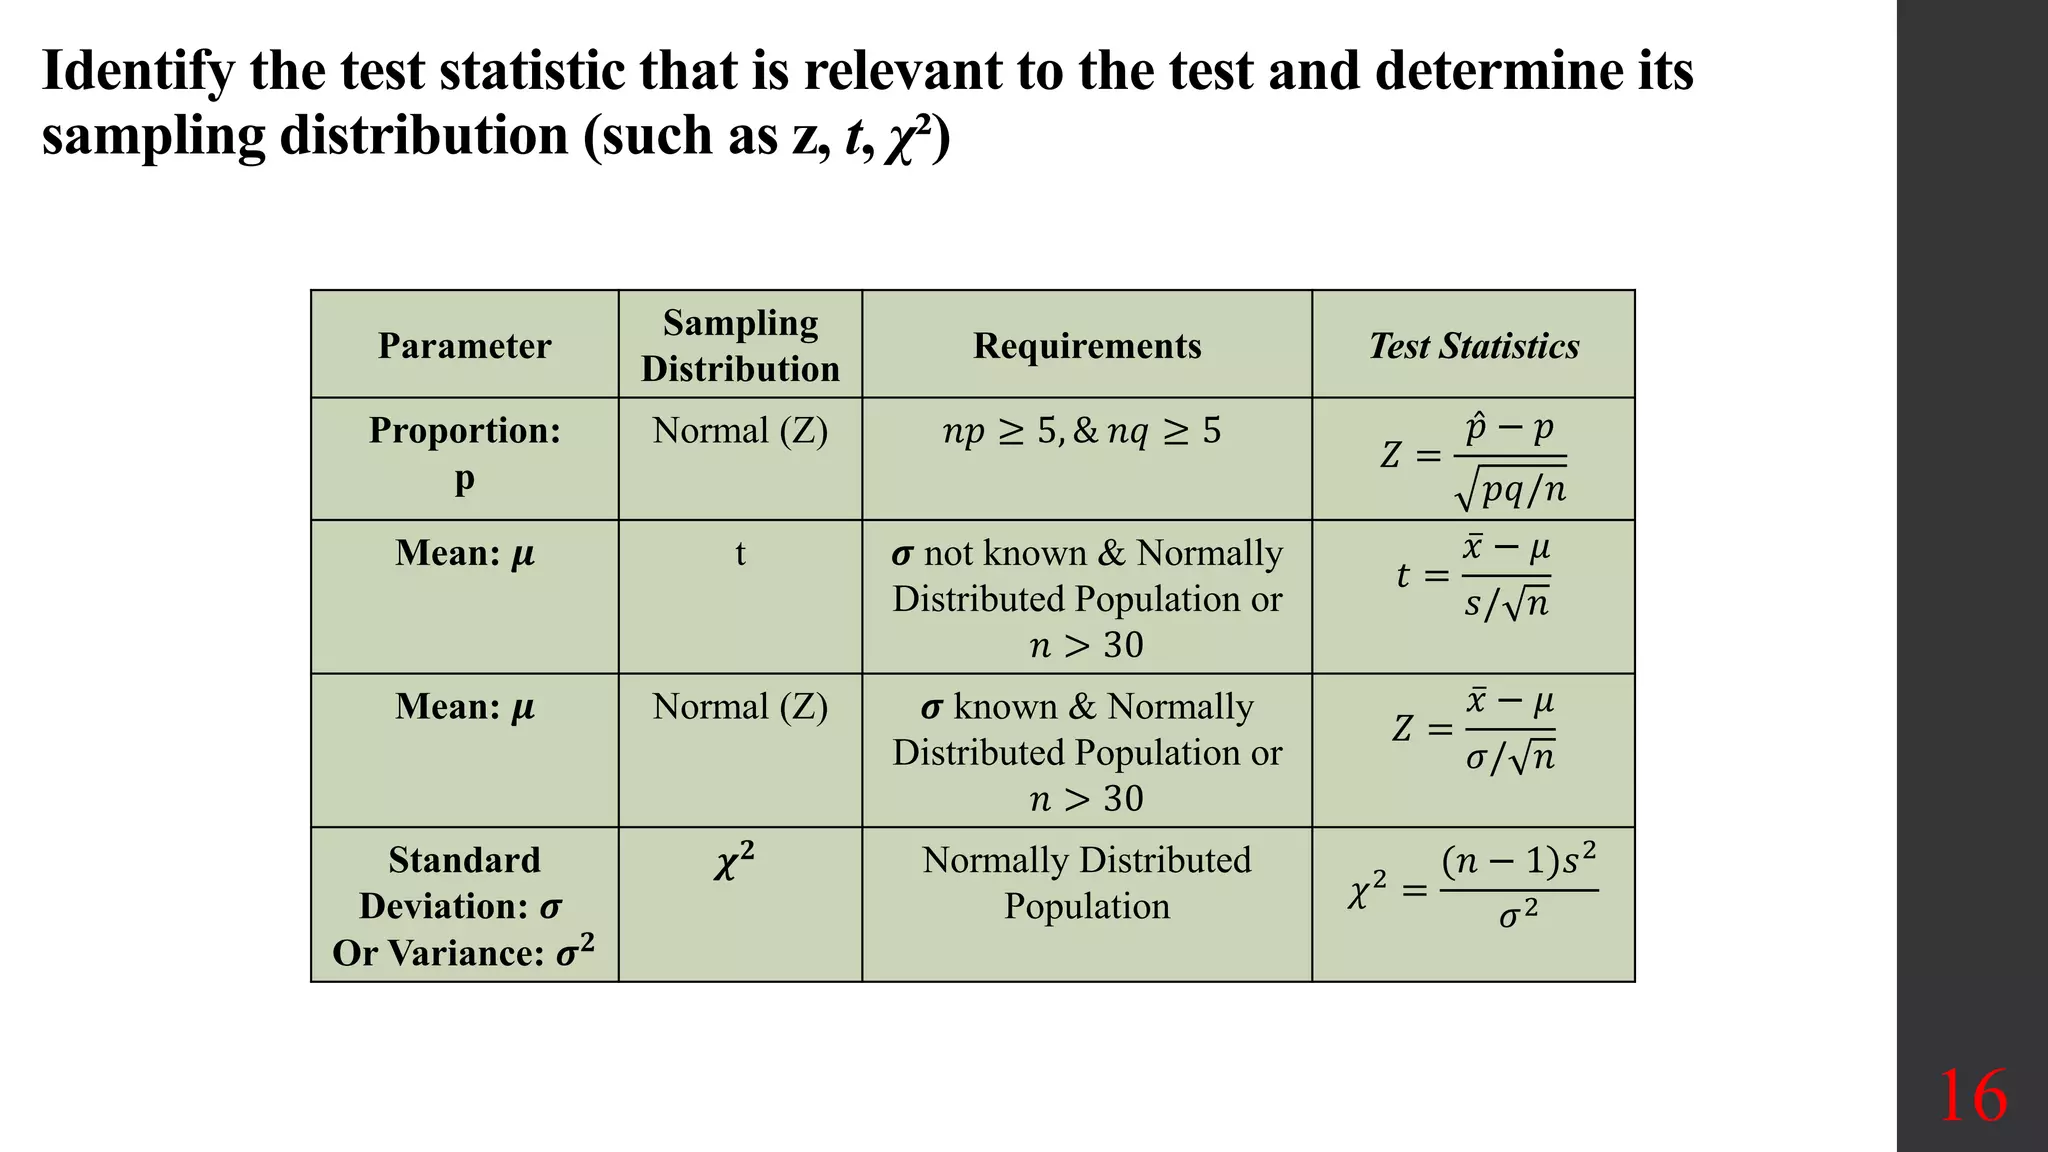
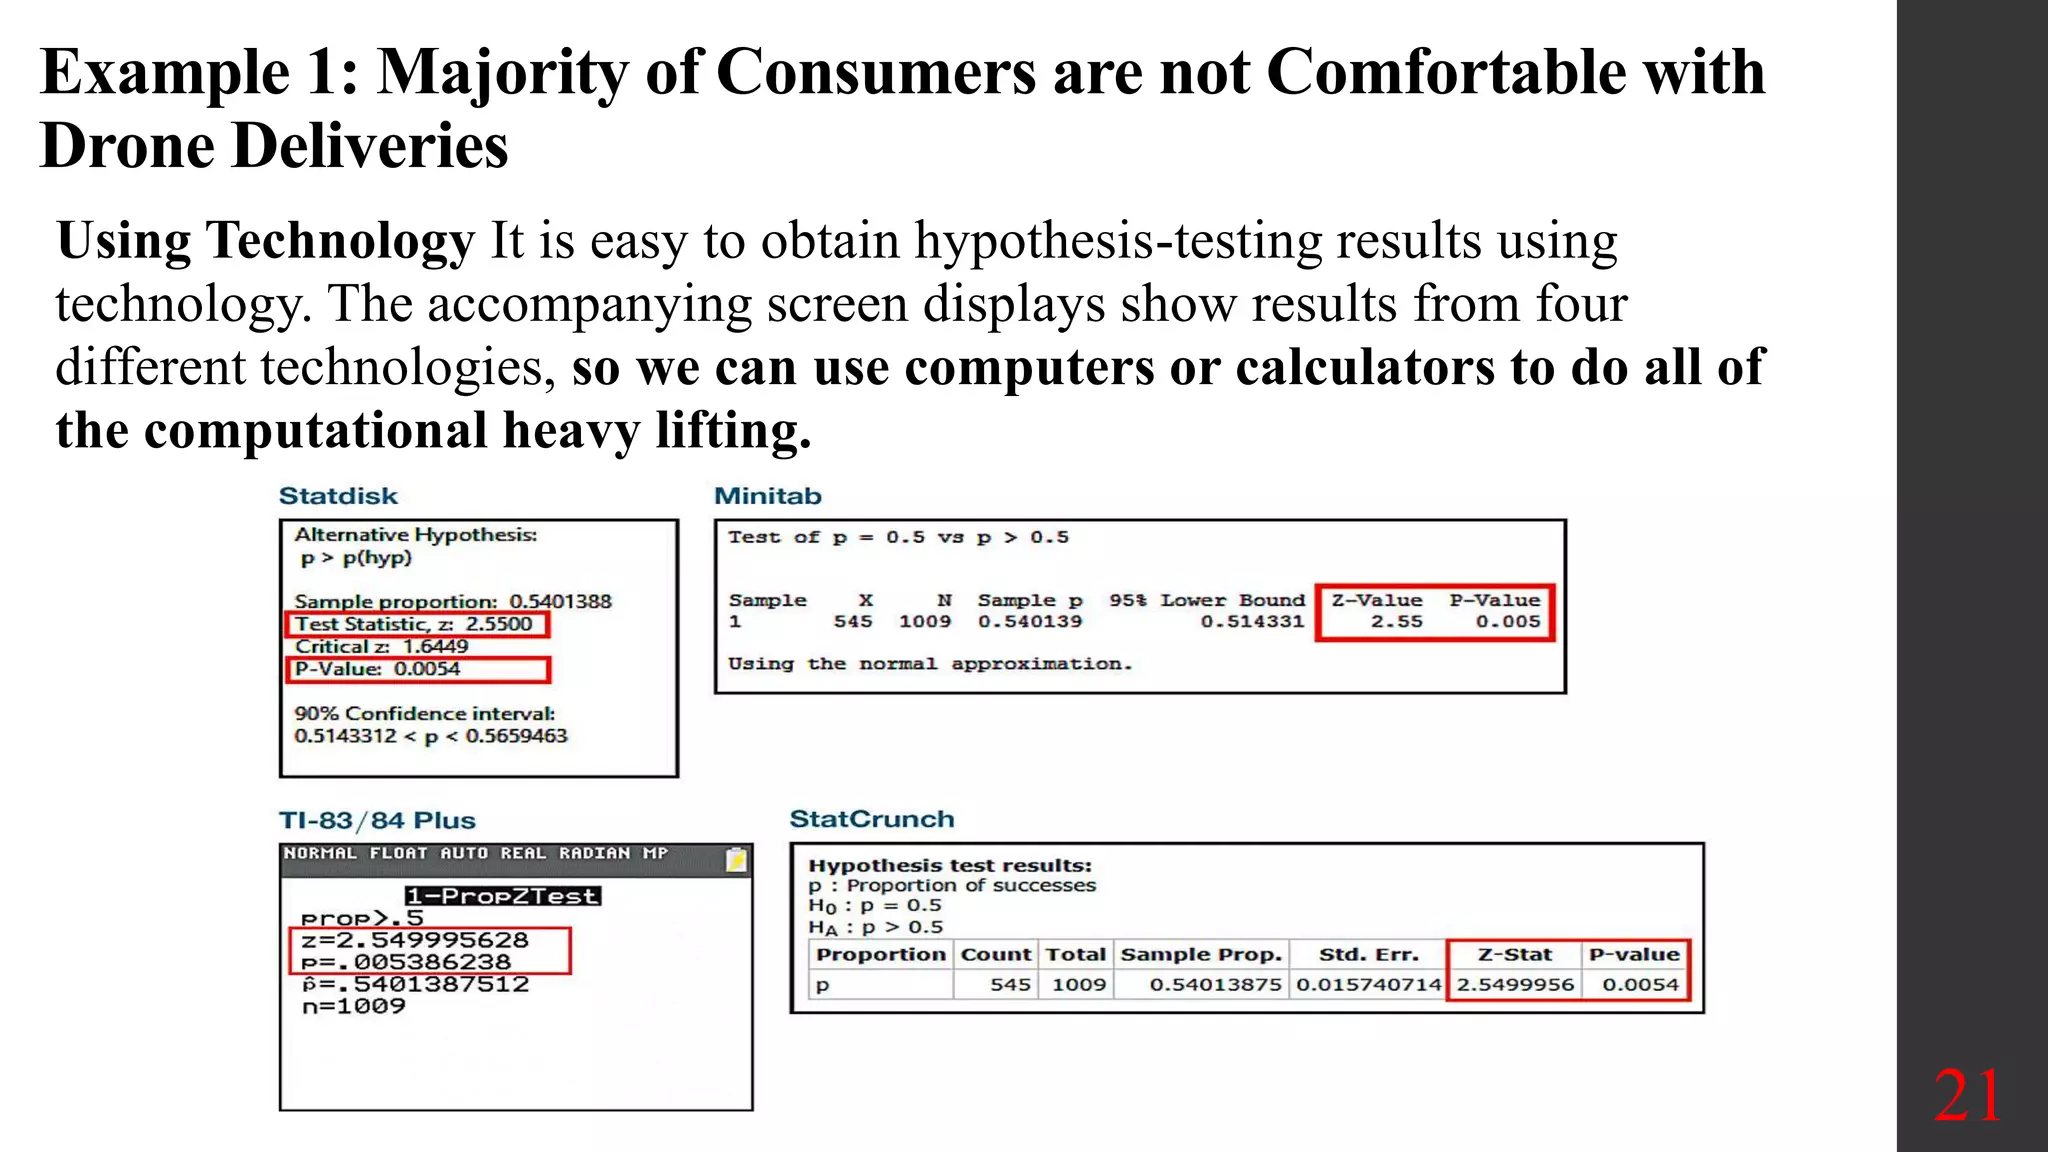
Please Subscribe to this Channel for more solutions and lectures
http://www.youtube.com/onlineteaching
Chapter 8: Hypothesis Testing
8.1: Basics of Hypothesis Testing
Please Subscribe to this Channel for more solutions and lectures
http://www.youtube.com/onlineteaching
Chapter 10: Correlation and Regression
10.2: Regression
Please Subscribe to this Channel for more solutions and lectures
http://www.youtube.com/onlineteaching
Chapter 11: Goodness-of-Fit and Contingency Tables
11.1: Goodness of Fit Notation
Please Subscribe to this Channel for more solutions and lectures
http://www.youtube.com/onlineteaching
Chapter 10: Correlation and Regression
10.1: Correlation
Please Subscribe to this Channel for more solutions and lectures
http://www.youtube.com/onlineteaching
Chapter 8: Hypothesis Testing
8.2: Testing a Claim About a Proportion
Please Subscribe to this Channel for more solutions and lectures
http://www.youtube.com/onlineteaching
Chapter 6: Normal Probability Distribution
6.3: Sampling Distributions and Estimators
Please Subscribe to this Channel for more solutions and lectures
http://www.youtube.com/onlineteaching
Chapter 5: Discrete Probability Distribution
5.2 - Binomial Probability Distributions
Please Subscribe to this Channel for more solutions and lectures
http://www.youtube.com/onlineteaching
Elementary Statistics Practice Test 2 Solutions
Chapter 4: Probability
Solution to the practice test ch 10 correlation reg ch 11 gof ch12 anovaLong Beach City College
Please Subscribe to this Channel for more solutions and lectures
http://www.youtube.com/onlineteaching
Elementary Statistics Practice Test 5
Module 5
Chapter 10: Correlation and Regression
Chapter 11: Goodness of Fit and Contingency Tables
Chapter 12: Analysis of Variance
Please Subscribe to this Channel for more solutions and lectures
http://www.youtube.com/onlineteaching
Chapter 10: Correlation and Regression
10.2: Regression
Please Subscribe to this Channel for more solutions and lectures
http://www.youtube.com/onlineteaching
Chapter 11: Goodness-of-Fit and Contingency Tables
11.1: Goodness of Fit Notation
Please Subscribe to this Channel for more solutions and lectures
http://www.youtube.com/onlineteaching
Chapter 10: Correlation and Regression
10.1: Correlation
Please Subscribe to this Channel for more solutions and lectures
http://www.youtube.com/onlineteaching
Chapter 8: Hypothesis Testing
8.2: Testing a Claim About a Proportion
Please Subscribe to this Channel for more solutions and lectures
http://www.youtube.com/onlineteaching
Chapter 6: Normal Probability Distribution
6.3: Sampling Distributions and Estimators
Please Subscribe to this Channel for more solutions and lectures
http://www.youtube.com/onlineteaching
Chapter 5: Discrete Probability Distribution
5.2 - Binomial Probability Distributions
Please Subscribe to this Channel for more solutions and lectures
http://www.youtube.com/onlineteaching
Elementary Statistics Practice Test 2 Solutions
Chapter 4: Probability
Solution to the practice test ch 10 correlation reg ch 11 gof ch12 anovaLong Beach City College
Please Subscribe to this Channel for more solutions and lectures
http://www.youtube.com/onlineteaching
Elementary Statistics Practice Test 5
Module 5
Chapter 10: Correlation and Regression
Chapter 11: Goodness of Fit and Contingency Tables
Chapter 12: Analysis of Variance
Please Subscribe to this Channel for more solutions and lectures
http://www.youtube.com/onlineteaching
Chapter 4: Probability
4.3: Complements and Conditional Probability, and Bayes' Theorem
📺Please Subscribe to this Channel for more solutions and lectures
http://www.youtube.com/onlineteaching
Chapter 7: Estimating Parameters and Determining Sample Sizes
7.1: Estimating a Population Proportion
Please Subscribe to this Channel for more solutions and lectures
http://www.youtube.com/onlineteaching
Chapter 4: Probability
4.1: Basic Concepts of Probability
Please Subscribe to this Channel for more solutions and lectures
http://www.youtube.com/onlineteaching
Chapter 5: Discrete Probability Distribution
5.1: Probability Distribution
Please Subscribe to this Channel for more solutions and lectures
http://www.youtube.com/onlineteaching
Elementary Statistics Practice Test 2
Chapter 4: Probability
Solution to the practice test ch 8 hypothesis testing ch 9 two populationsLong Beach City College
Please Subscribe to this Channel for more solutions and lectures
http://www.youtube.com/onlineteaching
Elementary Statistics Practice Test 4
Module 4:
Chapter 8, Hypothesis Testing
Chapter 9: Two Populations
Please Subscribe to this Channel for more solutions and lectures
http://www.youtube.com/onlineteaching
Chapter 11: Goodness-of-Fit and Contingency Tables
11.2: Contingency Tables
Please Subscribe to this Channel for more solutions and lectures
http://www.youtube.com/onlineteaching
Chapter 9: Inferences from Two Samples
9.1: Inferences about Two Proportions
Please Subscribe to this Channel for more solutions and lectures
http://www.youtube.com/onlineteaching
Elementary Statistics Practice Test 4
Module 4:
Chapter 8, Hypothesis Testing
Chapter 9: Two Populations
Please Subscribe to this Channel for more solutions and lectures
http://www.youtube.com/onlineteaching
Chapter 9: Inferences from Two Samples
9.2: Two Means, Independent Samples
Please Subscribe to this Channel for more solutions and lectures
http://www.youtube.com/onlineteaching
Chapter 3: Describing, Exploring, and Comparing Data
3.1: Measures of Center
Please Subscribe to this Channel for more solutions and lectures
http://www.youtube.com/onlineteaching
Chapter 12: Analysis of Variance
12.1: One-Way ANOVA
Please Subscribe to this Channel for more solutions and lectures
http://www.youtube.com/onlineteaching
Chapter 6: Normal Probability Distribution
6.1: The Standard Normal Distribution
Please Subscribe to this Channel for more solutions and lectures
http://www.youtube.com/onlineteaching
Chapter 2: Exploring Data with Tables and Graphs
2.3: Graphs that Enlighten and Graphs that Deceive
Please Subscribe to this Channel for more solutions and lectures
http://www.youtube.com/onlineteaching
Chapter 2: Exploring Data with Tables and Graphs
2.1: Frequency Distributions for Organizing and Summarizing Data
Please Subscribe to this Channel for more solutions and lectures
http://www.youtube.com/onlineteaching
Chapter 2: Exploring Data with Tables and Graphs
2.2: Histograms
Please Subscribe to this Channel for more solutions and lectures
http://www.youtube.com/onlineteaching
Chapter 7: Estimating Parameters and Determining Sample Sizes
7.2: Estimating a Population Mean
Please Subscribe to this Channel for more solutions and lectures
http://www.youtube.com/onlineteaching
Chapter 4: Probability
4.3: Complements and Conditional Probability, and Bayes' Theorem
📺Please Subscribe to this Channel for more solutions and lectures
http://www.youtube.com/onlineteaching
Chapter 7: Estimating Parameters and Determining Sample Sizes
7.1: Estimating a Population Proportion
Please Subscribe to this Channel for more solutions and lectures
http://www.youtube.com/onlineteaching
Chapter 4: Probability
4.1: Basic Concepts of Probability
Please Subscribe to this Channel for more solutions and lectures
http://www.youtube.com/onlineteaching
Chapter 5: Discrete Probability Distribution
5.1: Probability Distribution
Please Subscribe to this Channel for more solutions and lectures
http://www.youtube.com/onlineteaching
Elementary Statistics Practice Test 2
Chapter 4: Probability
Solution to the practice test ch 8 hypothesis testing ch 9 two populationsLong Beach City College
Please Subscribe to this Channel for more solutions and lectures
http://www.youtube.com/onlineteaching
Elementary Statistics Practice Test 4
Module 4:
Chapter 8, Hypothesis Testing
Chapter 9: Two Populations
Please Subscribe to this Channel for more solutions and lectures
http://www.youtube.com/onlineteaching
Chapter 11: Goodness-of-Fit and Contingency Tables
11.2: Contingency Tables
Please Subscribe to this Channel for more solutions and lectures
http://www.youtube.com/onlineteaching
Chapter 9: Inferences from Two Samples
9.1: Inferences about Two Proportions
Please Subscribe to this Channel for more solutions and lectures
http://www.youtube.com/onlineteaching
Elementary Statistics Practice Test 4
Module 4:
Chapter 8, Hypothesis Testing
Chapter 9: Two Populations
Please Subscribe to this Channel for more solutions and lectures
http://www.youtube.com/onlineteaching
Chapter 9: Inferences from Two Samples
9.2: Two Means, Independent Samples
Please Subscribe to this Channel for more solutions and lectures
http://www.youtube.com/onlineteaching
Chapter 3: Describing, Exploring, and Comparing Data
3.1: Measures of Center
Please Subscribe to this Channel for more solutions and lectures
http://www.youtube.com/onlineteaching
Chapter 12: Analysis of Variance
12.1: One-Way ANOVA
Please Subscribe to this Channel for more solutions and lectures
http://www.youtube.com/onlineteaching
Chapter 6: Normal Probability Distribution
6.1: The Standard Normal Distribution
Please Subscribe to this Channel for more solutions and lectures
http://www.youtube.com/onlineteaching
Chapter 2: Exploring Data with Tables and Graphs
2.3: Graphs that Enlighten and Graphs that Deceive
Please Subscribe to this Channel for more solutions and lectures
http://www.youtube.com/onlineteaching
Chapter 2: Exploring Data with Tables and Graphs
2.1: Frequency Distributions for Organizing and Summarizing Data
Please Subscribe to this Channel for more solutions and lectures
http://www.youtube.com/onlineteaching
Chapter 2: Exploring Data with Tables and Graphs
2.2: Histograms
Please Subscribe to this Channel for more solutions and lectures
http://www.youtube.com/onlineteaching
Chapter 7: Estimating Parameters and Determining Sample Sizes
7.2: Estimating a Population Mean
Hypothesis Testing
(Statistical Significance)
1
Hypothesis Testing
Goal: Make statement(s) regarding unknown population parameter values based on sample data
Elements of a hypothesis test:
Null hypothesis - Statement regarding the value(s) of unknown parameter(s). Typically will imply no association between explanatory and response variables in our applications (will always contain an equality)
Alternative hypothesis - Statement contradictory to the null hypothesis (will always contain an inequality)
The level of significant (Alpha) is the maximum probability of committing a type I error. P(type I error)= alpha
Definitions
Rejection (alpha, α) Region:
Represents area under the curve that is used to reject the null hypothesis
Level of Confidence, 1 - alpha (a):
Also known as fail to reject (FTR) region
Represents area under the curve that is used to fail to reject the null hypothesis
FTR
H0
α/2
α/2
3
1 vs. 2 Sided Tests
Two-sided test
No a priori reason 1 group should have stronger effect
Used for most tests
Example
H0: μ1 = μ2
HA: μ1 ≠ μ2
One-sided test
Specific interest in only one direction
Not scientifically relevant/interesting if reverse situation true
Example
H0: μ1 ≤ μ2
HA: μ1 > μ2
4
Example: It is believed that the mean age of smokers in San Bernardino is 47. Researchers from LLU believe that the average age is different than 47.
Hypothesis
H0:μ = 47
HA: μ ≠ 47
μ = 47
α /2 = 0.025
Fail to Reject (FTR)
α /2 = 0.025
5
Three Approaches to Reject or Fail to Reject A Null Hypothesis:
1a. Confidence interval
Calculate the confidence interval
Decision Rule:
a. If the confidence interval (CI) includes the null, then the decision must be to fail to reject the H0.
b. If the confidence interval (CI) does not include the null, then the decision must be to reject the H0.
6
1b. Confidence interval to compare groups
Calculate the confidence interval for each group
Decision Rule:
a. If the confidence interval (CI) overlap, then the decision must be to fail to reject the H0.
b. If the confidence interval (CI) do not include the null, then the decision must be to reject the H0.
7
2.Test Statistic
Calculate the test statistic (TS)
Obtain the critical value (CV) from the reference table
Decision Rule:
a. If the test statistic is in the FTR region, then the decision must be to fail to reject the H0.
b. If the test statistic is in the rejection region, then the decision must be to reject the H0.
FTR
CV
TS
Since the test statistic is in the rejection region, reject the H0
FTR
CV
Since the test statistic is in the fail to reject region, fail to reject the H0
TS
CV
CV
8
3. P-Value
Choose α
Calculate value of test statistic from your data
Calculate P- value from test statistic
Decision Rule:
a. If the p-value is less than the level of significance, α, then the decision m.
Basic of Statistical Inference Part-IV: An Overview of Hypothesis TestingDexlab Analytics
The fourth part of the basic of statistical inference series puts its focus on discussing the concept of hypothesis testing explaining all the nuances.
-Hypotheses
-What is Hypothesis testing
-Basic Concepts in Hypotheses Testing (in detail)
~Alternate Hypothesis
~Level of Significance
~Critical Region
~Decision Rule(Test of Hypothesis)
~Type I Error & Type II Error
~Power of Test
~One Tailed & Two Tailed Test
~One Sample & Two Sample Tests
` Types of Hypotheses
` Steps in Hypotheses Testing
~Parametric & Non Parametric Tests
Int 150 The Moral Instinct”1. Most cultures agree that abus.docxmariuse18nolet
Int 150
“The Moral Instinct”
1. Most cultures agree that abusing innocent people is wrong. True or false
2. Young children have a sense of morality. True or false (example)?
3. Emotional reasoning trumps rationalizing. True or false (explain)
4. According to the article, psychopathy or moral misbehavior (like rape) is more environmental than genetic. True or false (example)
5. Explain the point about the British schoolteacher in Sudan.
6. Name three things anthropologists believe all people share, in addition to thinking it’s bad to harm others and good to help them.
a.
b.
c.
7. What is reciprocal altruism?
8. How does the psychologist Tetlock explain the outrage of American college students at the thought that adoption agencies should place children with couples willing to pay the most?
9. Discuss: A love for children and sense of justice is just an expression of our innate sense of preserving our genes for future generations (Darwin)
10. What does the author warn about the arguments regarding climate change?
Hypothesis Testing
(Statistical Significance)
1
Hypothesis Testing
Goal: Make statement(s) regarding unknown population parameter values based on sample data
Elements of a hypothesis test:
Null hypothesis - Statement regarding the value(s) of unknown parameter(s). Typically will imply no association between explanatory and response variables in our applications (will always contain an equality)
Alternative hypothesis - Statement contradictory to the null hypothesis (will always contain an inequality)
The level of significant (Alpha) is the maximum probability of committing a type I error. P(type I error)= alpha
Definitions
Rejection (alpha, α) Region:
Represents area under the curve that is used to reject the null hypothesis
Level of Confidence, 1 - alpha (a):
Also known as fail to reject (FTR) region
Represents area under the curve that is used to fail to reject the null hypothesis
FTR
H0
α/2
α/2
3
1 vs. 2 Sided Tests
Two-sided test
No a priori reason 1 group should have stronger effect
Used for most tests
Example
H0: μ1 = μ2
HA: μ1 ≠ μ2
One-sided test
Specific interest in only one direction
Not scientifically relevant/interesting if reverse situation true
Example
H0: μ1 ≤ μ2
HA: μ1 > μ2
4
Example: It is believed that the mean age of smokers in San Bernardino is 47. Researchers from LLU believe that the average age is different than 47.
Hypothesis
H0:μ = 47
HA: μ ≠ 47
μ = 47
α /2 = 0.025
Fail to Reject (FTR)
α /2 = 0.025
5
Three Approaches to Reject or Fail to Reject A Null Hypothesis:
1a. Confidence interval
Calculate the confidence interval
Decision Rule:
a. If the confidence interval (CI) includes the null, then the decision must be to fail to reject the H0.
b. If the confidence interval (CI) does not include the null, then the decision must be to reject the H0.
6
1b. Confidence interval to compare groups
Calculate the confidence interval for each gro.
Please Subscribe to this Channel for more solutions and lectures
http://www.youtube.com/onlineteaching
Elementary Statistics Practice Test 4
Chapter 9: Inferences about Two Samples
Please Subscribe to this Channel for more solutions and lectures
http://www.youtube.com/onlineteaching
Elementary Statistics Practice Test 4
Chapter 8: Hypothesis Testing
Please Subscribe to this Channel for more solutions and lectures
http://www.youtube.com/onlineteaching
Elementary Statistics Practice Test 5
Module 5
Chapter 10: Correlation and Regression
Chapter 11: Goodness of Fit and Contingency Tables
Chapter 12: Analysis of Variance
Solution to the Practice Test 3A, Chapter 6 Normal Probability DistributionLong Beach City College
Please Subscribe to this Channel for more solutions and lectures
http://www.youtube.com/onlineteaching
Elementary Statistics Practice Test 3
Practice Test Chapter 6 (Normal Probability Distributions)
Chapter 6: Normal Probability Distributions
Please Subscribe to this Channel for more solutions and lectures
http://www.youtube.com/onlineteaching
Elementary Statistics Practice Test 3
Practice Test Chapter 6 (Normal Probability Distributions)
Chapter 6: Normal Probability Distributions
Please Subscribe to this Channel for more solutions and lectures
http://www.youtube.com/onlineteaching
Elementary Statistics Practice Test 1
Module 1: Chapters 1-3
Chapter 1: Introduction to Statistics.
Chapter 2: Exploring Data with Tables and Graphs.
Chapter 3: Describing, Exploring, and Comparing Data.
Please Subscribe to this Channel for more solutions and lectures
http://www.youtube.com/onlineteaching
Chapter 12: Analysis of Variance
12.2: Two-Way ANOVA
Please Subscribe to this Channel for more solutions and lectures
http://www.youtube.com/onlineteaching
Chapter 9: Inferences from Two Samples
9.4: Two Variances or Standard Deviations
Please Subscribe to this Channel for more solutions and lectures
http://www.youtube.com/onlineteaching
Chapter 9: Inferences from Two Samples
9.3 Two Means, Two Dependent Samples, Matched Pairs
Please Subscribe to this Channel for more solutions and lectures
http://www.youtube.com/onlineteaching
Chapter 8: Hypothesis Testing
8.4: Testing a Claim About a Standard Deviation or Variance
Please Subscribe to this Channel for more solutions and lectures
http://www.youtube.com/onlineteaching
Chapter 8: Hypothesis Testing
8.3: Testing a Claim About a Mean
Please Subscribe to this Channel for more solutions and lectures
http://www.youtube.com/onlineteaching
Chapter 7: Estimating Parameters and Determining Sample Sizes
7.3: Estimating a Population Standard Deviation or Variance
The Art Pastor's Guide to Sabbath | Steve ThomasonSteve Thomason
What is the purpose of the Sabbath Law in the Torah. It is interesting to compare how the context of the law shifts from Exodus to Deuteronomy. Who gets to rest, and why?
Model Attribute Check Company Auto PropertyCeline George
In Odoo, the multi-company feature allows you to manage multiple companies within a single Odoo database instance. Each company can have its own configurations while still sharing common resources such as products, customers, and suppliers.
How to Make a Field invisible in Odoo 17Celine George
It is possible to hide or invisible some fields in odoo. Commonly using “invisible” attribute in the field definition to invisible the fields. This slide will show how to make a field invisible in odoo 17.
Operation “Blue Star” is the only event in the history of Independent India where the state went into war with its own people. Even after about 40 years it is not clear if it was culmination of states anger over people of the region, a political game of power or start of dictatorial chapter in the democratic setup.
The people of Punjab felt alienated from main stream due to denial of their just demands during a long democratic struggle since independence. As it happen all over the word, it led to militant struggle with great loss of lives of military, police and civilian personnel. Killing of Indira Gandhi and massacre of innocent Sikhs in Delhi and other India cities was also associated with this movement.
The French Revolution, which began in 1789, was a period of radical social and political upheaval in France. It marked the decline of absolute monarchies, the rise of secular and democratic republics, and the eventual rise of Napoleon Bonaparte. This revolutionary period is crucial in understanding the transition from feudalism to modernity in Europe.
For more information, visit-www.vavaclasses.com
Students, digital devices and success - Andreas Schleicher - 27 May 2024..pptxEduSkills OECD
Andreas Schleicher presents at the OECD webinar ‘Digital devices in schools: detrimental distraction or secret to success?’ on 27 May 2024. The presentation was based on findings from PISA 2022 results and the webinar helped launch the PISA in Focus ‘Managing screen time: How to protect and equip students against distraction’ https://www.oecd-ilibrary.org/education/managing-screen-time_7c225af4-en and the OECD Education Policy Perspective ‘Students, digital devices and success’ can be found here - https://oe.cd/il/5yV
Unit 8 - Information and Communication Technology (Paper I).pdfThiyagu K
This slides describes the basic concepts of ICT, basics of Email, Emerging Technology and Digital Initiatives in Education. This presentations aligns with the UGC Paper I syllabus.
Ethnobotany and Ethnopharmacology:
Ethnobotany in herbal drug evaluation,
Impact of Ethnobotany in traditional medicine,
New development in herbals,
Bio-prospecting tools for drug discovery,
Role of Ethnopharmacology in drug evaluation,
Reverse Pharmacology.
2. Chapter 8: Hypothesis Testing
8.1 Basics of Hypothesis Testing
8.2 Testing a Claim about a Proportion
8.3 Testing a Claim About a Mean
8.4 Testing a Claim About a Standard Deviation or Variance
2
Objectives:
• Understand the definitions used in hypothesis testing.
• State the null and alternative hypotheses.
• State the steps used in hypothesis testing.
• Test proportions, using the z test.
• Test means when is known, using the z test.
• Test means when is unknown, using the t test.
• Test variances or standard deviations, using the chi-square test.
• Test hypotheses, using confidence intervals.
3. Key Concept: Key components of a formal hypothesis test. The concepts in this section are general and
apply to hypothesis tests involving proportions, means, or standard deviations or variances.
Hypothesis: In statistics, a hypothesis is a claim or statement about a property of a population.
Hypothesis Test: A hypothesis test (or test of significance) is a procedure for testing a claim about a
property of a population.
Researchers are interested in answering many types of questions. For example,
Is the earth warming up?
Does a new medication lower blood pressure?
Does the public prefer a certain color in a new fashion line?
Is a new teaching technique better than a traditional one?
Do seat belts reduce the severity of injuries?
These types of questions can be addressed through statistical hypothesis testing, which is a decision-
making process for evaluating claims about a population.
8.1 Basics of Hypothesis Testing
3
4. 2000 consumers were asked if they are comfortable with having drones deliver
their purchases, and 54% (or 1080) of them responded with “no.” Using p to
denote the proportion of consumers not comfortable with drone deliveries, the
“majority” claim is equivalent to the claim that the proportion is greater than
half, or p > 0.5. The expression p > 0.5 is the symbolic form of the original
claim.
Example 1
The Claim: The population proportion p: p > 0.5.
Among 2000 consumers, how many do we need to get a significantly high number
who are not comfortable with drone delivery?
A result of 1020 (or 51%) is just barely more than half, so 1020 is clearly not
significantly high.
A result of 1900 (or 95%) is clearly significantly high.
What about the result of 1080 (or 54.0%)?
Is 1080 (or 54.0%) significantly high? The method of hypothesis testing allows us to
answer that key question.
4
5. 8.1 Basics of Hypothesis Testing
A statistical hypothesis is a conjecture (assumption) about a population
parameter. This conjecture may or may not be true.
The null hypothesis, symbolized by H0, is a statistical hypothesis that states that
there is no difference between a parameter and a specific value, or that there is
no difference between two parameters.
(It states that the value of a population parameter such as proportion, mean, or
standard deviation is equal to some claimed value.)
The alternative hypothesis, symbolized by H1 , or Ha ,or HA , is a statistical
hypothesis that states the existence of a difference between a parameter and a
specific value, or states that there is a difference between two parameters.
(It states that the parameter has a value that somehow differs from the null
hypothesis. the symbolic form of the alternative hypothesis: <, >, ≠)
5
6. The critical value, C.V., separates the critical region
from the noncritical region.
The critical or rejection region is the range of values of
the test value that indicates that there is a significant
difference and that the null hypothesis should be
rejected.
The noncritical or nonrejection region is the range of
values of the test value that indicates that the difference
was probably due to chance and that the null hypothesis
should not be rejected.
Two-tailed test: The critical region is in the two extreme
regions (tails) under the curve.
Left-tailed test: The critical region is in the extreme left
region (tail) under the curve.
Right-tailed test: The critical region is in the extreme right
region (tail) under the curve.
6
8.1 Basics of Hypothesis Testing, Two-Tailed (2TT), Left-Tailed (LTT), Right-Tailed (RTT)
7. a. A researcher is interested in
finding out whether a new
medication will have a side
effect on the pulse rate of the
patients who take the
medication. Will the pulse
rate increase, decrease, or
remain unchanged after a
patient takes the medication?
The researcher knows that the
mean pulse rate for the
population under study is 80
beats per minute.
Example 2: Identify the null and alternative Hypotheses.
H0 : 𝜇 = 80 H1 : 𝜇 ≠ 80
This is called a two-tailed
(2TT) hypothesis test.
7
b. A chemist invents a
chemical to increase
the life of an
automobile battery.
The mean lifetime of
the automobile
battery without the
additive is 34 months.
H0 : 𝜇 = 34 H1 : 𝜇 > 34
This is called a Right-tailed
(RTT) hypothesis test.
c. A contractor wishes
to lower heating bills
by using a special
type of insulation in
houses. If the average
of the monthly
heating bills is $70,
her hypotheses about
heating costs with the
use of insulation are
H0 : 𝜇 = 70 H1 : 𝜇 < 70
This is called a Left-tailed
(LTT) hypothesis test.
8. 1. The traditional method (Critical Value Method) (CV)
The Critical Value-Method, separates the critical region from the noncritical region.
2. The P-value method
P-Value Method: In a hypothesis test, the P-value is the probability of getting a value of the test statistic
that is at least as extreme as the test statistic obtained from the sample data, assuming that the null hypothesis
is true. (the P-value of a test is the probability that the value you see could have happened because of
sampling error if H0 is true.)
3. The confidence interval (CI)method
Because a confidence interval estimate of a population parameter contains the likely values of that parameter,
reject a claim that the population parameter has a value that is not included in the confidence interval.
Equivalent Methods: A confidence interval estimate of a proportion might lead to a conclusion different
from that of a hypothesis test.
8.1 Basics of Hypothesis Testing: Three methods used to test hypotheses:
8
Construct a confidence interval with
a confidence level selected:
Significance Level for
Hypothesis Test: α
Two-Tailed Test:
1 – α
One-Tailed
Test: 1 – 2α
0.01 99% 98%
0.05 95% 90%
0.10 90% 80%
9. In some texts Claim: Use the Original Claim to Create a Null Hypothesis H0 and
an Alternative Hypothesis H1
When a researcher conducts a study, he or she is generally looking for evidence to
support a claim. A claim can be stated as either the null hypothesis or the
alternative hypothesis.
After stating the hypotheses, the researcher’s next step is to design the study:
a. The researcher selects the correct statistical test: (such as z, t, χ²).
b. chooses an appropriate level of significance: α
c. and formulates a plan for conducting the study: CV method, P-value method, CI
(Confidence Interval) method
A statistical test uses the data obtained from a sample to make a decision about
whether the null hypothesis should be rejected. The numerical value obtained from a
statistical test is called the test statistic (value).
The null hypothesis may or may not be true, and a decision is made to reject or not to
reject it on the basis of the data obtained from a sample.
8.1 Basics of Hypothesis Testing
9
10. a. Finding the Critical Value for α = 0.01
(Right-Tailed Test)
b. Finding the Critical Value for α = 0.01
(Left-Tailed Test)
c. Finding the Critical Value for α = 0.01
(Two-Tailed Test)
Example 3: z-table
10
z = 2.33 for α = 0.01 (RTT)
Because of
symmetry,
z = –2.33 for
α = 0.01
(LTT)
z = ±2.575
11. Find the critical value(s) for each situation and draw
the appropriate figure, showing the critical region.
a. A left-tailed test with α = 0.10.
b. A two-tailed test with α = 0.02.
c. A right-tailed test with α = 0.005.
Example 4: z-table
Solution: z = –1.28
11
Solution: z = 2.575 or 2.58
Solution: z = ± 2.33
12. Type I and Type II Errors
Type I error (False positive): The mistake of rejecting the null hypothesis when it is actually true. The
symbol α (alpha) is used to represent the probability of a type I error. (A type I error occurs if one
rejects the null hypothesis when it is true.)
The level of significance is the maximum probability of committing a type I error: α = P(type I
error) = P(rejecting H0 when H0 is true) and Typical significance levels are: 0.10, 0.05, and 0.01
For example, when a = 0.10, there is a 10% chance of rejecting a true null hypothesis.
Type II error (False negative): The mistake of failing to reject the null hypothesis when it is actually
false. The symbol β (beta) is used to represent the probability of a type II error. (A type II error occurs
if one does not reject the null hypothesis when it is false.) β = P(type II error) = P(failing to reject H0
when H0 is false)
12
Preliminary
Conclusion
True State of Nature
Null hypothesis is true
True State of Nature
Null hypothesis is false
Reject H0 Type I error (False Positive):
Reject a true H0.
P(type I error) = α
Correct decision
(Power of the test)
1 ‒ β
Fail to
Reject H0
Correct decision
1 ‒ α
Type II error (False Negative):
Fail to reject a false H0.
P(type II error) = β
8.1 Basics of Hypothesis Testing
13. Example 5: Describing Type I and Type II Errors
Consider the claim that a medical procedure designed to increase the likelihood of a baby girl is effective, so that
the probability of a baby girl is p > 0.5. Given the following null and alternative hypotheses, write statements
describing a) type I error, and (b) a type II error.
(HINT FOR DESCRIBING TYPE I AND TYPE II ERRORS: Descriptions of a type I error and a
type II error refer to the null hypothesis being true or false, but when wording a statement representing
a type I error or a type II error, be sure that the conclusion addresses the original claim (which may
or may not be the null hypothesis).
H0: p = 0.5
H1: p > 0.5 (original claim that will be addressed in the final conclusion)
13
Solution
a. Type I Error: A type I error is the mistake of rejecting a true null hypothesis, so
the following is a type I error: In reality p = 0.5, but sample evidence leads us to
conclude that p > 0.5. (In this case, a type I error is to conclude that the medical
procedure is effective when in reality it has no effect.)
b. Type II Error: A type II error is the mistake of failing to reject the null hypothesis
when it is false, so the following is a type II error: In reality p > 0.5, but we fail to
support that conclusion. (In this case, a type II error is to conclude that the
medical procedure has no effect, when it really is effective in increasing the
likelihood of a baby girl.)
14. Critical Value (CV) : Procedure for Hypothesis Tests P-value
14
Step 1 State the null and alternative
hypotheses and identify the claim (H0 , H1).
Step 2 Test Statistic (TS): Compute
the test statistic value that is relevant to
the test and determine its sampling
distribution (such as normal, t, χ²).
Step 3 Critical Value (CV) :
Find the critical value(s) from the
appropriate table.
Step 4 Make the decision to
a. Reject or not reject the null
hypothesis.
b. The claim is true or false
c. Restate this decision: There is /
is not sufficient evidence to
support the claim that…
Step 1 State the null and alternative
hypotheses and identify the claim (H0 , H1).
Step 2 Test Statistic (TS): Compute
the test statistic value that is relevant to
the test and determine its sampling
distribution (such as normal, t, χ²).
Step 3 P-value Method:
Find the P-value from the appropriate
table.
Step 4 Make the decision to
a. Reject or not reject the null
hypothesis.
b. The claim is true or false
c. Restate this decision: There is /
is not sufficient evidence to
support the claim that…
15. 15
1009 consumers were asked if they are comfortable with having drones deliver their
purchases, and 54% (or 545) of them responded with “no.” Use these results to test the
claim that most consumers are uncomfortable with drone deliveries. We interpret
“most” to mean “more than half” or “greater than 0.5.” (α = 0.05)
Example 6
Step 1:
State H0 , H1, Identify the claim & Tails
Step 2: TS
Calculate the test statistic (TS) that is
relevant to the test
Step 3: CV
Find the critical value /s using α
Step 4: Make the decision to
a. Reject or not H0
b. The claim is true or false
c. Restate this decision: There is / is not
sufficient evidence to support the claim
that…
Step 3: CV: α = 0.05 →CV: z = 1.645
Step 1: H0: p = 0.5, H1: p > 0.5, RTT, Claim
Given: BD, n = 1009, p = 0.5
→ q = 0.5, → np ≥ 5 and nq ≥
5 → Use ND, x = 545
𝑝 =
𝑥
𝑛
=
545
1009
= 0.540
Step 2: 𝑇𝑆: 𝑧 =
(545/1009)−0.5
0.5(0.5)
1009
𝑧 =
𝑝 − 𝑝
𝑝𝑞
𝑛
= 2.55
Step 4: Decision:
a. Reject H0
b. The claim is true
c. There is sufficient evidence to support the claim that the
majority of consumers are uncomfortable with drone deliveries.
16. Identify the test statistic that is relevant to the test and determine its
sampling distribution (such as z, t, χ²)
16
Parameter
Sampling
Distribution
Requirements Test Statistics
Proportion:
p
Normal (Z) 𝑛𝑝 ≥ 5, & 𝑛𝑞 ≥ 5
𝑍 =
𝑝 − 𝑝
𝑝𝑞/𝑛
Mean: 𝝁 t 𝝈 not known & Normally
Distributed Population or
𝑛 > 30
𝑡 =
𝑥 − 𝜇
𝑠/ 𝑛
Mean: 𝝁 Normal (Z) 𝝈 known & Normally
Distributed Population or
𝑛 > 30
𝑍 =
𝑥 − 𝜇
𝜎/ 𝑛
Standard
Deviation: 𝝈
Or Variance: 𝝈𝟐
𝝌𝟐 Normally Distributed
Population 𝜒2
=
(𝑛 − 1)𝑠2
𝜎2
17. Finding P-Value
17
P-value = probability of a test statistic at least as extreme as the one obtained
p = population proportion
𝑝: 𝑆𝑎𝑚𝑝𝑙𝑒 𝑃𝑟𝑜𝑝𝑜𝑟𝑡𝑖𝑜𝑛
Example 6 continued: RTT
Test statistic: z = 2.55
Right-tailed Test: p(z > 2.550) = 0.0054
( Normal distribution area to its right)
P-value of 0.0054.
Decision Criteria for the P-Value Method:
If P-value ≤ α, reject H0 (“If the P is low,
the null must go.”)
If P-value > α, fail to reject H0.
18. Example 7: Power of a Hypothesis (Time)
18
The power of a hypothesis test is the probability 1 − β of rejecting a false null
hypothesis. The value of the power is computed by using a particular significance level
α and a particular value of the population parameter that is an alternative to the value
assumed true in the null hypothesis.
Use a significance level of α = 0.05 and these particular value of p that is an alternative
to the value assumed in the null hypothesis H0: p = 0.5, to find the values of power of
the test.
p: 0.6, 0.7, 0.8, and 0.9.
Consider these preliminary results from the XSORT method of gender selection: There
were 13 girls among the 14 babies born to couples using the XSORT method. If we want
to test the claim that girls are more likely (p > 0.5) with the XSORT method, we have
the following null and alternative hypotheses:
H0: p = 0.5 H1: p > 0.5
19. Solution: The values of power in the following table were found by using
Minitab, and exact calculations are used instead of a normal approximation to the
binomial distribution. Specific Alternative
Value of p
β
Power of Test
= 1 − β
0.6 0.820 0.180
0.7 0.564 0.436
0.8 0.227 0.773
0.9 0.012 0.988
19
Example 7: Power of a Hypothesis
Interpretation: p = 0.7: There is a 0.436 probability of rejecting p = 0.5 when the true value of p is actually 0.7. It makes sense
that this test is more effective in rejecting the claim of p = 0.5 when the population proportion is actually 0.7 than when the
population proportion is actually 0.6.
In general, increasing the difference between the assumed parameter value and the actual parameter value results in an increase in
power.
Interpretation: p = 0.6: We see that this hypothesis test has
power of 0.180 (or 18.0%) of rejecting H0: p = 0.5 when the
population proportion p is actually 0.6. That is, if the true
population proportion is actually equal to 0.6, there is an 18.0%
chance of making the correct conclusion of rejecting the false null
hypothesis that p = 0.5. That low power of 18.0% is not so good.
Interpretation: p = 0.8: Just as 0.05 is a common choice for a significance level, a power of at least 0.80 is a common
requirement for determining that a hypothesis test is effective. (Some statisticians argue that the power should be higher, such as
0.85 or 0.90.) When designing an experiment, we might consider how much of a difference between the claimed value of a
parameter and its true value is an important amount of difference.
When designing an experiment, a goal of having a power value of at least 0.80 can often be used to determine the minimum
required sample size, as in the following example.
20. Example 8: Finding the Sample Size Required to Achieve 80% Power
A trial design assumed that with a 0.05 significance level, 153 randomly selected
subjects would be needed to achieve 80% power to detect a reduction in the
coronary heart disease rate from 0.5 to 0.4. From that statement, we know the
following:
• Before conducting the experiment, the researchers selected a significance level of 0.05
and a power of at least 0.80.
20
• The researchers decided that a reduction in the proportion of coronary heart disease
from 0.5 to 0.4 is an important difference that they wanted to detect.
• Using a significance level of 0.05, power of 0.80, and the alternative proportion of 0.4,
technology such as Minitab is used to find that the required minimum sample size is
153.
The researchers can then proceed by obtaining a sample of at least 153 randomly
selected subjects. Because of factors such as dropout rates, the researchers are
likely to need somewhat more than 153 subjects.
21. Example 1: Majority of Consumers are not Comfortable with
Drone Deliveries
Using Technology It is easy to obtain hypothesis-testing results using
technology. The accompanying screen displays show results from four
different technologies, so we can use computers or calculators to do all of
the computational heavy lifting.
21