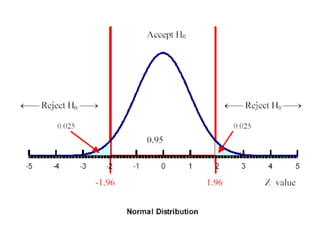
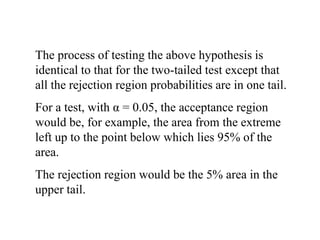
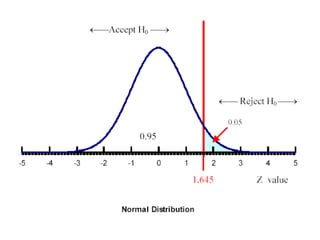
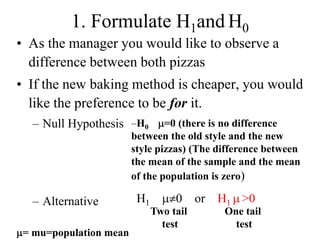
One-Sided or One-Tailed Hypothesis Tests


In most applications, a two-sided or two-tailed hypothesis test
is the most appropriate approach. This approach is based on
the expression of the null and alternative hypotheses as
follows:
               H0:    = 170 vs H1:    ≠ 170
To test the above hypothesis, we set up the rejection and
acceptance regions as shown on the next slide, where we are
using = 0.05.
Accept H0


Reject H0               Reject H0
  0.025
              0.95         0.025


                 Z
In this example, the rejection region
probabilities are equally split between the two
tails, thus the reason for the label as a two-
tailed test.
This procedure allows the possibility of
rejecting the null hypothesis, but does not
specifically address, in the sense of statistical
significance, the direction of the difference
detected.
The difference between the two has to do with how
the null hypothesis is expressed and the implication
of this expression.
The first expression above is the more theoretically
correct one and carries with it the clear connotation
that an outcome in the opposite direction of the
alternative hypothesis is not considered possible.
This is, in fact, the way the test is actually done.
The process of testing the above hypothesis is
identical to that for the two-tailed test except that
all the rejection region probabilities are in one tail.
For a test, with α = 0.05, the acceptance region
would be, for example, the area from the extreme
left up to the point below which lies 95% of the
area.
The rejection region would be the 5% area in the
upper tail.
The Experiment
• For 40 randomly selected customers who order a
  pepperoni pizza for home delivery, he includes both
  an old style and a free new style pizza in the order.
• All he asks is that these customers rate the difference
  between pizzas on a -10 to +10 scale, where -10
  means they strongly favor the old style, +10 means
  they strongly favor the new style, and 0 means they
  are indifferent between the two styles.

Old pizza                                         New pizza


  -10                         0                      +10
1. Formulate H1and H0
  One-Tailed Versus Two-Tailed Tests
• The form of the alternative hypothesis can be either a
  one-tailed or two-tailed, depending on what you are
  trying to prove.
• A one-tailed hypothesis is one where the only sample
  results which can lead to rejection of the null hypothesis
  are those in a particular direction, namely, those where
  the sample mean rating is positive.
• A two-tailed test is one where results in either of two
  directions can lead to rejection of the null hypothesis.
1. Formulate H1and H0
 One-Tailed Versus Two-Tailed Tests -- continued

• Once the hypotheses are set up, it is easy to detect
  whether the test is one-tailed or two-tailed.
• One tailed alternatives are phrased in terms of “>” or
  “<“ whereas two tailed alternatives are phrased in
  terms of “ ”
• The real question is whether to set up hypotheses for
  a particular problem as one-tailed or two-tailed.
• There is no statistical answer to this question. It
  depends entirely on what we are trying to prove.
1. Formulate H1and H0
• As the manager you would like to observe a
  difference between both pizzas
• If the new baking method is cheaper, you would
  like the preference to be for it.
  – Null Hypothesis –H0         =0 (there is no difference
                        between the old style and the new
                        style pizzas) (The difference between
                        the mean of the sample and the mean
                        of the population is zero)

  – Alternative          H1        0     or   H1 >0
                              Two tail        One tail
                                test            test
 = mu=population mean

One sided or one-tailed tests

  • 1.
    One-Sided or One-TailedHypothesis Tests In most applications, a two-sided or two-tailed hypothesis test is the most appropriate approach. This approach is based on the expression of the null and alternative hypotheses as follows: H0: = 170 vs H1: ≠ 170 To test the above hypothesis, we set up the rejection and acceptance regions as shown on the next slide, where we are using = 0.05.
  • 2.
    Accept H0 Reject H0 Reject H0 0.025 0.95 0.025 Z
  • 3.
    In this example,the rejection region probabilities are equally split between the two tails, thus the reason for the label as a two- tailed test. This procedure allows the possibility of rejecting the null hypothesis, but does not specifically address, in the sense of statistical significance, the direction of the difference detected.
  • 4.
    The difference betweenthe two has to do with how the null hypothesis is expressed and the implication of this expression. The first expression above is the more theoretically correct one and carries with it the clear connotation that an outcome in the opposite direction of the alternative hypothesis is not considered possible. This is, in fact, the way the test is actually done.
  • 5.
    The process oftesting the above hypothesis is identical to that for the two-tailed test except that all the rejection region probabilities are in one tail. For a test, with α = 0.05, the acceptance region would be, for example, the area from the extreme left up to the point below which lies 95% of the area. The rejection region would be the 5% area in the upper tail.
  • 7.
    The Experiment • For40 randomly selected customers who order a pepperoni pizza for home delivery, he includes both an old style and a free new style pizza in the order. • All he asks is that these customers rate the difference between pizzas on a -10 to +10 scale, where -10 means they strongly favor the old style, +10 means they strongly favor the new style, and 0 means they are indifferent between the two styles. Old pizza New pizza -10 0 +10
  • 8.
    1. Formulate H1andH0 One-Tailed Versus Two-Tailed Tests • The form of the alternative hypothesis can be either a one-tailed or two-tailed, depending on what you are trying to prove. • A one-tailed hypothesis is one where the only sample results which can lead to rejection of the null hypothesis are those in a particular direction, namely, those where the sample mean rating is positive. • A two-tailed test is one where results in either of two directions can lead to rejection of the null hypothesis.
  • 9.
    1. Formulate H1andH0 One-Tailed Versus Two-Tailed Tests -- continued • Once the hypotheses are set up, it is easy to detect whether the test is one-tailed or two-tailed. • One tailed alternatives are phrased in terms of “>” or “<“ whereas two tailed alternatives are phrased in terms of “ ” • The real question is whether to set up hypotheses for a particular problem as one-tailed or two-tailed. • There is no statistical answer to this question. It depends entirely on what we are trying to prove.
  • 10.
    1. Formulate H1andH0 • As the manager you would like to observe a difference between both pizzas • If the new baking method is cheaper, you would like the preference to be for it. – Null Hypothesis –H0 =0 (there is no difference between the old style and the new style pizzas) (The difference between the mean of the sample and the mean of the population is zero) – Alternative H1 0 or H1 >0 Two tail One tail test test = mu=population mean