Download to read offline


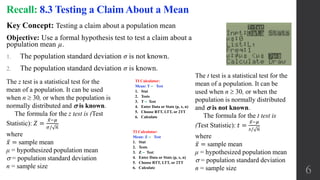
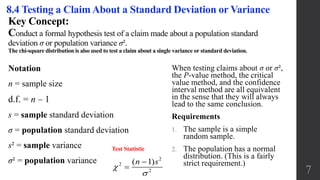
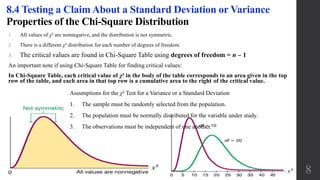
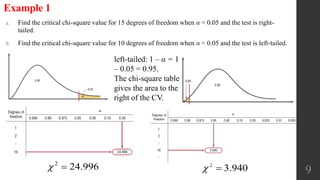
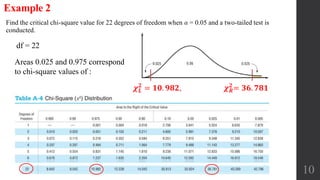
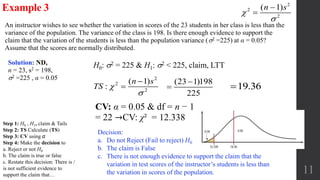
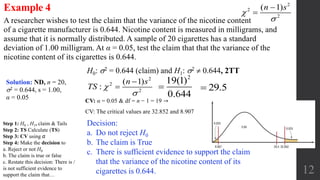

This document discusses hypothesis testing of claims about population standard deviations and variances. It provides the steps to conduct hypothesis tests of such claims using the chi-square distribution. The chi-square test can be used to test if a sample variance or standard deviation is significantly different from a claimed population variance or standard deviation. Examples show how to identify the null and alternative hypotheses, calculate the test statistic, find the critical value, and make a decision to reject or fail to reject the null hypothesis based on the test statistic and critical value.


