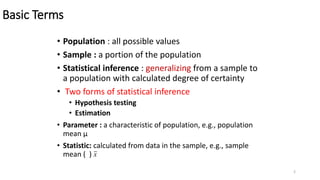
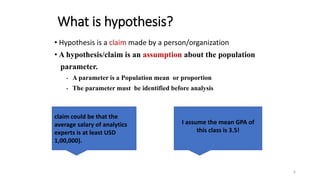
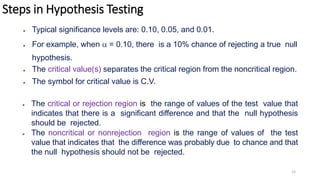
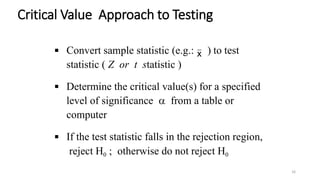
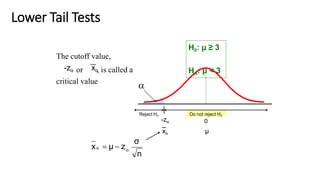
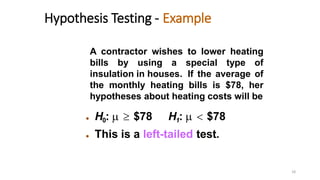
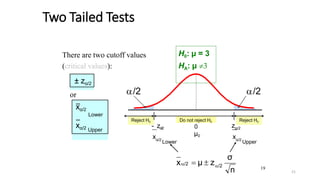
Data Science
UNIT-I
Hypothesis and Inference
(Introduction, Z-Test, P-Test, T-Test)
1
Basic Terms
• Population : all possible values
• Sample : a portion of the population
• Statistical inference : generalizing from a sample to
a population with calculated degree of certainty
• Two forms of statistical inference
• Hypothesis testing
• Estimation
• Parameter : a characteristic of population, e.g., population
mean µ
• Statistic: calculated from data in the sample, e.g., sample
mean ( )
2
x
Examples:
Population vs sample
Population Sample
Advertisements for IT jobs in the India The top 50 search results for
advertisements for IT jobs in the
India on May 1, 2020
Songs from the Eurovision Song
Contest
Winning songs from the Eurovision
Song Contest that were performed
in English
Undergraduate students in the India 300 undergraduate students from
three TG,AP,TN universities who
volunteer for your psychology
research study
All countries of the world Countries with published data
available on birth rates and GDP
since 2000
3
What is hypothesis?
• Hypothesis is a claim made by a person/organization
• A hypothesis/claim is an assumption about the population
parameter.
• A parameter is a Population mean or proportion
• The parameter must be identified before analysis.
4
I assume the mean GPA of
this class is 3.5!
claim could be that the
average salary of analytics
experts is at least USD
1,00,000).
Hypothesis Testing
• Is also called significance testing
• Tests a claim about a parameter using evidence from
a sample for the support of the claim
• Hypothesis testing is a technique to help determine
whether a specific treatment influences the
individuals in a population.
• The technique is introduced by considering a one-
sample z test
5
6
7
8
9
24
10





1. Specify the population value of interest
2.Formulate the appropriate null and
alternative hypotheses
3. Specify the desired level of significance
4. Determine the rejection region
5.Obtain sample evidence and compute the
test statistic
 6. Reach a decision and interpret the result
Steps in Hypothesis Testing
●
●
A Statistical hypothesis is a conjecture about a population
parameter.This conjecture may or may not be true.
The null hypothesis, symbolized by H0, is a statistical
hypothesis that states that there is no difference between a
parameter and a specific value or that there is no difference
between two parameters.
The alternative hypothesis, symbolized by H1, is a
statistical hypothesis that states a specific difference
between a parameter and a specific value or states that
there is a difference between two parameters.
11
Steps in Hypothesis Testing
12
● A statistical test uses the data obtained from a
sample to make a decision about whether or not
the null hypothesis should be rejected.
● The numerical value obtained from a statistical
test is called the test value.
● In the hypothesis-testing situation, there are four
possible outcomes.
● In reality, the null hypothesis may or may not be
true, and a decision is made to reject or not to reject
it on the basis of the data obtained from a sample.
Error
Type I
Correct
decision
Correct
decision
Error
Type II
Steps in Hypothesis Testing
H0 True H0 False
Reject
H0
Do not
reject
H0
13
Steps in Hypothesis Testing
14
● A type I error occurs if one rejects the null hypothesis when
it is true.
● A type II error occurs if one does not reject the null
hypothesis when it is false.
The level of significance is the maximum probability of
committing a type I error.
This probability is symbolized by  (Greek letter alpha).
That is, P(type I error)=.
P(type II error) =  (Greek letter beta).
Steps in Hypothesis Testing
15
● Typical significance levels are: 0.10, 0.05, and 0.01.
● For example, when  = 0.10, there is a 10% chance of rejecting a true null
hypothesis.
● The critical value(s) separates the critical region from the noncritical region.
● The symbol for critical value is C.V.
● The critical or rejection region is the range of values of the test value that
indicates that there is a significant difference and that the null hypothesis
should be rejected.
● The noncritical or nonrejection region is the range of values of the test
value that indicates that the difference was probably due to chance and that
the null hypothesis should not be rejected.
Critical Value Approach to Testing
16

 Determine the critical value(s) for a specified
level of significance  from a table or
computer
 If the test statistic falls in the rejection region,
reject H0 ; otherwise do not reject H0
Convert sample statistic (e.g.: x ) to test
statistic ( Z or t statistic )
Reject H0 Do not reject H0
Lower Tail Tests

-zα
xα
The cutoff value,
-zα or xα
, is called a
critical value
0
μ
H0: μ ≥ 3
HA: μ < 3
n
σ

x  μ  z
Hypothesis Testing - Example
18
A contractor wishes to lower heating
bills by using a special type of
insulation in houses. If the average of
the monthly heating bills is $78, her
hypotheses about heating costs will be
● H0:   $78 H1:   $78
● This is a left-tailed test.
Reject H0
Do not reject H0
The cutoff value,
critical value
Upper Tail Tests

zα
xα
zα or x, is called a
α
0
μ
H0: μ ≤ 3
HA: μ > 3
n
σ

x  μ  z
Hypothesis Testing - Example
20
A chemist invents an additive to
increase the life of an automobile
battery. If the mean lifetime of the
battery is 36 months, then his
hypotheses are
H0:   36 H1:   36
This is a right-tailed test.
19
Do not reject H0 Reject H0
Reject H0
There are two cutoff values
(critical values):
or
Two Tailed Tests
21
/2
- zα/2
x
± zα/2
0
μ0
H0: μ = 3
HA: μ 3
zα/2
x
n
σ
/2
x/2  μ  z
xα/2
Lower
xα/2 Upper
α/2
Lower α/2
Upper
/2
Hypothesis Testing - Example
22
A medical researcher is interested in finding out
whether a new medication will have any
undesirable side effects. The researcher is
particularly concerned with the pulse rate of the
patients who take the medication.
What are the hypotheses to test whether the
pulse rate will be different from the mean pulse
rate of 82 beats per minute?
● H0:  = 82 H1:   82
● This is a two-tailed test.
23
24
25
26
27
28
29
30
31
32
33
34
35
36
37
38

Data Science : Unit-I -Hypothesis and Inferences.pptx

  • 1.
    Data Science UNIT-I Hypothesis andInference (Introduction, Z-Test, P-Test, T-Test) 1
  • 2.
    Basic Terms • Population: all possible values • Sample : a portion of the population • Statistical inference : generalizing from a sample to a population with calculated degree of certainty • Two forms of statistical inference • Hypothesis testing • Estimation • Parameter : a characteristic of population, e.g., population mean µ • Statistic: calculated from data in the sample, e.g., sample mean ( ) 2 x
  • 3.
    Examples: Population vs sample PopulationSample Advertisements for IT jobs in the India The top 50 search results for advertisements for IT jobs in the India on May 1, 2020 Songs from the Eurovision Song Contest Winning songs from the Eurovision Song Contest that were performed in English Undergraduate students in the India 300 undergraduate students from three TG,AP,TN universities who volunteer for your psychology research study All countries of the world Countries with published data available on birth rates and GDP since 2000 3
  • 4.
    What is hypothesis? •Hypothesis is a claim made by a person/organization • A hypothesis/claim is an assumption about the population parameter. • A parameter is a Population mean or proportion • The parameter must be identified before analysis. 4 I assume the mean GPA of this class is 3.5! claim could be that the average salary of analytics experts is at least USD 1,00,000).
  • 5.
    Hypothesis Testing • Isalso called significance testing • Tests a claim about a parameter using evidence from a sample for the support of the claim • Hypothesis testing is a technique to help determine whether a specific treatment influences the individuals in a population. • The technique is introduced by considering a one- sample z test 5
  • 6.
  • 7.
  • 8.
  • 9.
  • 10.
    24 10      1. Specify thepopulation value of interest 2.Formulate the appropriate null and alternative hypotheses 3. Specify the desired level of significance 4. Determine the rejection region 5.Obtain sample evidence and compute the test statistic  6. Reach a decision and interpret the result Steps in Hypothesis Testing
  • 11.
    Steps in HypothesisTesting ● ● A Statistical hypothesis is a conjecture about a population parameter.This conjecture may or may not be true. The null hypothesis, symbolized by H0, is a statistical hypothesis that states that there is no difference between a parameter and a specific value or that there is no difference between two parameters. The alternative hypothesis, symbolized by H1, is a statistical hypothesis that states a specific difference between a parameter and a specific value or states that there is a difference between two parameters. 11
  • 12.
    Steps in HypothesisTesting 12 ● A statistical test uses the data obtained from a sample to make a decision about whether or not the null hypothesis should be rejected. ● The numerical value obtained from a statistical test is called the test value. ● In the hypothesis-testing situation, there are four possible outcomes. ● In reality, the null hypothesis may or may not be true, and a decision is made to reject or not to reject it on the basis of the data obtained from a sample.
  • 13.
    Error Type I Correct decision Correct decision Error Type II Stepsin Hypothesis Testing H0 True H0 False Reject H0 Do not reject H0 13
  • 14.
    Steps in HypothesisTesting 14 ● A type I error occurs if one rejects the null hypothesis when it is true. ● A type II error occurs if one does not reject the null hypothesis when it is false. The level of significance is the maximum probability of committing a type I error. This probability is symbolized by  (Greek letter alpha). That is, P(type I error)=. P(type II error) =  (Greek letter beta).
  • 15.
    Steps in HypothesisTesting 15 ● Typical significance levels are: 0.10, 0.05, and 0.01. ● For example, when  = 0.10, there is a 10% chance of rejecting a true null hypothesis. ● The critical value(s) separates the critical region from the noncritical region. ● The symbol for critical value is C.V. ● The critical or rejection region is the range of values of the test value that indicates that there is a significant difference and that the null hypothesis should be rejected. ● The noncritical or nonrejection region is the range of values of the test value that indicates that the difference was probably due to chance and that the null hypothesis should not be rejected.
  • 16.
    Critical Value Approachto Testing 16   Determine the critical value(s) for a specified level of significance  from a table or computer  If the test statistic falls in the rejection region, reject H0 ; otherwise do not reject H0 Convert sample statistic (e.g.: x ) to test statistic ( Z or t statistic )
  • 17.
    Reject H0 Donot reject H0 Lower Tail Tests  -zα xα The cutoff value, -zα or xα , is called a critical value 0 μ H0: μ ≥ 3 HA: μ < 3 n σ  x  μ  z
  • 18.
    Hypothesis Testing -Example 18 A contractor wishes to lower heating bills by using a special type of insulation in houses. If the average of the monthly heating bills is $78, her hypotheses about heating costs will be ● H0:   $78 H1:   $78 ● This is a left-tailed test.
  • 19.
    Reject H0 Do notreject H0 The cutoff value, critical value Upper Tail Tests  zα xα zα or x, is called a α 0 μ H0: μ ≤ 3 HA: μ > 3 n σ  x  μ  z
  • 20.
    Hypothesis Testing -Example 20 A chemist invents an additive to increase the life of an automobile battery. If the mean lifetime of the battery is 36 months, then his hypotheses are H0:   36 H1:   36 This is a right-tailed test.
  • 21.
    19 Do not rejectH0 Reject H0 Reject H0 There are two cutoff values (critical values): or Two Tailed Tests 21 /2 - zα/2 x ± zα/2 0 μ0 H0: μ = 3 HA: μ 3 zα/2 x n σ /2 x/2  μ  z xα/2 Lower xα/2 Upper α/2 Lower α/2 Upper /2
  • 22.
    Hypothesis Testing -Example 22 A medical researcher is interested in finding out whether a new medication will have any undesirable side effects. The researcher is particularly concerned with the pulse rate of the patients who take the medication. What are the hypotheses to test whether the pulse rate will be different from the mean pulse rate of 82 beats per minute? ● H0:  = 82 H1:   82 ● This is a two-tailed test.
  • 23.
  • 24.
  • 25.
  • 26.
  • 27.
  • 28.
  • 29.
  • 30.
  • 31.
  • 32.
  • 33.
  • 34.
  • 35.
  • 36.
  • 37.
  • 38.

Editor's Notes