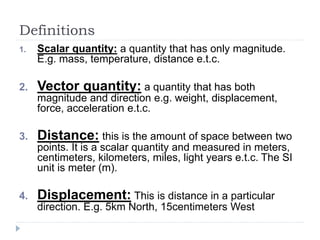
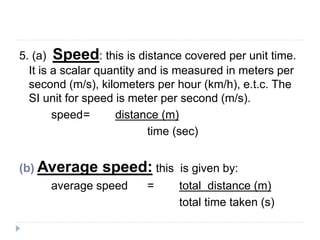
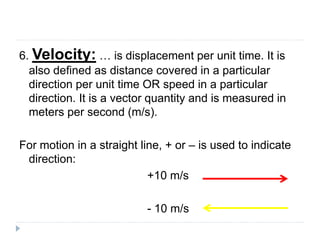
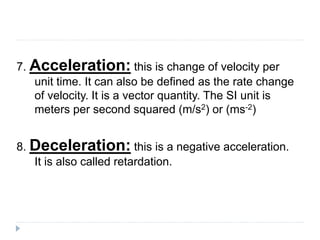
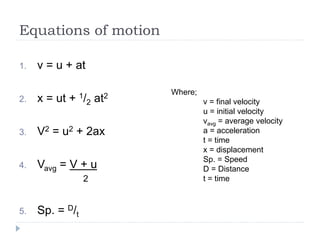
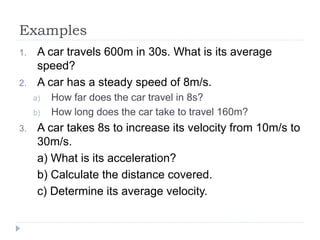
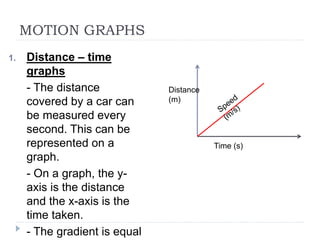
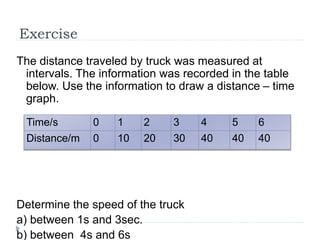
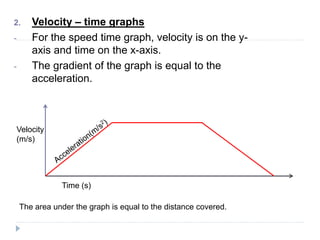
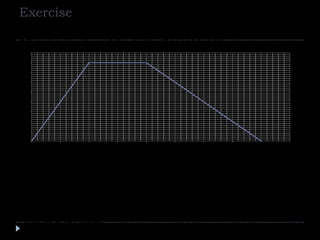
Speed, velocity and acceleration 
by: Chris Lembalemba 
(chrislembalemba@yahoo.com)
1. Scalar quantity 
2. Vector quantity 
3. Distance 
4. Displacement 
5. Speed 
6. Velocity 
7. Acceleration 
8. Deceleration
Definitions 
1. Scalar quantity: a quantity that has only magnitude. 
E.g. mass, temperature, distance e.t.c. 
2. Vector quantity: a quantity that has both 
magnitude and direction e.g. weight, displacement, 
force, acceleration e.t.c. 
3. Distance: this is the amount of space between two 
points. It is a scalar quantity and measured in meters, 
centimeters, kilometers, miles, light years e.t.c. The SI 
unit is meter (m). 
4. Displacement: This is distance in a particular 
direction. E.g. 5km North, 15centimeters West
5. (a) Speed: this is distance covered per unit time. 
It is a scalar quantity and is measured in meters per 
second (m/s), kilometers per hour (km/h), e.t.c. The 
SI unit for speed is meter per second (m/s). 
speed= distance (m) 
time (sec) 
(b) Average speed: this is given by: 
average speed = total distance (m) 
total time taken (s)
6. Velocity: … is displacement per unit time. It is 
also defined as distance covered in a particular 
direction per unit time OR speed in a particular 
direction. It is a vector quantity and is measured in 
meters per second (m/s). 
For motion in a straight line, + or – is used to indicate 
direction: 
+10 m/s 
- 10 m/s
7. Acceleration: this is change of velocity per 
unit time. It can also be defined as the rate change 
of velocity. It is a vector quantity. The SI unit is 
meters per second squared (m/s2) or (ms-2) 
8. Deceleration: this is a negative acceleration. 
It is also called retardation.
Equations of motion 
1. v = u + at 
2. x = ut + 1/2 at2 
3. V2 = u2 + 2ax 
4. Vavg = V + u 
2 
5. Sp. = D/t 
Where; 
v = final velocity 
u = initial velocity 
vavg = average velocity 
a = acceleration 
t = time 
x = displacement 
Sp. = Speed 
D = Distance 
t = time
Examples 
1. A car travels 600m in 30s. What is its average 
speed? 
2. A car has a steady speed of 8m/s. 
a) How far does the car travel in 8s? 
b) How long does the car take to travel 160m? 
3. A car takes 8s to increase its velocity from 10m/s to 
30m/s. 
a) What is its acceleration? 
b) Calculate the distance covered. 
c) Determine its average velocity.
Revision exercise 1.1
MOTION GRAPHS 
1. Distance – time 
graphs 
- The distance 
covered by a car can 
be measured every 
second. This can be 
represented on a 
graph. 
- On a graph, the y-axis 
is the distance 
and the x-axis is the 
time taken. 
- The gradient is equal 
Time (s) 
Distance 
(m)
Exercise 
The distance traveled by truck was measured at 
intervals. The information was recorded in the table 
below. Use the information to draw a distance – time 
graph. 
Time/s 0 1 2 3 4 5 6 
Distance/m 0 10 20 30 40 40 40 
Determine the speed of the truck 
a) between 1s and 3sec. 
b) between 4s and 6s
2. Velocity – time graphs 
- For the speed time graph, velocity is on the y-axis 
and time on the x-axis. 
- The gradient of the graph is equal to the 
acceleration. 
Time (s) 
Velocity 
(m/s) 
The area under the graph is equal to the distance covered.
example
Exercise 
Consider the velocity – time graph below. 
9 
8 
7 
6 
5 
4 
3 
2 
1 
0 
0 1 2 3 4 5 6 7 8 9 
velocity (m/s) 
time (s) 
1. Calculate the acceleration during the first 2 seconds. 
2. What is the acceleration between the 2nd and 4th seconds of the motion? 
3. Determine the deceleration. 
4. Calculate; 
a. Distance covered in the first 2 seconds 
b. Total distance covered 
5. Total distance covered

1.2 form 3 speed, velocity and acceleration

  • 1.
    Speed, velocity andacceleration by: Chris Lembalemba (chrislembalemba@yahoo.com)
  • 2.
    1. Scalar quantity 2. Vector quantity 3. Distance 4. Displacement 5. Speed 6. Velocity 7. Acceleration 8. Deceleration
  • 3.
    Definitions 1. Scalarquantity: a quantity that has only magnitude. E.g. mass, temperature, distance e.t.c. 2. Vector quantity: a quantity that has both magnitude and direction e.g. weight, displacement, force, acceleration e.t.c. 3. Distance: this is the amount of space between two points. It is a scalar quantity and measured in meters, centimeters, kilometers, miles, light years e.t.c. The SI unit is meter (m). 4. Displacement: This is distance in a particular direction. E.g. 5km North, 15centimeters West
  • 4.
    5. (a) Speed:this is distance covered per unit time. It is a scalar quantity and is measured in meters per second (m/s), kilometers per hour (km/h), e.t.c. The SI unit for speed is meter per second (m/s). speed= distance (m) time (sec) (b) Average speed: this is given by: average speed = total distance (m) total time taken (s)
  • 5.
    6. Velocity: …is displacement per unit time. It is also defined as distance covered in a particular direction per unit time OR speed in a particular direction. It is a vector quantity and is measured in meters per second (m/s). For motion in a straight line, + or – is used to indicate direction: +10 m/s - 10 m/s
  • 6.
    7. Acceleration: thisis change of velocity per unit time. It can also be defined as the rate change of velocity. It is a vector quantity. The SI unit is meters per second squared (m/s2) or (ms-2) 8. Deceleration: this is a negative acceleration. It is also called retardation.
  • 7.
    Equations of motion 1. v = u + at 2. x = ut + 1/2 at2 3. V2 = u2 + 2ax 4. Vavg = V + u 2 5. Sp. = D/t Where; v = final velocity u = initial velocity vavg = average velocity a = acceleration t = time x = displacement Sp. = Speed D = Distance t = time
  • 8.
    Examples 1. Acar travels 600m in 30s. What is its average speed? 2. A car has a steady speed of 8m/s. a) How far does the car travel in 8s? b) How long does the car take to travel 160m? 3. A car takes 8s to increase its velocity from 10m/s to 30m/s. a) What is its acceleration? b) Calculate the distance covered. c) Determine its average velocity.
  • 9.
  • 10.
    MOTION GRAPHS 1.Distance – time graphs - The distance covered by a car can be measured every second. This can be represented on a graph. - On a graph, the y-axis is the distance and the x-axis is the time taken. - The gradient is equal Time (s) Distance (m)
  • 11.
    Exercise The distancetraveled by truck was measured at intervals. The information was recorded in the table below. Use the information to draw a distance – time graph. Time/s 0 1 2 3 4 5 6 Distance/m 0 10 20 30 40 40 40 Determine the speed of the truck a) between 1s and 3sec. b) between 4s and 6s
  • 12.
    2. Velocity –time graphs - For the speed time graph, velocity is on the y-axis and time on the x-axis. - The gradient of the graph is equal to the acceleration. Time (s) Velocity (m/s) The area under the graph is equal to the distance covered.
  • 13.
  • 14.
    Exercise Consider thevelocity – time graph below. 9 8 7 6 5 4 3 2 1 0 0 1 2 3 4 5 6 7 8 9 velocity (m/s) time (s) 1. Calculate the acceleration during the first 2 seconds. 2. What is the acceleration between the 2nd and 4th seconds of the motion? 3. Determine the deceleration. 4. Calculate; a. Distance covered in the first 2 seconds b. Total distance covered 5. Total distance covered