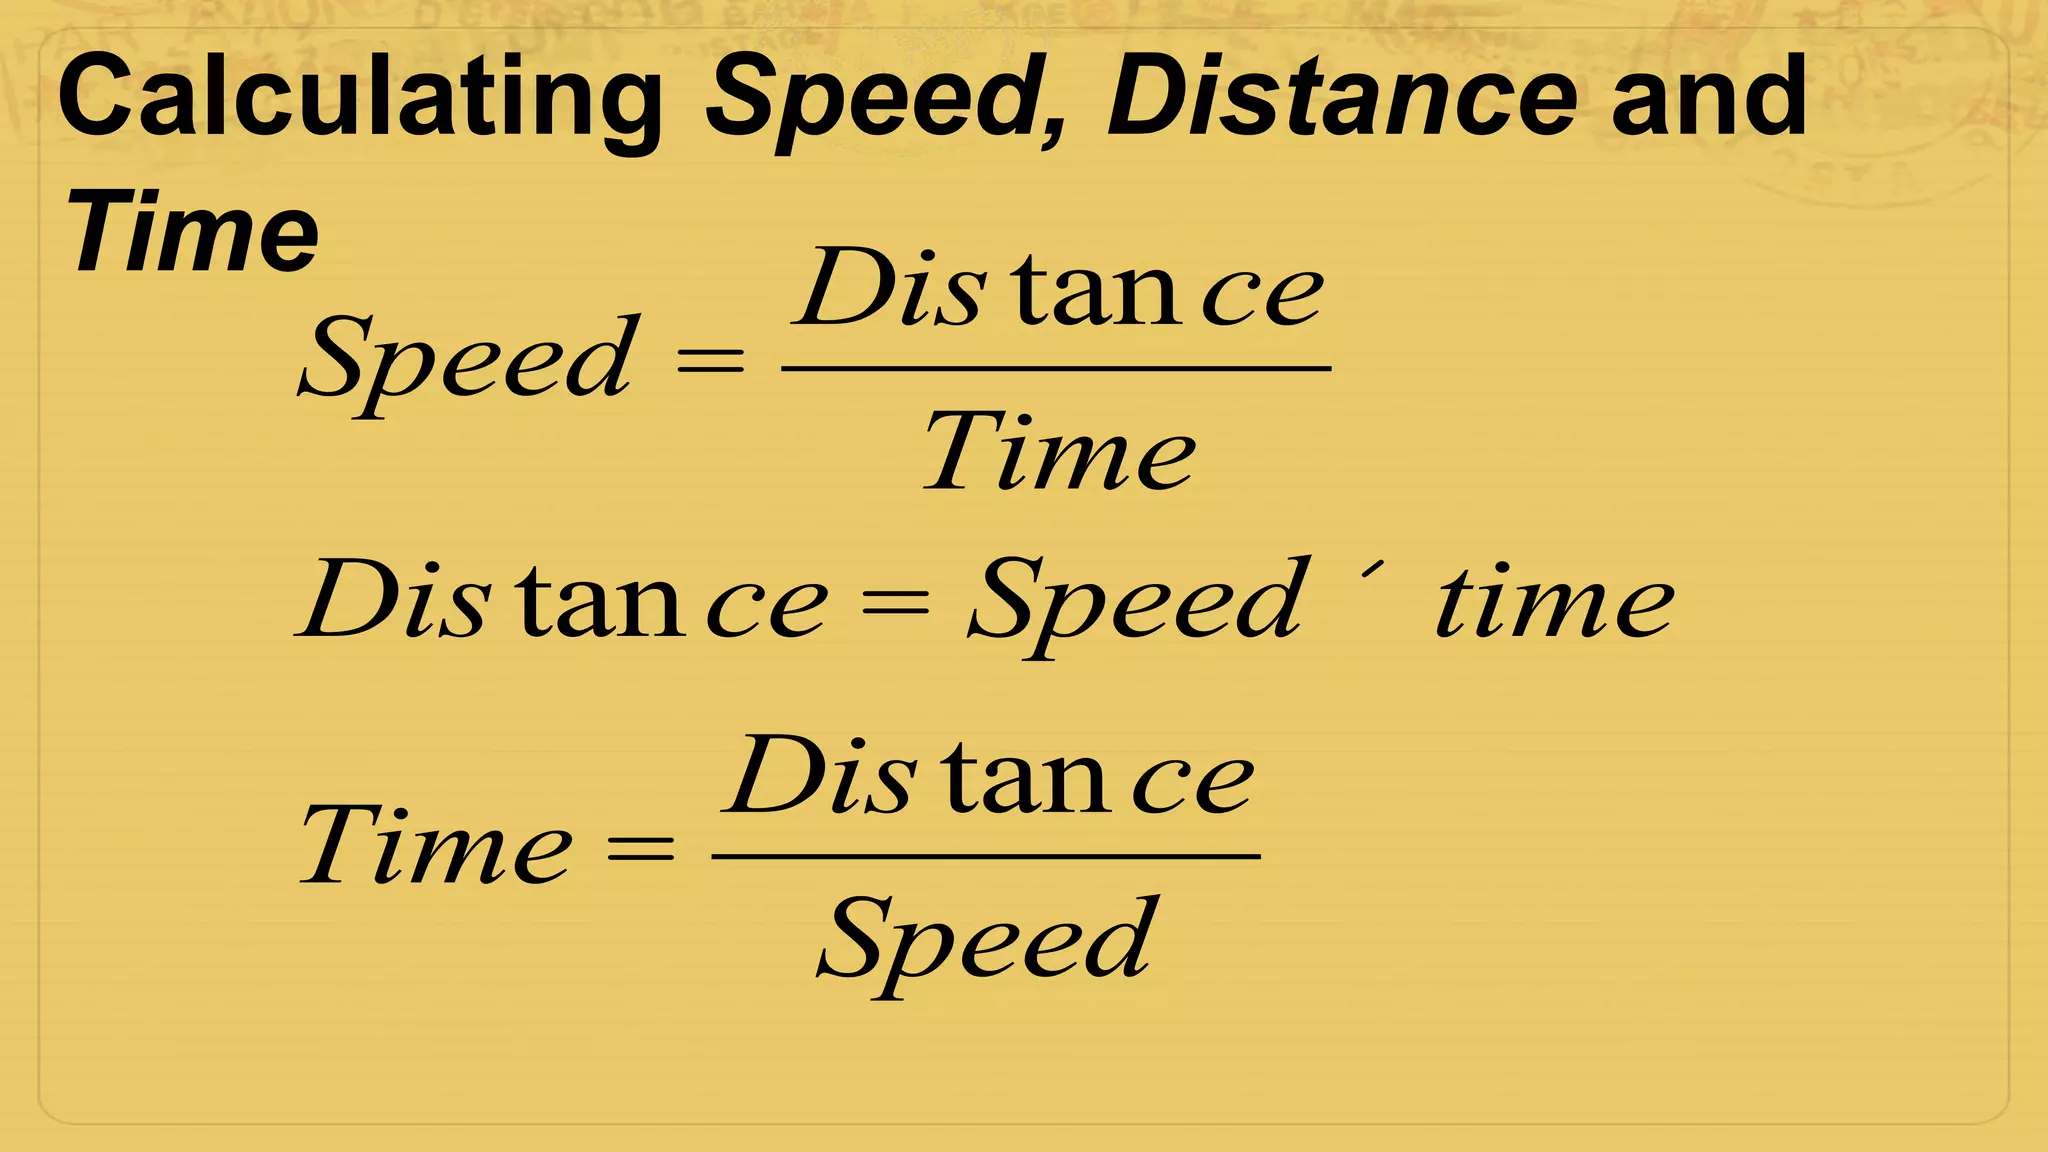
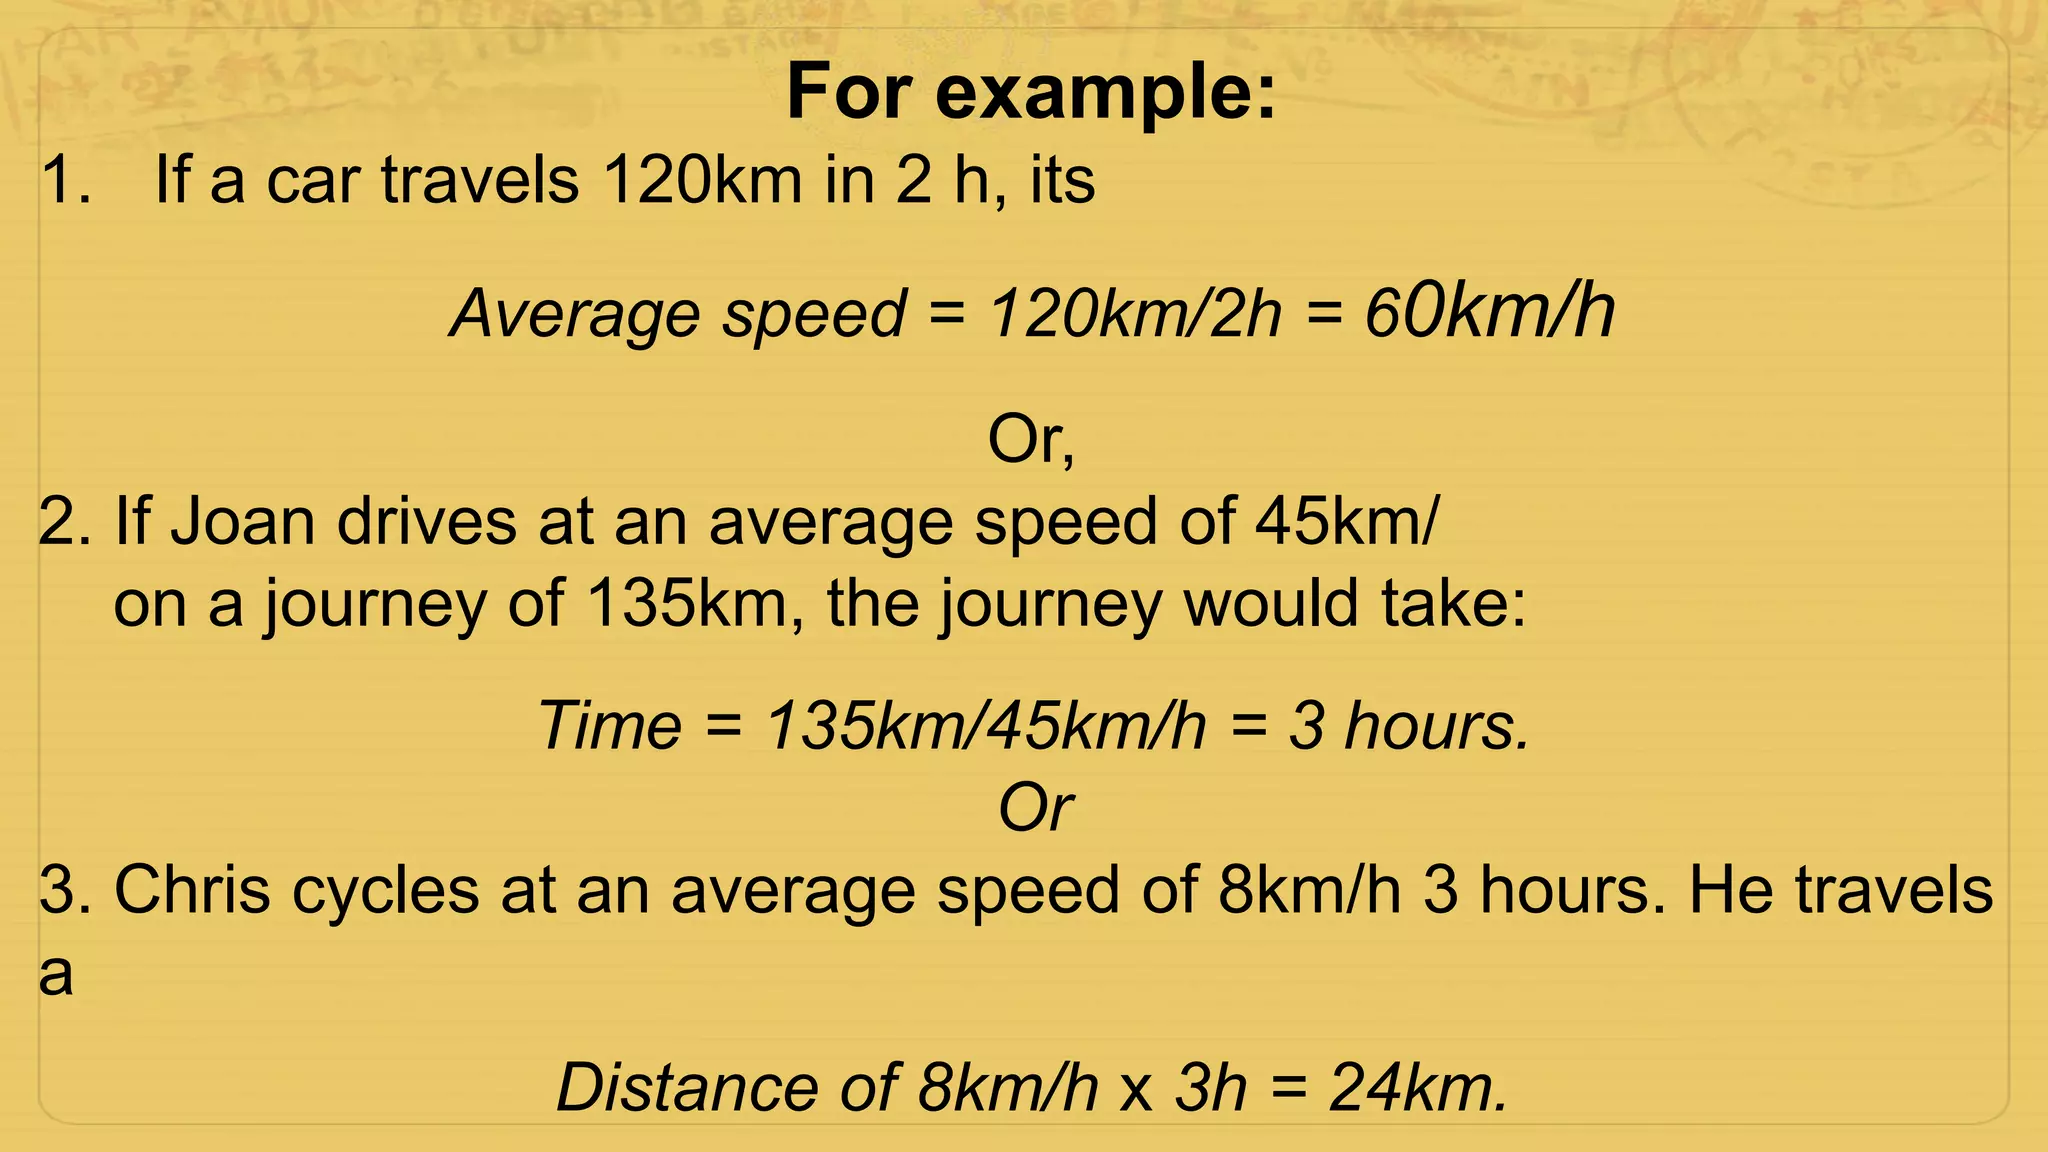
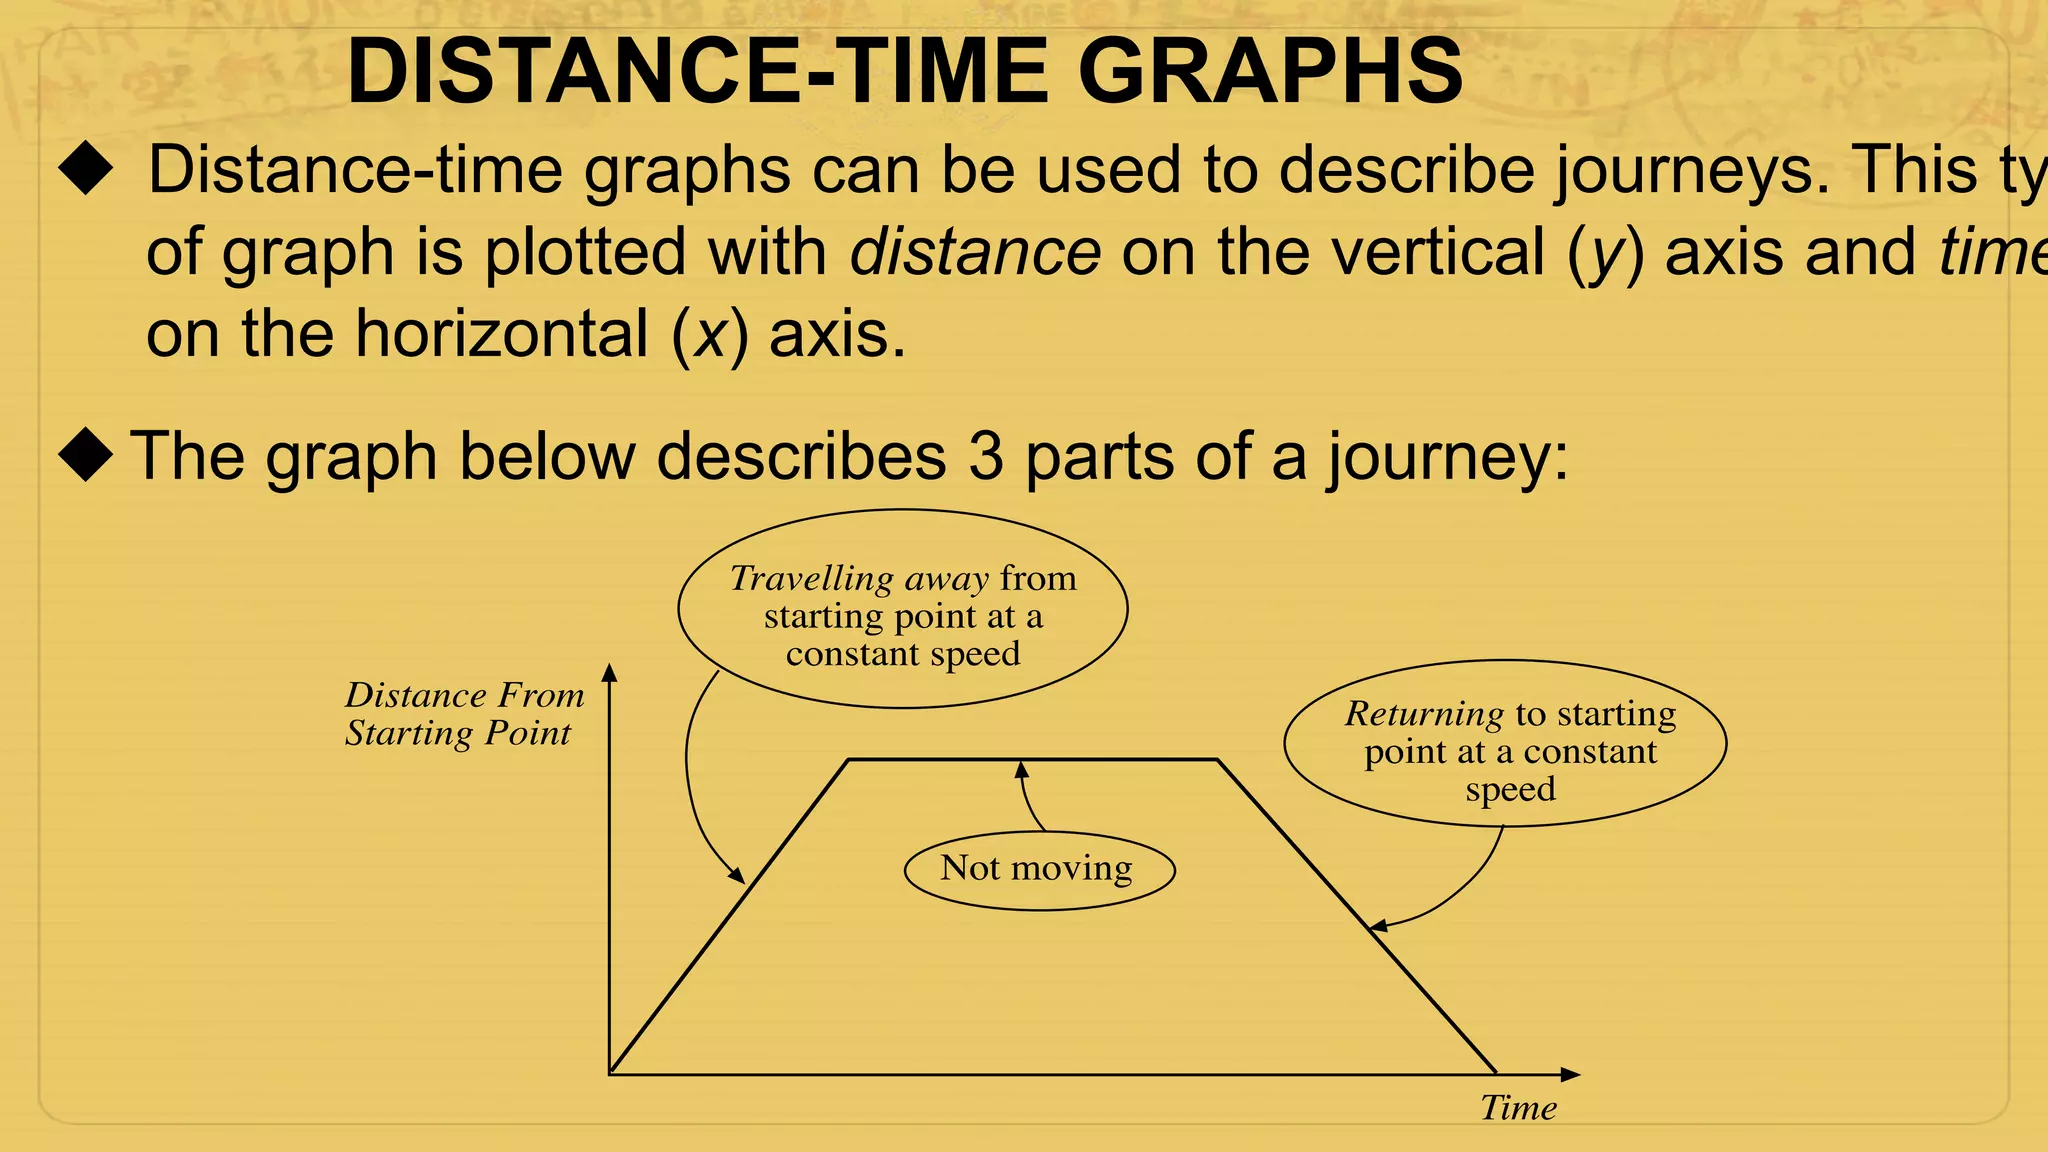
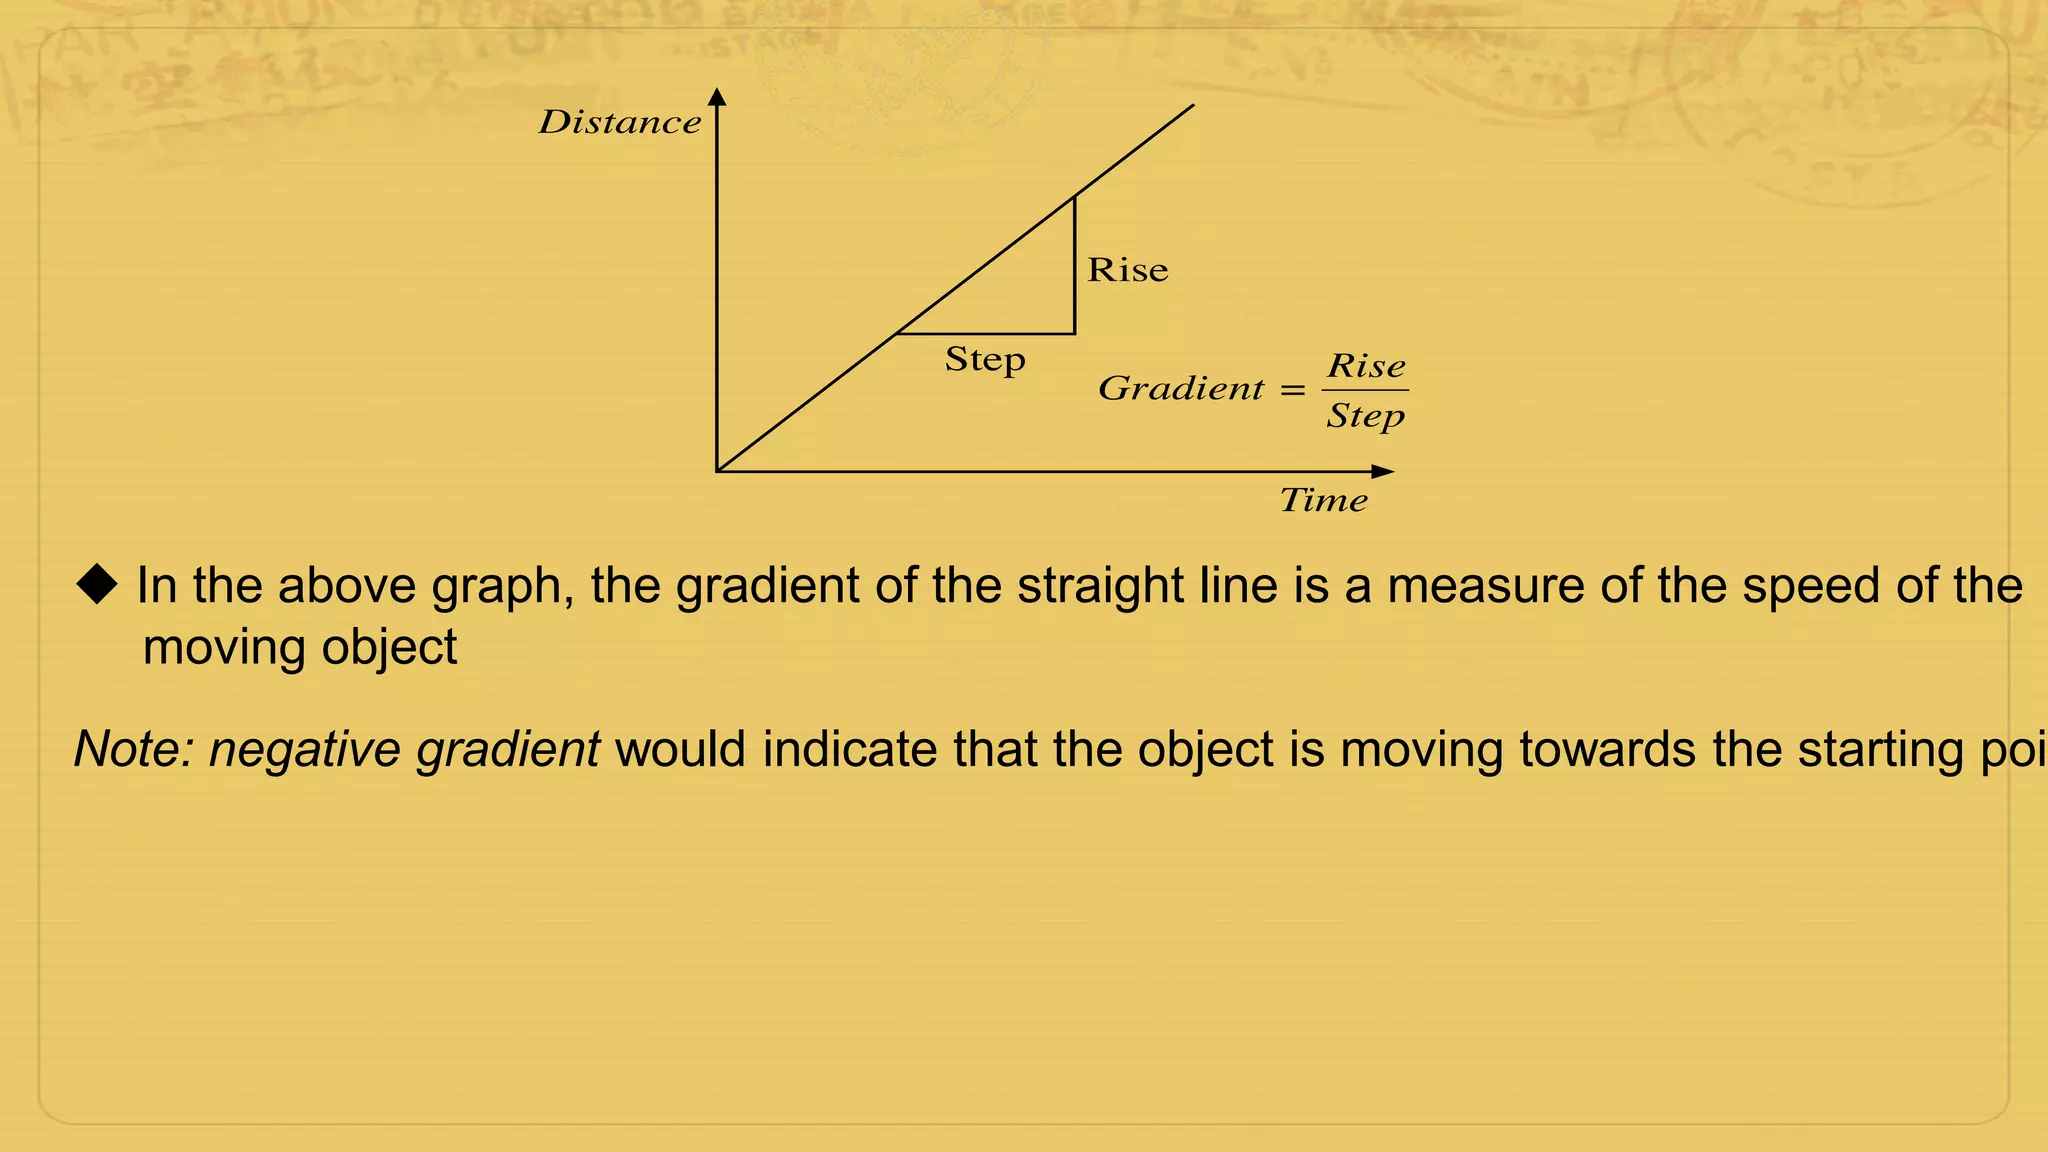
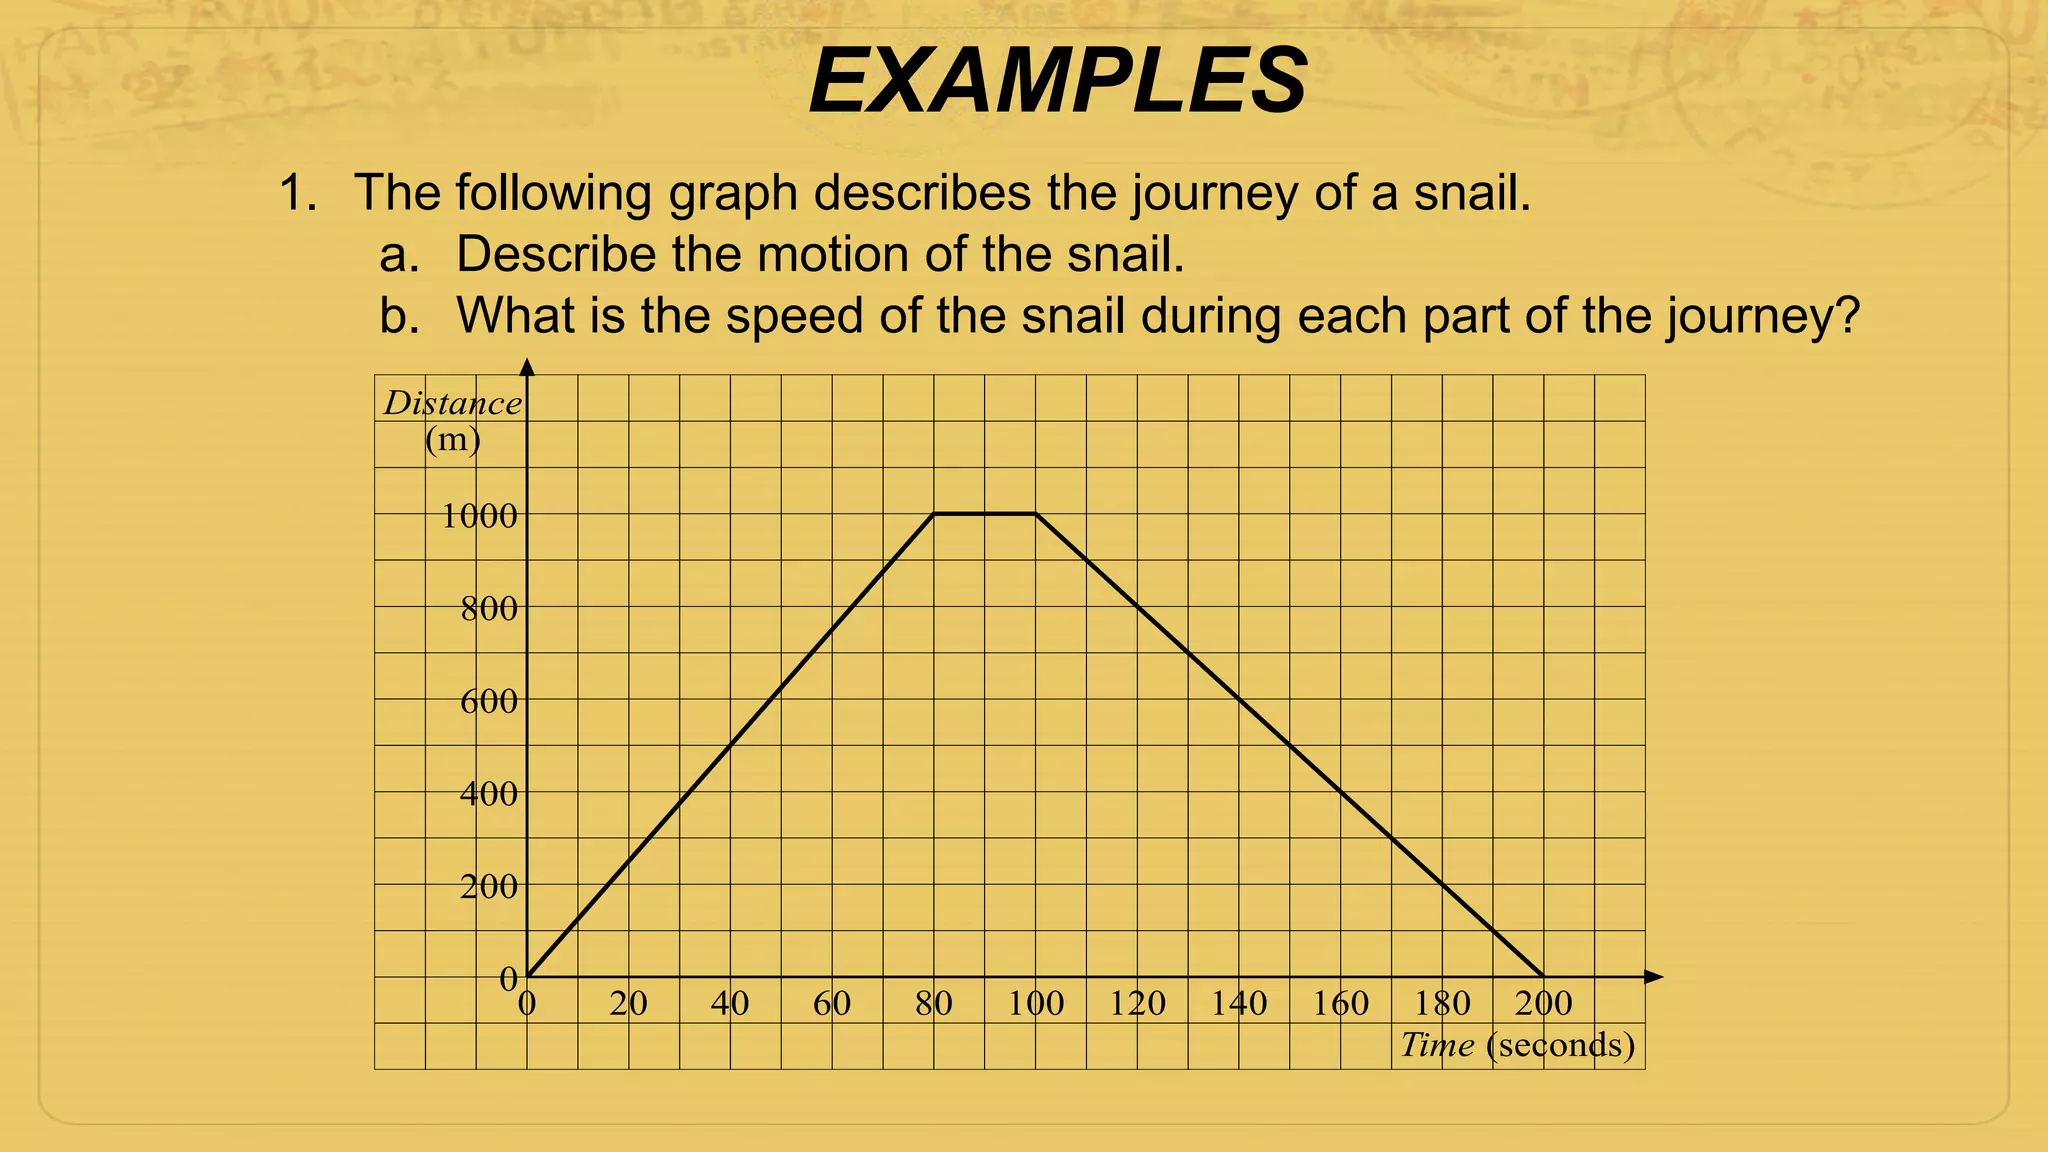
This document discusses key concepts relating to motion, including distance, time, speed, and their relationships. It aims to help students understand and apply these concepts using spreadsheets and graphs. Specifically, it explains that distance, speed, and time are inversely proportional, and provides formulas to calculate these values given two of the variables. The document also demonstrates how to represent motion graphically using distance-time and speed-time graphs, and how to interpret features of these graphs like slope, acceleration, and deceleration. Students are instructed to apply these concepts by plotting graphs in Excel and completing an assignment on Edmodo by the due date.
This presentation covers vertical motion under gravity, effect of air resistance on free fall & graphs of free fall. I hope this PPT will be helpful for instructors as well as students.
Learn about various motion graphs through interesting graphics.This ppt also includes questions from past papers.It is ideal for educators and students alike who can learn the concepts and their application at the ame time.
Because motion is most commonly described with respect to time, graphs with time on the x-axis and either distance, displacement or velocity on the y-axis are useful in describing motion. Such graphs are rich with information about the motion of an object and you should become familiar with their interpretation as well as how to draw them.
Science!
Physics
Notes on the topic - 'MOTION'. For Class:- 9th
{with ncert examples}
Created By - 'Neha Rohtagi'.
I hope that you will found this presentation useful and it will help you out for your concept understanding.
Thank You!
Please give feedbacks and suggestions to get presentations on more interesting topics.
This ppt was created by Dr Beka a lecture from Ekwendeni College of Health Sciences (ECoHS) Ekwendeni Mzimba Malawi. It is understandable and easy to read for students who are studying clinical medicine
After going through this module, you are expected to:
describe the motion of an object in terms of distance or displacement, speed or velocity and acceleration (S7FE-IIIa-1);
perform activities on speed, velocity and acceleration; and
compute for the speed, velocity and acceleration.
Motion - Distance time graphs and speed time graphs.pptxMehjabeenShaik1
Slideshow on distance time graphs and speed time graphs. It is very helpful for grades 7-9. It is very detailed. One stop for all graph types in science. Science graphs will become easy with this detailed ppt.
The PowerPoint presentation (ppt) under discussion proves to be an invaluable resource, offering a wealth of assistance and comprehensive details that cater to the needs of its audience. This presentation stands out as an exemplary tool, combining clarity, depth, and relevance to ensure a profound understanding of the subject matter.
One of the key strengths of this ppt lies in its helpful nature. Each slide is meticulously crafted to provide guidance and support, serving as a valuable companion for individuals seeking information on the topic at hand. The helpfulness of the presentation is evident in its ability to simplify complex concepts, breaking them down into digestible segments that promote a clear and accessible learning experience.
Moreover, the detailed nature of the presentation is a noteworthy aspect that sets it apart. The creators have invested time and effort into thorough research and exploration, resulting in a comprehensive compilation of information. The slides go beyond surface-level discussions, delving into nuanced aspects of the subject matter, thereby enriching the audience's knowledge and fostering a more profound comprehension of the material.
The attention to detail is evident not only in the content but also in the visual elements of the presentation. Graphics, charts, and illustrations complement the textual information, creating a multimedia experience that caters to diverse learning preferences. This meticulous detailing not only enhances the aesthetic appeal of the ppt but also reinforces key points, making the information more memorable and engaging.
Furthermore, the ppt's utility extends beyond a mere informational resource. Its detailed content serves as a valuable reference point for further exploration and study. The audience can delve into specific sections or revisit key concepts, reinforcing their understanding and facilitating a deeper grasp of the subject matter over time.
In conclusion, this PowerPoint presentation stands out as an invaluable educational tool, combining a helpful approach with meticulous detailing. Its clarity, depth, and relevance make it a go-to resource for individuals seeking a comprehensive understanding of the subject matter. Whether used for educational purposes, professional development, or personal enrichment, this ppt proves to be a reliable and effective guide, ensuring that its audience is not only informed but also empowered with knowledge. It is very catchy. The presentation's helpful and detailed nature is manifested in its strategic organization and seamless flow. The creators have thoughtfully structured the content, presenting information in a logical sequence that aids in the audience's comprehension. Each section builds upon the previous one.
Thank you lot
Dear Students of grade 8, this presentation has been made for you to revise, and to copy what would you miss out of your class work. I hope to be useful for all of you.
Biological screening of herbal drugs: Introduction and Need for
Phyto-Pharmacological Screening, New Strategies for evaluating
Natural Products, In vitro evaluation techniques for Antioxidants, Antimicrobial and Anticancer drugs. In vivo evaluation techniques
for Anti-inflammatory, Antiulcer, Anticancer, Wound healing, Antidiabetic, Hepatoprotective, Cardio protective, Diuretics and
Antifertility, Toxicity studies as per OECD guidelines
Introduction to AI for Nonprofits with Tapp NetworkTechSoup
Dive into the world of AI! Experts Jon Hill and Tareq Monaur will guide you through AI's role in enhancing nonprofit websites and basic marketing strategies, making it easy to understand and apply.
The French Revolution, which began in 1789, was a period of radical social and political upheaval in France. It marked the decline of absolute monarchies, the rise of secular and democratic republics, and the eventual rise of Napoleon Bonaparte. This revolutionary period is crucial in understanding the transition from feudalism to modernity in Europe.
For more information, visit-www.vavaclasses.com
Francesca Gottschalk - How can education support child empowerment.pptxEduSkills OECD
Francesca Gottschalk from the OECD’s Centre for Educational Research and Innovation presents at the Ask an Expert Webinar: How can education support child empowerment?
Acetabularia Information For Class 9 .docxvaibhavrinwa19
Acetabularia acetabulum is a single-celled green alga that in its vegetative state is morphologically differentiated into a basal rhizoid and an axially elongated stalk, which bears whorls of branching hairs. The single diploid nucleus resides in the rhizoid.
Honest Reviews of Tim Han LMA Course Program.pptxtimhan337
Personal development courses are widely available today, with each one promising life-changing outcomes. Tim Han’s Life Mastery Achievers (LMA) Course has drawn a lot of interest. In addition to offering my frank assessment of Success Insider’s LMA Course, this piece examines the course’s effects via a variety of Tim Han LMA course reviews and Success Insider comments.
Unit 8 - Information and Communication Technology (Paper I).pdfThiyagu K
This slides describes the basic concepts of ICT, basics of Email, Emerging Technology and Digital Initiatives in Education. This presentations aligns with the UGC Paper I syllabus.
Palestine last event orientationfvgnh .pptxRaedMohamed3
An EFL lesson about the current events in Palestine. It is intended to be for intermediate students who wish to increase their listening skills through a short lesson in power point.
The Roman Empire A Historical Colossus.pdfkaushalkr1407
The Roman Empire, a vast and enduring power, stands as one of history's most remarkable civilizations, leaving an indelible imprint on the world. It emerged from the Roman Republic, transitioning into an imperial powerhouse under the leadership of Augustus Caesar in 27 BCE. This transformation marked the beginning of an era defined by unprecedented territorial expansion, architectural marvels, and profound cultural influence.
The empire's roots lie in the city of Rome, founded, according to legend, by Romulus in 753 BCE. Over centuries, Rome evolved from a small settlement to a formidable republic, characterized by a complex political system with elected officials and checks on power. However, internal strife, class conflicts, and military ambitions paved the way for the end of the Republic. Julius Caesar’s dictatorship and subsequent assassination in 44 BCE created a power vacuum, leading to a civil war. Octavian, later Augustus, emerged victorious, heralding the Roman Empire’s birth.
Under Augustus, the empire experienced the Pax Romana, a 200-year period of relative peace and stability. Augustus reformed the military, established efficient administrative systems, and initiated grand construction projects. The empire's borders expanded, encompassing territories from Britain to Egypt and from Spain to the Euphrates. Roman legions, renowned for their discipline and engineering prowess, secured and maintained these vast territories, building roads, fortifications, and cities that facilitated control and integration.
The Roman Empire’s society was hierarchical, with a rigid class system. At the top were the patricians, wealthy elites who held significant political power. Below them were the plebeians, free citizens with limited political influence, and the vast numbers of slaves who formed the backbone of the economy. The family unit was central, governed by the paterfamilias, the male head who held absolute authority.
Culturally, the Romans were eclectic, absorbing and adapting elements from the civilizations they encountered, particularly the Greeks. Roman art, literature, and philosophy reflected this synthesis, creating a rich cultural tapestry. Latin, the Roman language, became the lingua franca of the Western world, influencing numerous modern languages.
Roman architecture and engineering achievements were monumental. They perfected the arch, vault, and dome, constructing enduring structures like the Colosseum, Pantheon, and aqueducts. These engineering marvels not only showcased Roman ingenuity but also served practical purposes, from public entertainment to water supply.
Macroeconomics- Movie Location
This will be used as part of your Personal Professional Portfolio once graded.
Objective:
Prepare a presentation or a paper using research, basic comparative analysis, data organization and application of economic information. You will make an informed assessment of an economic climate outside of the United States to accomplish an entertainment industry objective.
1. Objectives
At the end of this lesson, students will be able to:
1.Explain the relationship between
• Distance,
• Speed and
• Time
2.Use spreadsheets to show relationships and
present information clearly and/or succinctly
3. Draw appropriate type of graph, using excel,
to convey information
2. Motion
Motion is movement.
Many objects around us can move and if the speed of
these Objects can be determined, then their motion can
be measured.
3. Distance
Distance is how far it is between two points and is
measured in metres (m), kilometres (km) Or
millimetres (mm).
• The choice of unit would depend on how far is the
Distance to be or measured.
• Other multiple units often used in distance
measurement include mirometres (μM) and
nanometres (ηM)
4. Time
Time is a measure of how long it takes between two
events.
• It is often measured in seconds (s), minutes (min),
hours (h), days and weeks.
5. Speed
Speed is defined as how fast an object is moving or the
distance travelled in a given time
• Speed is measured in metres per second (m/s) or in
the case of a car, in kilometres per hour (km/h)
Velocity is speed in a given direction. The measurement
of velocity is important for ships at sea, aircraft and
inter-planetary space probes as it tells the speed and
direction of motion.
6. • When travelling in a car, the speed changes during the
journey. This may be due to slowing down at a
roundabout, a stop at a traffic light or travelling from a
Suburban road to the freeway etc.
• The speedometer of a car gives the speed of the car at
the instant of looking at it – this is the instantaneous
speed.
• The Police use radar guns to measure the
instantaneous speed of cars in motion on
the road.
7. Average Speed is the speed at which a car would trave
if it went at the same speed throughout a journey.
The relationship between distance, speed and time
can be expressed as follows:
Average speed = distance travelled/time taken
The relationship between
Distance, Speed and Time
9. For example:
1. If a car travels 120km in 2 h, its
Average speed = 120km/2h = 60km/h
Or,
2. If Joan drives at an average speed of 45km/
on a journey of 135km, the journey would take:
Time = 135km/45km/h = 3 hours.
Or
3. Chris cycles at an average speed of 8km/h 3 hours. He travels
a
Distance of 8km/h x 3h = 24km.
10. DISTANCE-TIME GRAPHS
Distance-time graphs can be used to describe journeys. This ty
of graph is plotted with distance on the vertical (y) axis and time
on the horizontal (x) axis.
The graph below describes 3 parts of a journey:
11. In the above graph, the gradient of the straight line is a measure of the speed of the
moving object
Note: negative gradient would indicate that the object is moving towards the starting poin
12. EXAMPLES
1. The following graph describes the journey of a snail.
a. Describe the motion of the snail.
b. What is the speed of the snail during each part of the journey?
MEP Y8 Practice Book B18.4
Example 1
The graph shows how far a child is from home.
Distance
(m)
200
400
0
600
800
1000
0 20 40 60 80 100 120 140 160 180 200
Time (seconds)
13. Solution:
a. The first part of the graph showed that the snail travelled away from the start point
for 1000 m in 80 s, at a constant speed.
The second part (horizontal) shows that the snail stopped for 20 s.
The third part shows the snail returning to the start point at a constant speed and
taking 100 s to do so.
b. During the first stage, the snail travelled with a:
Speed = 1000m/80 s = 12.5 m/s.
During the second stage, the speed of the snail was 0 as it was at rest.
And finally, the snail returned to the starting point at a
Speed of 1000 m/100 s = 10 m/s.
14. Speed-Time Graph
Speed-Time graphs are used to describe the distance travelled by an object.
They are plotted much the same like Distance-Time graphs. Time as the
independent variable is plotted on the x-axis while speed is plotted on the y-axis
Speed-Time graphs are also called Velocity-Time graphs.
Motion Graphs 7
SPEED-TIME GRAPHS
Speed-Time graphs are also called Velocity-Time graphs.
Speed-Time graphs look much like Distance-
Time graphs. Be sure to read the labels!!
Time is plotted on the X-axis. Speed or
velocity is plotted on the Y-axis.
A straight horizontal line on a speed-time
graph means that speed is constant. It is
not changing over time.
A straight line does not mean that the
object is not moving!
This graph, with a straight horizontal line shows constant speed
15. This graph shows increasing speed.
The moving object is accelerating.
This graph shows decreasing speed.
The moving object is decelerating.
This graph shows increasing speed.
The moving object is accelerating.
This graph shows decreasing speed.
The moving object is decelerating.
The graph shows that the speed of the
object is increasing or the object is accelerating.
This graph shows that the speed of
the object is decreasing or the object is decelerating.
In summary:
16. http://youtu.be/AcByglYNCqw
Please watch the YouTube video below to refresh your memory o
how to use excel to plot Distance-Time Graphs.
Note that the data set used in the video will be different from the
one in your topic test but the concept for plotting the graph is the
same.
In preparation for your class task:
17. Please logon to your group page on edmodo and complete the task in your.
This assignment will count for 10% towards your term 2 assessment and is
due .