Downloaded 206 times
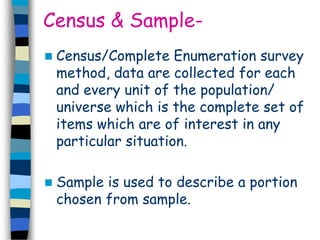
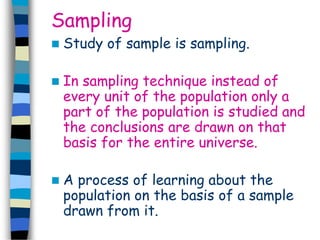
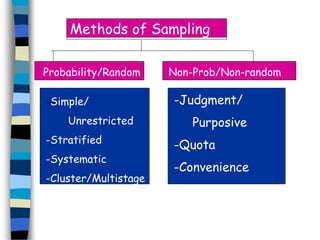
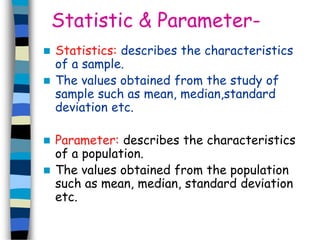
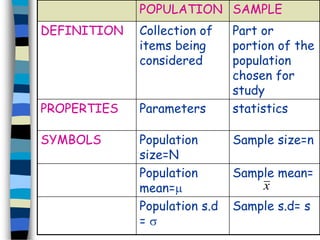
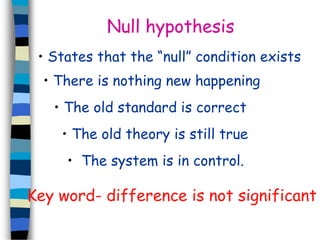
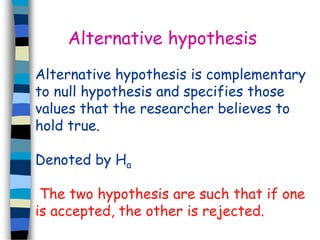
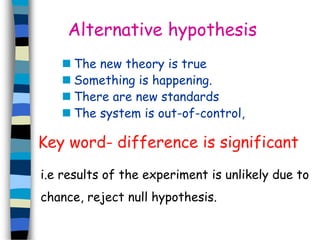
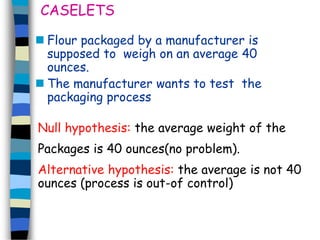
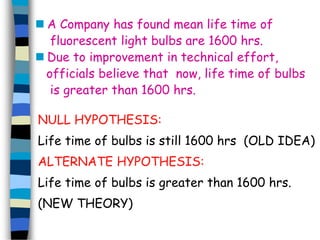
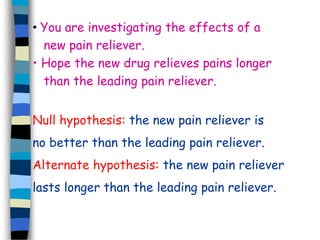
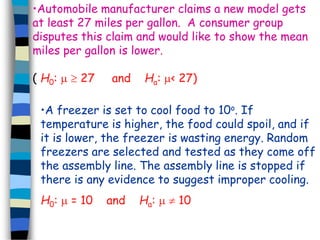
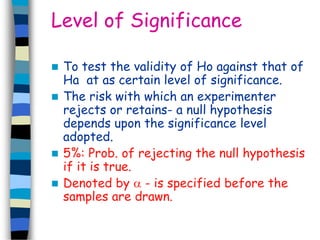
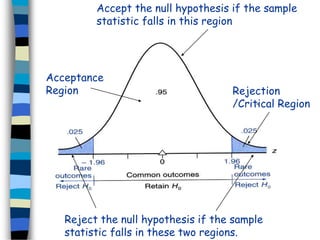
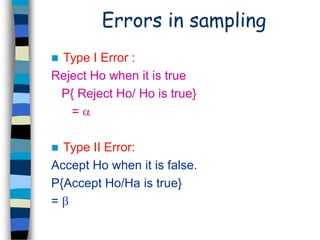
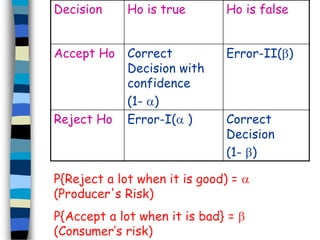
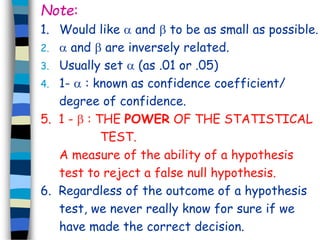
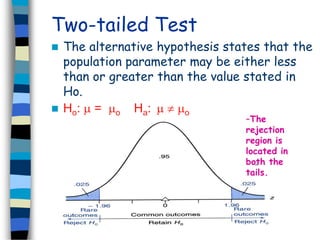
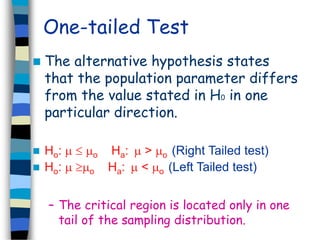
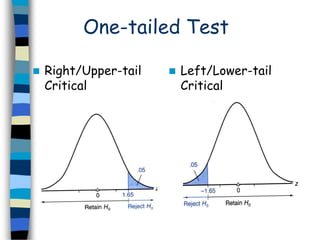
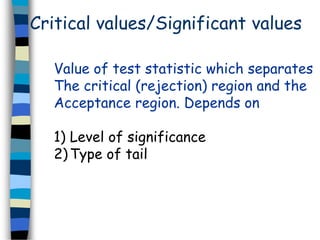
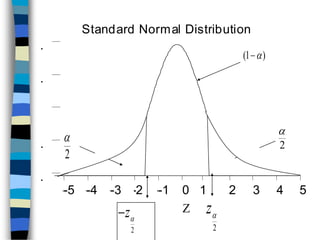
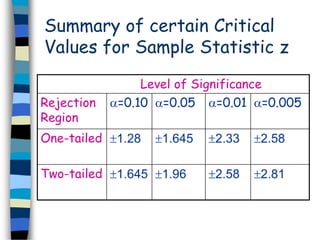
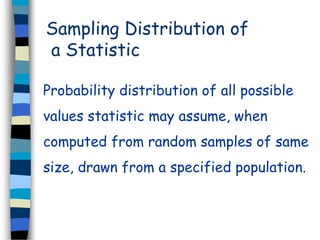
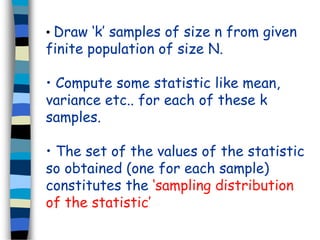
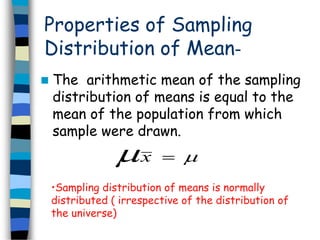
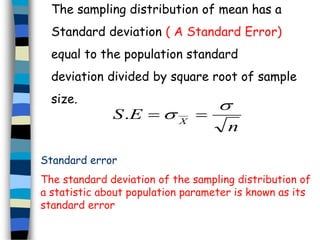
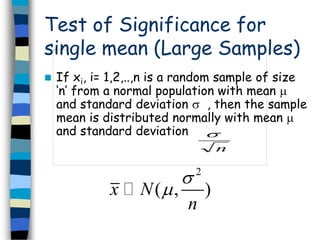
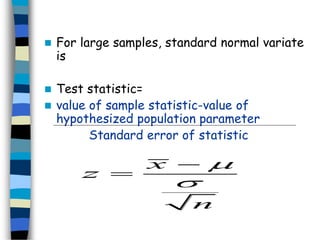
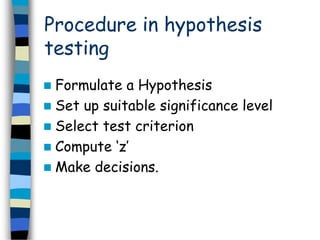
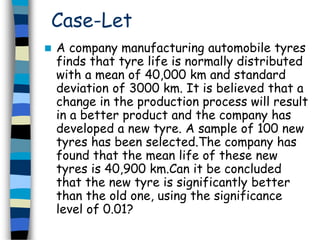
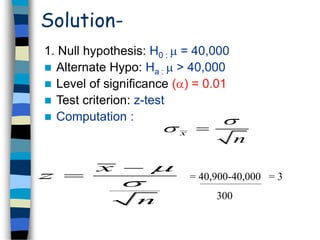
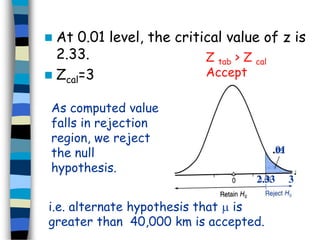
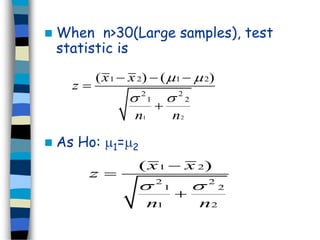
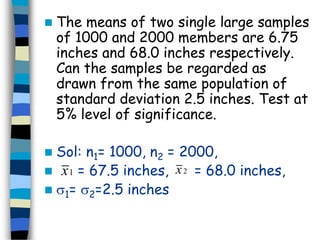
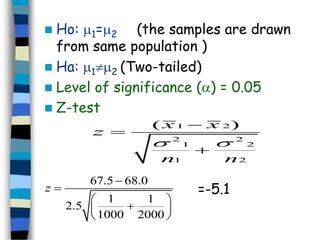
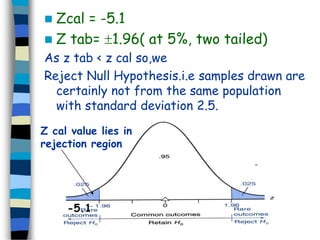


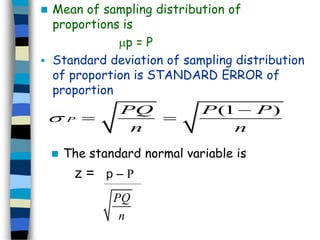

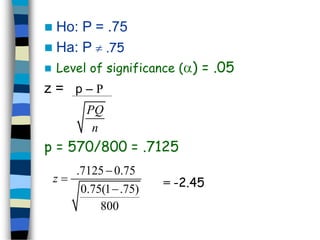
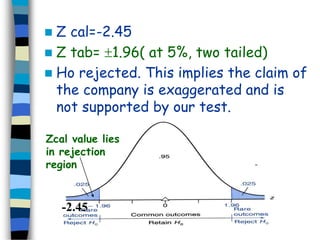
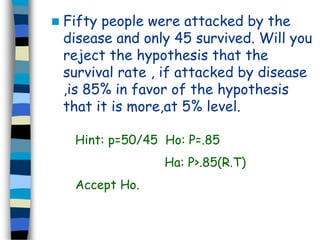


The document discusses sampling and hypothesis testing. It defines key concepts like population, sample, parameter, statistic, sampling distribution, null hypothesis, alternative hypothesis, type I and type II errors. It explains different sampling methods and how to test hypotheses about population means using z-tests. Examples are provided to illustrate hypothesis testing for single and two population means. The summary tests hypotheses about population means using z-scores and critical values at given significance levels.