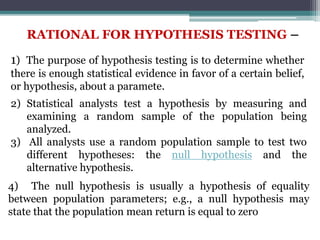
This document provides an overview of hypotheses testing in research. It defines a hypothesis as an explanation or proposition that can be tested scientifically. The main points covered are:
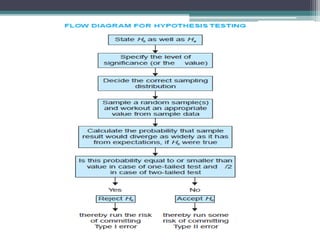
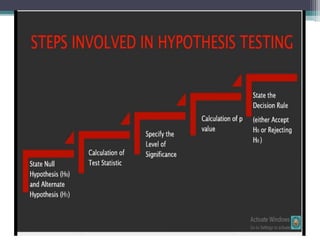
1. The general procedure for hypothesis testing involves making formal statements of the null and alternative hypotheses, selecting a significance level, choosing a statistical distribution, collecting a random sample, calculating probabilities, and comparing probabilities to determine whether to reject or fail to reject the null hypothesis.
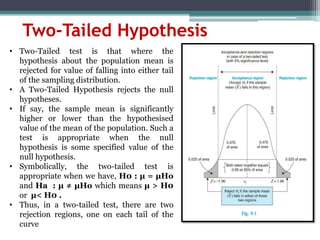
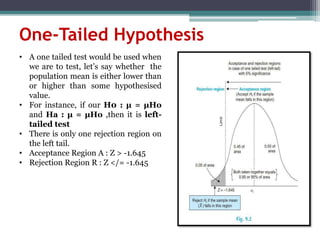
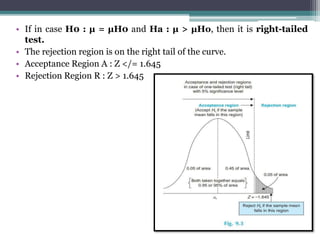
2. There are two types of hypotheses tests - one-tailed and two-tailed. A one-tailed test has one rejection region while a two-tailed test has two rejection regions, one in each tail.
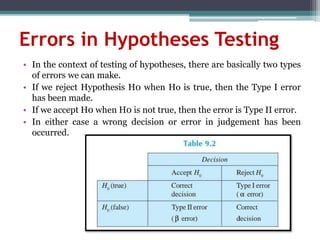
3. Errors in hypothesis testing can occur when the null hypothesis
INTRODUCTION
CHARACTERISTICS OF A HYPOTHESIS
CRITERIA FOR HYPOTHESIS CONSTRUCTION
STEPS IN HYPOTHESIS TESTING
SOURCES OF HYPOTHESIS
APPROACHES TO HYPOTHESIS TESTING
THE LOGIC OF HYPOTHESIS TESTING
TYPES OF ERRORS IN HYPOTHESIS
INTRODUCTION
CHARACTERISTICS OF A HYPOTHESIS
CRITERIA FOR HYPOTHESIS CONSTRUCTION
STEPS IN HYPOTHESIS TESTING
SOURCES OF HYPOTHESIS
APPROACHES TO HYPOTHESIS TESTING
THE LOGIC OF HYPOTHESIS TESTING
TYPES OF ERRORS IN HYPOTHESIS
Hypothesis Testing is important part of research, based on hypothesis testing we can check the truth of presumes hypothesis (Research Statement or Research Methodology )
The number that divides the normal distribution into region where we will reject the null hypothesis and the region where we fail to reject the null hypothesis. For normal distribution Z at 5% level of significance (z= plus-minus 1.96) is often referred to as the critical value (or critical region).
The ppt gives an idea about basic concept of Estimation. point and interval. Properties of good estimate is also covered. Confidence interval for single means, difference between two means, proportion and difference of two proportion for different sample sizes are included along with case studies.
-Hypotheses
-What is Hypothesis testing
-Basic Concepts in Hypotheses Testing (in detail)
~Alternate Hypothesis
~Level of Significance
~Critical Region
~Decision Rule(Test of Hypothesis)
~Type I Error & Type II Error
~Power of Test
~One Tailed & Two Tailed Test
~One Sample & Two Sample Tests
` Types of Hypotheses
` Steps in Hypotheses Testing
~Parametric & Non Parametric Tests
Hypothesis testing and estimation are used to reach conclusions about a population by examining a sample of that population.
Hypothesis testing is widely used in medicine, dentistry, health care, biology and other fields as a means to draw conclusions about the nature of populations
Similar to TOPIC- HYPOTHESIS TESTING RMS.pptx (20)
Unit 8 - Information and Communication Technology (Paper I).pdfThiyagu K
This slides describes the basic concepts of ICT, basics of Email, Emerging Technology and Digital Initiatives in Education. This presentations aligns with the UGC Paper I syllabus.
A Strategic Approach: GenAI in EducationPeter Windle
Artificial Intelligence (AI) technologies such as Generative AI, Image Generators and Large Language Models have had a dramatic impact on teaching, learning and assessment over the past 18 months. The most immediate threat AI posed was to Academic Integrity with Higher Education Institutes (HEIs) focusing their efforts on combating the use of GenAI in assessment. Guidelines were developed for staff and students, policies put in place too. Innovative educators have forged paths in the use of Generative AI for teaching, learning and assessments leading to pockets of transformation springing up across HEIs, often with little or no top-down guidance, support or direction.
This Gasta posits a strategic approach to integrating AI into HEIs to prepare staff, students and the curriculum for an evolving world and workplace. We will highlight the advantages of working with these technologies beyond the realm of teaching, learning and assessment by considering prompt engineering skills, industry impact, curriculum changes, and the need for staff upskilling. In contrast, not engaging strategically with Generative AI poses risks, including falling behind peers, missed opportunities and failing to ensure our graduates remain employable. The rapid evolution of AI technologies necessitates a proactive and strategic approach if we are to remain relevant.
The Roman Empire A Historical Colossus.pdfkaushalkr1407
The Roman Empire, a vast and enduring power, stands as one of history's most remarkable civilizations, leaving an indelible imprint on the world. It emerged from the Roman Republic, transitioning into an imperial powerhouse under the leadership of Augustus Caesar in 27 BCE. This transformation marked the beginning of an era defined by unprecedented territorial expansion, architectural marvels, and profound cultural influence.
The empire's roots lie in the city of Rome, founded, according to legend, by Romulus in 753 BCE. Over centuries, Rome evolved from a small settlement to a formidable republic, characterized by a complex political system with elected officials and checks on power. However, internal strife, class conflicts, and military ambitions paved the way for the end of the Republic. Julius Caesar’s dictatorship and subsequent assassination in 44 BCE created a power vacuum, leading to a civil war. Octavian, later Augustus, emerged victorious, heralding the Roman Empire’s birth.
Under Augustus, the empire experienced the Pax Romana, a 200-year period of relative peace and stability. Augustus reformed the military, established efficient administrative systems, and initiated grand construction projects. The empire's borders expanded, encompassing territories from Britain to Egypt and from Spain to the Euphrates. Roman legions, renowned for their discipline and engineering prowess, secured and maintained these vast territories, building roads, fortifications, and cities that facilitated control and integration.
The Roman Empire’s society was hierarchical, with a rigid class system. At the top were the patricians, wealthy elites who held significant political power. Below them were the plebeians, free citizens with limited political influence, and the vast numbers of slaves who formed the backbone of the economy. The family unit was central, governed by the paterfamilias, the male head who held absolute authority.
Culturally, the Romans were eclectic, absorbing and adapting elements from the civilizations they encountered, particularly the Greeks. Roman art, literature, and philosophy reflected this synthesis, creating a rich cultural tapestry. Latin, the Roman language, became the lingua franca of the Western world, influencing numerous modern languages.
Roman architecture and engineering achievements were monumental. They perfected the arch, vault, and dome, constructing enduring structures like the Colosseum, Pantheon, and aqueducts. These engineering marvels not only showcased Roman ingenuity but also served practical purposes, from public entertainment to water supply.
Instructions for Submissions thorugh G- Classroom.pptxJheel Barad
This presentation provides a briefing on how to upload submissions and documents in Google Classroom. It was prepared as part of an orientation for new Sainik School in-service teacher trainees. As a training officer, my goal is to ensure that you are comfortable and proficient with this essential tool for managing assignments and fostering student engagement.
Francesca Gottschalk - How can education support child empowerment.pptxEduSkills OECD
Francesca Gottschalk from the OECD’s Centre for Educational Research and Innovation presents at the Ask an Expert Webinar: How can education support child empowerment?
Model Attribute Check Company Auto PropertyCeline George
In Odoo, the multi-company feature allows you to manage multiple companies within a single Odoo database instance. Each company can have its own configurations while still sharing common resources such as products, customers, and suppliers.
Macroeconomics- Movie Location
This will be used as part of your Personal Professional Portfolio once graded.
Objective:
Prepare a presentation or a paper using research, basic comparative analysis, data organization and application of economic information. You will make an informed assessment of an economic climate outside of the United States to accomplish an entertainment industry objective.
How to Make a Field invisible in Odoo 17Celine George
It is possible to hide or invisible some fields in odoo. Commonly using “invisible” attribute in the field definition to invisible the fields. This slide will show how to make a field invisible in odoo 17.
Palestine last event orientationfvgnh .pptxRaedMohamed3
An EFL lesson about the current events in Palestine. It is intended to be for intermediate students who wish to increase their listening skills through a short lesson in power point.
2. Table of content
• Introduction
• Defination
• Rationale for Hypothesis Testing
• General procedure for Hypothesis Testing
• One Tailed and Two Tailed Hypothesis
• Errors in Hypothesis
3. INTRODUCTION
• Hypothesis is usually considered as the principal
instrument in research.
• Its main function is to suggest new experiments
and observations.
• In fact, many experiments are carried out with
the deliberate object of testing hypotheses.
• Decision-makers often face situations where in
they are interested in testing hypotheses on the
basis of available information and then take
decisions on the basis of such testing.
4. DEFINATION-
• A hypothesis may be defined as a proposition or
a set of proposition set forth as an explanation
for the occurrence of some specified group of
phenomena either asserted merely as a
provisional conjecture to guide some
investigation or accepted as highly probable in
the light of established facts.
• Quite often a research hypothesis is a predictive
statement, capable of being tested by scientific
methods, that relates an independent variable to
some dependent variable.
5. RATIONAL FOR HYPOTHESIS TESTING –
1) The purpose of hypothesis testing is to determine whether
there is enough statistical evidence in favor of a certain belief,
or hypothesis, about a paramete.
2) Statistical analysts test a hypothesis by measuring and
examining a random sample of the population being
analyzed.
3) All analysts use a random population sample to test two
different hypotheses: the null hypothesis and the
alternative hypothesis.
4) The null hypothesis is usually a hypothesis of equality
between population parameters; e.g., a null hypothesis may
state that the population mean return is equal to zero
9. Steps
1. Making a formal statement .
2. Selecting a significance level.
3. Deciding the distribution to use.
4. Selecting a random sample & computing an
appropriate value.
5. Calculation of the probability.
6. Comparing the probability.
10. [1] Making a Formal statement
• The step consists in making a formal statement
of the null hypothesis (H0 ) and also of the
alternative hypothesis (Ha ).
• This means that hypotheses should be clearly
stated, considering the nature of the research
problem .
11. (2) Selecting a significance level.
• The hypotheses are tested on a pre-determined level
of significance and as such the same should be
specified.
• The factors that affect the level of significance are:
• (a) the magnitude of the difference between sample
means .
• (b) the size of the samples.
• (c) the variability of measurements within samples.
• (d) whether the hypothesis is directional or non-
directional.
12. (3) Deciding the distribution to use .
• After deciding the level of significance, the next
step in hypothesis testing is to determine the
appropriate sampling distribution.
• The choice generally remains between normal
distribution and the t-distribution.
• The rules for selecting the correct distribution
are similar to those which we have stated earlier
in the context of estimation.
13. (4) Selecting a random sample &
computing an appropriate
• Another step is to select a random sample(s) and
compute an appropriate value from the sample
data concerning the test statistic utilizing the
relevant distribution.
• In other words, draw a sample to furnish
empirical data.
14. (5) Calculations of the probability.
• One has then to calculate the probability that the
sample result would diverge as widely as it has
from expectations, if the null hypothesis were in
fact true.
15. (6) Comparing the probability
• Yet another step consists in comparing the
probability thus calculated with the specified
value for α , the significance level.
• If the calculated probability is equal to or
smaller than the α value in case of one-tailed test
• then reject the null hypothesis (i.e., accept the
alternative hypothesis), but if the calculated
probability is greater, then accept the null
hypothesis.
16. • In case we reject H0, we run a risk of
committing an error of Type I.
• but if we accept H0 , then we run some risk of
committing an error of Type II.
17.
18. Two-Tailed Hypothesis
• Two-Tailed test is that where the
hypothesis about the population mean is
rejected for value of falling into either tail
of the sampling distribution.
• A Two-Tailed Hypothesis rejects the null
hypotheses.
• If say, the sample mean is significantly
higher or lower than the hypothesised
value of the mean of the population. Such a
test is appropriate when the null
hypothesis is some specified value of the
null hypothesis.
• Symbolically, the two-tailed test is
appropriate when we have, H0 : µ = µHo
and Ha : µ ≠ µHo which means µ > H0
or µ< H0 .
• Thus, in a two-tailed test, there are two
rejection regions, one on each tail of the
curve
19. One-Tailed Hypothesis
• A one tailed test would be used when
we are to test, let’s say whether the
population mean is either lower than
or higher than some hypothesised
value.
• For instance, if our H0 : µ = µHo
and Ha : µ = µHo ,then it is left-
tailed test
• There is only one rejection region on
the left tail.
• Acceptance Region A : Z > -1.645
• Rejection Region R : Z </= -1.645
20. • If in case H0 : µ = µH0 and Ha : µ > µHo, then it is right-tailed
test.
• The rejection region is on the right tail of the curve.
• Acceptance Region A : Z </= 1.645
• Rejection Region R : Z > 1.645
21. Errors in Hypotheses Testing
• In the context of testing of hypotheses, there are basically two types
of errors we can make.
• If we reject Hypothesis H0 when Ho is true, then the Type I error
has been made.
• If we accept H0 when H0 is not true, then the error is Type II error.
• In either case a wrong decision or error in judgement has been
occurred.