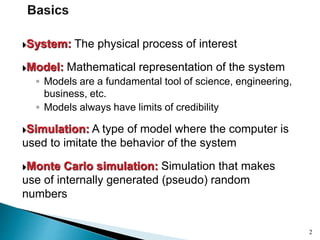
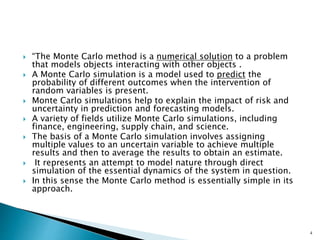
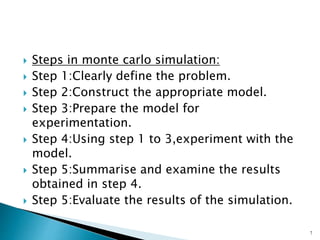
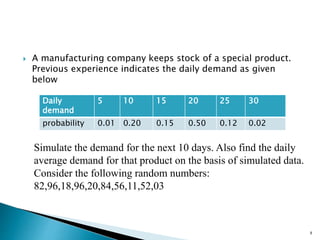
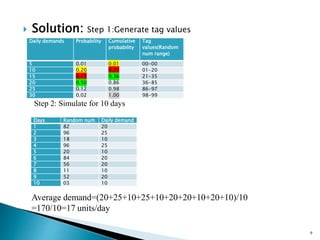
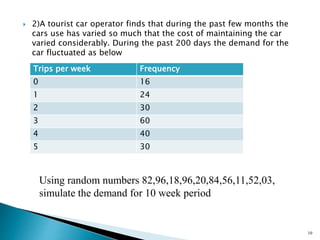
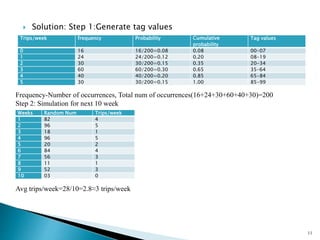
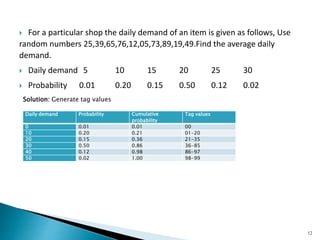
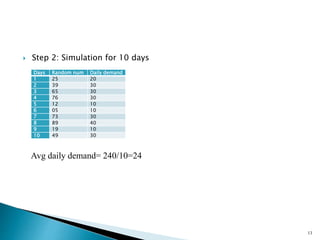
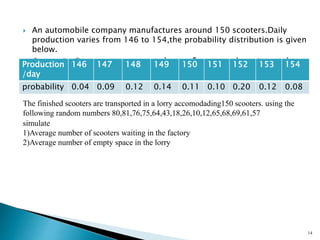
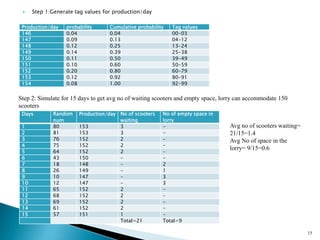
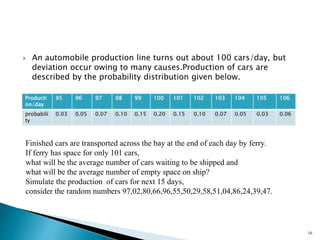
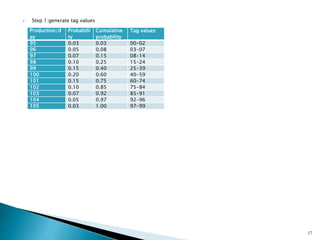
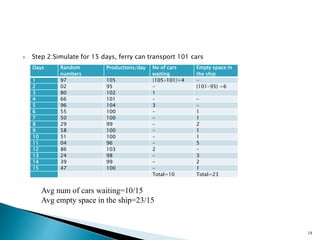
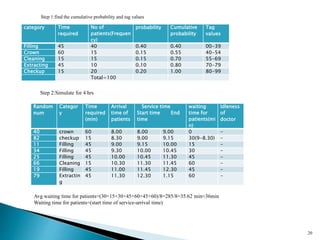
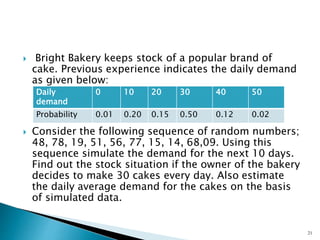
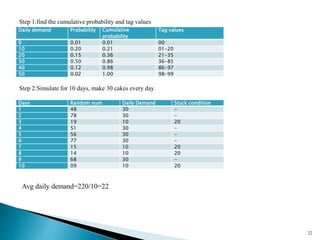
SlideShare a Scribd company logo
System: The physical process of interest
Model: Mathematical representation of the system
◦ Models are a fundamental tool of science, engineering,
business, etc.
◦ Models always have limits of credibility
Simulation: A type of model where the computer is
used to imitate the behavior of the system
Monte Carlo simulation: Simulation that makes
use of internally generated (pseudo) random
numbers
2
3
Focus of course
System
Experiment w/
actual system
Experiment w/
model of system
Physical
Model
Mathematical
Model
Analytical
Model
Simulation
Model
 “The Monte Carlo method is a numerical solution to a problem
that models objects interacting with other objects .
 A Monte Carlo simulation is a model used to predict the
probability of different outcomes when the intervention of
random variables is present.
 Monte Carlo simulations help to explain the impact of risk and
uncertainty in prediction and forecasting models.
 A variety of fields utilize Monte Carlo simulations, including
finance, engineering, supply chain, and science.
 The basis of a Monte Carlo simulation involves assigning
multiple values to an uncertain variable to achieve multiple
results and then to average the results to obtain an estimate.
 It represents an attempt to model nature through direct
simulation of the essential dynamics of the system in question.
 In this sense the Monte Carlo method is essentially simple in its
approach.
4
 Business and finance are plagued by random
variables, Monte Carlo simulations have a vast
array of potential applications in these fields.
 Monte Carlo Method:
 A Monte Carlo simulation takes the variable that
has uncertainty and assigns it a random value.
 The model is then run and a result is provided.
 This process is repeated again and again while
assigning the variable in question with many
different values.
 Once the simulation is complete, the results are
averaged together to provide an estimate.
5
let’s consider a simple system with simple
inputs:
6
• As A, B, C and D are always the same, the output will
always be the same and it can be easily calculated
• Imagine that input A has a range of possible values –
the output will also be variable. And when there are
many more possible inputs and all of them have a range
of possible values, the output is not that simple to
calculate.
• That’s where you need to use Monte Carlo simulation.
 Steps in monte carlo simulation:
 Step 1:Clearly define the problem.
 Step 2:Construct the appropriate model.
 Step 3:Prepare the model for
experimentation.
 Step 4:Using step 1 to 3,experiment with the
model.
 Step 5:Summarise and examine the results
obtained in step 4.
 Step 5:Evaluate the results of the simulation.
7
 A manufacturing company keeps stock of a special product.
Previous experience indicates the daily demand as given
below
8
Daily
demand
5 10 15 20 25 30
probability 0.01 0.20 0.15 0.50 0.12 0.02
Simulate the demand for the next 10 days. Also find the daily
average demand for that product on the basis of simulated data.
Consider the following random numbers:
82,96,18,96,20,84,56,11,52,03
 Solution: Step 1:Generate tag values
9
Daily demands Probability Cumulative
probability
Tag
values(Random
num range)
5 0.01 0.01 00-00
10 0.20 0.21 01-20
15 0.15 0.36 21-35
20 0.50 0.86 36-85
25 0.12 0.98 86-97
30 0.02 1.00 98-99
Step 2: Simulate for 10 days
Days Random num Daily demand
1 82 20
2 96 25
3 18 10
4 96 25
5 20 10
6 84 20
7 56 20
8 11 10
9 52 20
10 03 10
Average demand=(20+25+10+25+10+20+20+10+20+10)/10
=170/10=17 units/day
 2)A tourist car operator finds that during the past few months the
cars use has varied so much that the cost of maintaining the car
varied considerably. During the past 200 days the demand for the
car fluctuated as below
10
Trips per week Frequency
0 16
1 24
2 30
3 60
4 40
5 30
Using random numbers 82,96,18,96,20,84,56,11,52,03,
simulate the demand for 10 week period
 Solution: Step 1:Generate tag values
11
Trips/week frequency Probability Cumulative
probability
Tag values
0 16 16/200=0.08 0.08 00-07
1 24 24/200=0.12 0.20 08-19
2 30 30/200=0.15 0.35 20-34
3 60 60/200=0.30 0.65 35-64
4 40 40/200=0.20 0.85 65-84
5 30 30/200=0.15 1.00 85-99
Frequency-Number of occurrences, Total num of occurrences(16+24+30+60+40+30)=200
Step 2: Simulation for next 10 week
Weeks Random Num Trips/week
1 82 4
2 96 5
3 18 1
4 96 5
5 20 2
6 84 4
7 56 3
8 11 1
9 52 3
10 03 0
Avg trips/week=28/10=2.8≈3 trips/week
 For a particular shop the daily demand of an item is given as follows, Use
random numbers 25,39,65,76,12,05,73,89,19,49.Find the average daily
demand.
 Daily demand 5 10 15 20 25 30
 Probability 0.01 0.20 0.15 0.50 0.12 0.02
Solution: Generate tag values
12
Daily demand Probability Cumulative
probability
Tag values
0 0.01 0.01 00
10 0.20 0.21 01-20
20 0.15 0.36 21-35
30 0.50 0.86 36-85
40 0.12 0.98 86-97
50 0.02 1.00 98-99
 Step 2: Simulation for 10 days
13
Days Random num Daily demand
1 25 20
2 39 30
3 65 30
4 76 30
5 12 10
6 05 10
7 73 30
8 89 40
9 19 10
10 49 30
Avg daily demand= 240/10=24
 An automobile company manufactures around 150 scooters.Daily
production varies from 146 to 154,the probability distribution is given
below.
 Step 1:Generate tag values for production/day
14
Production
/day
146 147 148 149 150 151 152 153 154
probability 0.04 0.09 0.12 0.14 0.11 0.10 0.20 0.12 0.08
The finished scooters are transported in a lorry accomodading150 scooters. using the
following random numbers 80,81,76,75,64,43,18,26,10,12,65,68,69,61,57
simulate
1)Average number of scooters waiting in the factory
2)Average number of empty space in the lorry
 Step 1:Generate tag values for production/day
15
Production/day probability Cumulative probability Tag values
146 0.04 0.04 00-03
147 0.09 0.13 04-12
148 0.12 0.25 13-24
149 0.14 0.39 25-38
150 0.11 0.50 39-49
151 0.10 0.60 50-59
152 0.20 0.80 60-79
153 0.12 0.92 80-91
154 0.08 1.00 92-99
Step 2: Simulate for 15 days to get avg no of waiting scooters and empty space, lorry can accommodate 150
scooters
Days Random
num
Production/day No of scooters
waiting
No of empty space in
lorry
1 80 153 3 -
2 81 153 3 -
3 76 152 2 -
4 75 152 2 -
5 64 152 2 -
6 43 150 - -
7 18 148 - 2
8 26 149 - 1
9 10 147 - 3
10 12 147 - 3
11 65 152 2 -
12 68 152 2 -
13 69 152 2 -
14 61 152 2 -
15 57 151 1 -
Total=21 Total=9
Avg no of scooters waiting=
21/15=1.4
Avg No of space in the
lorry= 9/15=0.6
 An automobile production line turns out about 100 cars/day, but
deviation occur owing to many causes.Production of cars are
described by the probability distribution given below.
16
Producti
on/day
95 96 97 98 99 100 101 102 103 104 105 106
probabili
ty
0.03 0.05 0.07 0.10 0.15 0.20 0.15 0.10 0.07 0.05 0.03 0.06
Finished cars are transported across the bay at the end of each day by ferry.
If ferry has space for only 101 cars,
what will be the average number of cars waiting to be shipped and
what will be the average number of empty space on ship?
Simulate the production of cars for next 15 days,
consider the random numbers 97,02,80,66,96,55,50,29,58,51,04,86,24,39,47.
 Step 1:generate tag values
17
Production/d
ay
Probabilli
ty
Cumulative
probability
Tag values
95 0.03 0.03 00-02
96 0.05 0.08 03-07
97 0.07 0.15 08-14
98 0.10 0.25 15-24
99 0.15 0.40 25-39
100 0.20 0.60 40-59
101 0.15 0.75 60-74
102 0.10 0.85 75-84
103 0.07 0.92 85-91
104 0.05 0.97 92-96
105 0.03 1.00 97-99
 Step 2:Simulate for 15 days, ferry can transport 101 cars
18
Days Random
numbers
Productions/day No of cars
waiting
Empty space in
the ship
1 97 105 |105-101|=4 -
2 02 95 - (101-95) =6
3 80 102 1
4 66 101 - -
5 96 104 3 -
6 55 100 - 1
7 50 100 - 1
8 29 99 - 2
9 58 100 - 1
10 51 100 - 1
11 04 96 - 5
12 86 103 2 -
13 24 98 - 3
14 39 99 - 2
15 47 100 - 1
Total=10 Total=23
Avg num of cars waiting=10/15
Avg empty space in the ship=23/15
 Strong is a dentist who schedules all her patients for 30 minutes
appointment. Some of the patients take more or less than 30min depending
on the type of dental works to be done. The following summary shows the
various categories of work,their probability and the time actually needed to
complete the work
19
Category Filling crown cleaning extracting checkup
Time
required
45 60 15 45 15
Number of
patients
40 15 15 10 20
Simulate the dentist clinic for 4 hrs and find out the avg waiting
time for the patients as well as the idleness of doctor.Assume
that the ptients show up at the clinic at exactly scheduled time.
Arrival time starts at 8AM.Use the following random number
for handling the same 40,82,11,34,25,66,19,79
category Time
required
No of
patients(Frequen
cy)
probability Cumulative
probability
Tag
values
Filling 45 40 0.40 0.40 00-39
Crown 60 15 0.15 0.55 40-54
Cleaning 15 15 0.15 0.70 55-69
Extracting 45 10 0.10 0.80 70-79
Checkup 15 20 0.20 1.00 80-99
Total=100
20
Random
num
Categor
y
Time
required
(min)
Arrival
time of
patients
Service time
Start time End
time
waiting
time for
patients(mi
n)
Idleness
of
doctor
40 crown 60 8.00 8.00 9.00 0 -
82 checkup 15 8.30 9.00 9.15 30(9-8.30) -
11 Filling 45 9.00 9.15 10.00 15 -
34 Filling 45 9.30 10.00 10.45 30 -
25 Filling 45 10.00 10.45 11.30 45 -
66 Cleaning 15 10.30 11.30 11.45 60 -
19 Filling 45 11.00 11.45 12.30 45 -
79 Extractin
g
45 11.30 12.30 1.15 60 -
Step 1:find the cumulative probability and tag values
Step 2:Simulate for 4 hrs
Avg waiting time for patients=(30+15+30+45+60+45+60)/8=285/8=35.62 min≈36min
Waiting time for patients=(start time of service-arrival time)
 Bright Bakery keeps stock of a popular brand of
cake. Previous experience indicates the daily demand
as given below:
 Consider the following sequence of random numbers;
48, 78, 19, 51, 56, 77, 15, 14, 68,09. Using this
sequence simulate the demand for the next 10 days.
Find out the stock situation if the owner of the bakery
decides to make 30 cakes every day. Also estimate
the daily average demand for the cakes on the basis
of simulated data.
21
Daily
demand
0 10 20 30 40 50
Probability 0.01 0.20 0.15 0.50 0.12 0.02
Daily demand Probability Cumulative
probability
Tag values
0 0.01 0.01 00
10 0.20 0.21 01-20
20 0.15 0.36 21-35
30 0.50 0.86 36-85
40 0.12 0.98 86-97
50 0.02 1.00 98-99
22
Step 1:find the cumulative probability and tag values
Step 2:Simulate for 10 days, make 30 cakes every day
Days Random num Daily Demand Stock condition
1 48 30 -
2 78 30 -
3 19 10 20
4 51 30 -
5 56 30 -
6 77 30 -
7 15 10 20
8 14 10 20
9 68 30 -
10 09 10 20
Avg daily demand=220/10=22
Verification and validation are critical parts of practical
implementation
Verification pertains to whether software correctly
implements specified model
Validation pertains to whether the simulation model
(perfectly coded) is acceptable representation
◦ Are the assumptions reasonable?
Accreditation is an official determination (U.S. DoD) that
a simulation is acceptable for particular purpose(s)
 Project Appraisal
 We can evaluate the likely profitability of a project
using these techniques in the light of many
uncertainties using this technique.
23
 RISK ANALYSIS AND MONTE CARLO SIMULATION
 Risk analysis is the systematic study of uncertainties and risks we
encounter in business, engineering, public policy, and many other areas.
 Risk analysts seek to identify the risks faced by an institution or
business unit, understand how and when they arise, and estimate the
impact (financial or otherwise) of adverse outcomes.
 Uncertainty and risk are issues that virtually every business analyst must
deal with, sooner or later.
 Monte Carlo simulation is a powerful quantitative tool often used in risk
analysis.
 Uncertainty is an intrinsic feature of some parts of nature – it is the same
for all observers. But risk is specific to a person or company – it is not
the same for all observers.
 Most business and investment decisions are choices that involve “taking
a calculated risk” – and risk analysis can give us better ways to make the
calculation.
 Risk analysis in computers are done using what-if analysis.
24

More Related Content

What's hot

Monte Carlo Simulations
Monte Carlo SimulationsMonte Carlo Simulations
Monte Carlo Simulationsgfbreaux
 
Dynamic Programming
Dynamic ProgrammingDynamic Programming
Dynamic Programmingcontact2kazi
 
Operations research-an-introduction
Operations research-an-introductionOperations research-an-introduction
Operations research-an-introductionManoj Bhambu
 
OPERATION RESEARCH Simulation
OPERATION RESEARCH SimulationOPERATION RESEARCH Simulation
OPERATION RESEARCH SimulationKomal Hambir
 
Decision theory
Decision theoryDecision theory
Decision theorySurekha98
 
QUEUING THEORY
QUEUING THEORYQUEUING THEORY
QUEUING THEORYavtarsingh
 
Lecture: Monte Carlo Methods
Lecture: Monte Carlo MethodsLecture: Monte Carlo Methods
Lecture: Monte Carlo MethodsFrank Kienle
 
Business Application of Operation Research
Business Application of Operation ResearchBusiness Application of Operation Research
Business Application of Operation ResearchAshim Roy
 
Chp. 2 simulation examples
Chp. 2 simulation examplesChp. 2 simulation examples
Chp. 2 simulation examplesPravesh Negi
 
Simulation Techniques
Simulation TechniquesSimulation Techniques
Simulation Techniquesmailrenuka
 
Transportation Problem
Transportation ProblemTransportation Problem
Transportation ProblemAlvin Niere
 
PROJECT ON QUEUING THEORY
PROJECT ON QUEUING THEORYPROJECT ON QUEUING THEORY
PROJECT ON QUEUING THEORYTulika Garg
 
COMPUTERIZED LAYOUT METHODS ,CRAFT , ALDEP
COMPUTERIZED LAYOUT METHODS ,CRAFT , ALDEPCOMPUTERIZED LAYOUT METHODS ,CRAFT , ALDEP
COMPUTERIZED LAYOUT METHODS ,CRAFT , ALDEPMANI KRISHNA
 
Operational research queuing theory
Operational research queuing theoryOperational research queuing theory
Operational research queuing theoryVidhya Kannan
 
Operation research and its application
Operation research and its applicationOperation research and its application
Operation research and its applicationpriya sinha
 

What's hot (20)

Transportation problems
Transportation problemsTransportation problems
Transportation problems
 
Monte Carlo Simulations
Monte Carlo SimulationsMonte Carlo Simulations
Monte Carlo Simulations
 
Dynamic Programming
Dynamic ProgrammingDynamic Programming
Dynamic Programming
 
Queuing theory
Queuing theoryQueuing theory
Queuing theory
 
Monte carlo
Monte carloMonte carlo
Monte carlo
 
Unit 5 or
Unit 5 orUnit 5 or
Unit 5 or
 
Operations research-an-introduction
Operations research-an-introductionOperations research-an-introduction
Operations research-an-introduction
 
OPERATION RESEARCH Simulation
OPERATION RESEARCH SimulationOPERATION RESEARCH Simulation
OPERATION RESEARCH Simulation
 
Decision theory
Decision theoryDecision theory
Decision theory
 
QUEUING THEORY
QUEUING THEORYQUEUING THEORY
QUEUING THEORY
 
Game theory
Game theoryGame theory
Game theory
 
Lecture: Monte Carlo Methods
Lecture: Monte Carlo MethodsLecture: Monte Carlo Methods
Lecture: Monte Carlo Methods
 
Business Application of Operation Research
Business Application of Operation ResearchBusiness Application of Operation Research
Business Application of Operation Research
 
Chp. 2 simulation examples
Chp. 2 simulation examplesChp. 2 simulation examples
Chp. 2 simulation examples
 
Simulation Techniques
Simulation TechniquesSimulation Techniques
Simulation Techniques
 
Transportation Problem
Transportation ProblemTransportation Problem
Transportation Problem
 
PROJECT ON QUEUING THEORY
PROJECT ON QUEUING THEORYPROJECT ON QUEUING THEORY
PROJECT ON QUEUING THEORY
 
COMPUTERIZED LAYOUT METHODS ,CRAFT , ALDEP
COMPUTERIZED LAYOUT METHODS ,CRAFT , ALDEPCOMPUTERIZED LAYOUT METHODS ,CRAFT , ALDEP
COMPUTERIZED LAYOUT METHODS ,CRAFT , ALDEP
 
Operational research queuing theory
Operational research queuing theoryOperational research queuing theory
Operational research queuing theory
 
Operation research and its application
Operation research and its applicationOperation research and its application
Operation research and its application
 

Similar to Unit 2 monte carlo simulation

Similar to Unit 2 monte carlo simulation (20)

Simulation technique in OR
Simulation technique in ORSimulation technique in OR
Simulation technique in OR
 
Simulation and modeling lab mnit jaipur.pptx
Simulation and modeling lab mnit jaipur.pptxSimulation and modeling lab mnit jaipur.pptx
Simulation and modeling lab mnit jaipur.pptx
 
Tomorrow SEMINAR OR.pptx
Tomorrow SEMINAR OR.pptxTomorrow SEMINAR OR.pptx
Tomorrow SEMINAR OR.pptx
 
SIMULATION.pptx
SIMULATION.pptxSIMULATION.pptx
SIMULATION.pptx
 
Incorporation risk1
Incorporation risk1Incorporation risk1
Incorporation risk1
 
Monte Carlo Simulation for project estimates v1.0
Monte Carlo Simulation for project estimates v1.0Monte Carlo Simulation for project estimates v1.0
Monte Carlo Simulation for project estimates v1.0
 
Location based sales forecast for superstores
Location based sales forecast for superstoresLocation based sales forecast for superstores
Location based sales forecast for superstores
 
Modeling__Simulation computer science and engineering
Modeling__Simulation computer science and engineeringModeling__Simulation computer science and engineering
Modeling__Simulation computer science and engineering
 
phpapp.pptx
phpapp.pptxphpapp.pptx
phpapp.pptx
 
Monte Carlo Simulation
Monte Carlo SimulationMonte Carlo Simulation
Monte Carlo Simulation
 
Simulation (qa ii)
Simulation (qa ii)Simulation (qa ii)
Simulation (qa ii)
 
Mod fpp
Mod fppMod fpp
Mod fpp
 
Simulation by Sunaina Dubey
Simulation by Sunaina DubeySimulation by Sunaina Dubey
Simulation by Sunaina Dubey
 
When Should I Use Simulation?
When Should I Use Simulation?When Should I Use Simulation?
When Should I Use Simulation?
 
2nd Semester MBA (Dec-2015; Jan-2016) Question Papers
2nd Semester MBA (Dec-2015; Jan-2016) Question Papers2nd Semester MBA (Dec-2015; Jan-2016) Question Papers
2nd Semester MBA (Dec-2015; Jan-2016) Question Papers
 
Principles of economics c13
Principles of economics   c13Principles of economics   c13
Principles of economics c13
 
Training Module
Training ModuleTraining Module
Training Module
 
Software testing - EXAMPLE
Software testing  - EXAMPLESoftware testing  - EXAMPLE
Software testing - EXAMPLE
 
Simulation pst
Simulation pstSimulation pst
Simulation pst
 
Line balancing
Line balancing Line balancing
Line balancing
 

More from DevaKumari Vijay

More from DevaKumari Vijay (19)

Unit 1 computer architecture (1)
Unit 1   computer architecture (1)Unit 1   computer architecture (1)
Unit 1 computer architecture (1)
 
Os ch1
Os ch1Os ch1
Os ch1
 
Unit2
Unit2Unit2
Unit2
 
Unit 1
Unit 1Unit 1
Unit 1
 
Decisiontree&game theory
Decisiontree&game theoryDecisiontree&game theory
Decisiontree&game theory
 
Unit2 network optimization
Unit2 network optimizationUnit2 network optimization
Unit2 network optimization
 
Unit4 systemdynamics
Unit4 systemdynamicsUnit4 systemdynamics
Unit4 systemdynamics
 
Unit 3 des
Unit 3 desUnit 3 des
Unit 3 des
 
Unit 1 introduction to simulation
Unit 1 introduction to simulationUnit 1 introduction to simulation
Unit 1 introduction to simulation
 
Unit 3-Greedy Method
Unit 3-Greedy MethodUnit 3-Greedy Method
Unit 3-Greedy Method
 
Unit 5 java-awt (1)
Unit 5 java-awt (1)Unit 5 java-awt (1)
Unit 5 java-awt (1)
 
Unit 4 exceptions and threads
Unit 4 exceptions and threadsUnit 4 exceptions and threads
Unit 4 exceptions and threads
 
Unit3 part3-packages and interfaces
Unit3 part3-packages and interfacesUnit3 part3-packages and interfaces
Unit3 part3-packages and interfaces
 
Unit3 part2-inheritance
Unit3 part2-inheritanceUnit3 part2-inheritance
Unit3 part2-inheritance
 
Unit3 part1-class
Unit3 part1-classUnit3 part1-class
Unit3 part1-class
 
Unit 2-data types,Variables,Operators,Conitionals,loops and arrays
Unit 2-data types,Variables,Operators,Conitionals,loops and arraysUnit 2-data types,Variables,Operators,Conitionals,loops and arrays
Unit 2-data types,Variables,Operators,Conitionals,loops and arrays
 
Unit1 introduction to Java
Unit1 introduction to JavaUnit1 introduction to Java
Unit1 introduction to Java
 
Introduction to design and analysis of algorithm
Introduction to design and analysis of algorithmIntroduction to design and analysis of algorithm
Introduction to design and analysis of algorithm
 
Operations research lpp
Operations research lppOperations research lpp
Operations research lpp
 

Recently uploaded

How to Manage Notification Preferences in the Odoo 17
How to Manage Notification Preferences in the Odoo 17How to Manage Notification Preferences in the Odoo 17
How to Manage Notification Preferences in the Odoo 17Celine George
 
The Last Leaf, a short story by O. Henry
The Last Leaf, a short story by O. HenryThe Last Leaf, a short story by O. Henry
The Last Leaf, a short story by O. HenryEugene Lysak
 
Salient features of Environment protection Act 1986.pptx
Salient features of Environment protection Act 1986.pptxSalient features of Environment protection Act 1986.pptx
Salient features of Environment protection Act 1986.pptxakshayaramakrishnan21
 
Basic_QTL_Marker-assisted_Selection_Sourabh.ppt
Basic_QTL_Marker-assisted_Selection_Sourabh.pptBasic_QTL_Marker-assisted_Selection_Sourabh.ppt
Basic_QTL_Marker-assisted_Selection_Sourabh.pptSourabh Kumar
 
Additional Benefits for Employee Website.pdf
Additional Benefits for Employee Website.pdfAdditional Benefits for Employee Website.pdf
Additional Benefits for Employee Website.pdfjoachimlavalley1
 
How to Split Bills in the Odoo 17 POS Module
How to Split Bills in the Odoo 17 POS ModuleHow to Split Bills in the Odoo 17 POS Module
How to Split Bills in the Odoo 17 POS ModuleCeline George
 
Danh sách HSG Bộ môn cấp trường - Cấp THPT.pdf
Danh sách HSG Bộ môn cấp trường - Cấp THPT.pdfDanh sách HSG Bộ môn cấp trường - Cấp THPT.pdf
Danh sách HSG Bộ môn cấp trường - Cấp THPT.pdfQucHHunhnh
 
Pragya Champions Chalice 2024 Prelims & Finals Q/A set, General Quiz
Pragya Champions Chalice 2024 Prelims & Finals Q/A set, General QuizPragya Champions Chalice 2024 Prelims & Finals Q/A set, General Quiz
Pragya Champions Chalice 2024 Prelims & Finals Q/A set, General QuizPragya - UEM Kolkata Quiz Club
 
Open Educational Resources Primer PowerPoint
Open Educational Resources Primer PowerPointOpen Educational Resources Primer PowerPoint
Open Educational Resources Primer PowerPointELaRue0
 
INU_CAPSTONEDESIGN_비밀번호486_업로드용 발표자료.pdf
INU_CAPSTONEDESIGN_비밀번호486_업로드용 발표자료.pdfINU_CAPSTONEDESIGN_비밀번호486_업로드용 발표자료.pdf
INU_CAPSTONEDESIGN_비밀번호486_업로드용 발표자료.pdfbu07226
 
Sha'Carri Richardson Presentation 202345
Sha'Carri Richardson Presentation 202345Sha'Carri Richardson Presentation 202345
Sha'Carri Richardson Presentation 202345beazzy04
 
MARUTI SUZUKI- A Successful Joint Venture in India.pptx
MARUTI SUZUKI- A Successful Joint Venture in India.pptxMARUTI SUZUKI- A Successful Joint Venture in India.pptx
MARUTI SUZUKI- A Successful Joint Venture in India.pptxbennyroshan06
 
[GDSC YCCE] Build with AI Online Presentation
[GDSC YCCE] Build with AI Online Presentation[GDSC YCCE] Build with AI Online Presentation
[GDSC YCCE] Build with AI Online PresentationGDSCYCCE
 
Jose-Rizal-and-Philippine-Nationalism-National-Symbol-2.pptx
Jose-Rizal-and-Philippine-Nationalism-National-Symbol-2.pptxJose-Rizal-and-Philippine-Nationalism-National-Symbol-2.pptx
Jose-Rizal-and-Philippine-Nationalism-National-Symbol-2.pptxricssacare
 
slides CapTechTalks Webinar May 2024 Alexander Perry.pptx
slides CapTechTalks Webinar May 2024 Alexander Perry.pptxslides CapTechTalks Webinar May 2024 Alexander Perry.pptx
slides CapTechTalks Webinar May 2024 Alexander Perry.pptxCapitolTechU
 
Matatag-Curriculum and the 21st Century Skills Presentation.pptx
Matatag-Curriculum and the 21st Century Skills Presentation.pptxMatatag-Curriculum and the 21st Century Skills Presentation.pptx
Matatag-Curriculum and the 21st Century Skills Presentation.pptxJenilouCasareno
 
Instructions for Submissions thorugh G- Classroom.pptx
Instructions for Submissions thorugh G- Classroom.pptxInstructions for Submissions thorugh G- Classroom.pptx
Instructions for Submissions thorugh G- Classroom.pptxJheel Barad
 
Keeping Your Information Safe with Centralized Security Services
Keeping Your Information Safe with Centralized Security ServicesKeeping Your Information Safe with Centralized Security Services
Keeping Your Information Safe with Centralized Security ServicesTechSoup
 

Recently uploaded (20)

Introduction to Quality Improvement Essentials
Introduction to Quality Improvement EssentialsIntroduction to Quality Improvement Essentials
Introduction to Quality Improvement Essentials
 
How to Manage Notification Preferences in the Odoo 17
How to Manage Notification Preferences in the Odoo 17How to Manage Notification Preferences in the Odoo 17
How to Manage Notification Preferences in the Odoo 17
 
The Last Leaf, a short story by O. Henry
The Last Leaf, a short story by O. HenryThe Last Leaf, a short story by O. Henry
The Last Leaf, a short story by O. Henry
 
Salient features of Environment protection Act 1986.pptx
Salient features of Environment protection Act 1986.pptxSalient features of Environment protection Act 1986.pptx
Salient features of Environment protection Act 1986.pptx
 
Mattingly "AI & Prompt Design: Limitations and Solutions with LLMs"
Mattingly "AI & Prompt Design: Limitations and Solutions with LLMs"Mattingly "AI & Prompt Design: Limitations and Solutions with LLMs"
Mattingly "AI & Prompt Design: Limitations and Solutions with LLMs"
 
Basic_QTL_Marker-assisted_Selection_Sourabh.ppt
Basic_QTL_Marker-assisted_Selection_Sourabh.pptBasic_QTL_Marker-assisted_Selection_Sourabh.ppt
Basic_QTL_Marker-assisted_Selection_Sourabh.ppt
 
Additional Benefits for Employee Website.pdf
Additional Benefits for Employee Website.pdfAdditional Benefits for Employee Website.pdf
Additional Benefits for Employee Website.pdf
 
How to Split Bills in the Odoo 17 POS Module
How to Split Bills in the Odoo 17 POS ModuleHow to Split Bills in the Odoo 17 POS Module
How to Split Bills in the Odoo 17 POS Module
 
Danh sách HSG Bộ môn cấp trường - Cấp THPT.pdf
Danh sách HSG Bộ môn cấp trường - Cấp THPT.pdfDanh sách HSG Bộ môn cấp trường - Cấp THPT.pdf
Danh sách HSG Bộ môn cấp trường - Cấp THPT.pdf
 
Pragya Champions Chalice 2024 Prelims & Finals Q/A set, General Quiz
Pragya Champions Chalice 2024 Prelims & Finals Q/A set, General QuizPragya Champions Chalice 2024 Prelims & Finals Q/A set, General Quiz
Pragya Champions Chalice 2024 Prelims & Finals Q/A set, General Quiz
 
Open Educational Resources Primer PowerPoint
Open Educational Resources Primer PowerPointOpen Educational Resources Primer PowerPoint
Open Educational Resources Primer PowerPoint
 
INU_CAPSTONEDESIGN_비밀번호486_업로드용 발표자료.pdf
INU_CAPSTONEDESIGN_비밀번호486_업로드용 발표자료.pdfINU_CAPSTONEDESIGN_비밀번호486_업로드용 발표자료.pdf
INU_CAPSTONEDESIGN_비밀번호486_업로드용 발표자료.pdf
 
Sha'Carri Richardson Presentation 202345
Sha'Carri Richardson Presentation 202345Sha'Carri Richardson Presentation 202345
Sha'Carri Richardson Presentation 202345
 
MARUTI SUZUKI- A Successful Joint Venture in India.pptx
MARUTI SUZUKI- A Successful Joint Venture in India.pptxMARUTI SUZUKI- A Successful Joint Venture in India.pptx
MARUTI SUZUKI- A Successful Joint Venture in India.pptx
 
[GDSC YCCE] Build with AI Online Presentation
[GDSC YCCE] Build with AI Online Presentation[GDSC YCCE] Build with AI Online Presentation
[GDSC YCCE] Build with AI Online Presentation
 
Jose-Rizal-and-Philippine-Nationalism-National-Symbol-2.pptx
Jose-Rizal-and-Philippine-Nationalism-National-Symbol-2.pptxJose-Rizal-and-Philippine-Nationalism-National-Symbol-2.pptx
Jose-Rizal-and-Philippine-Nationalism-National-Symbol-2.pptx
 
slides CapTechTalks Webinar May 2024 Alexander Perry.pptx
slides CapTechTalks Webinar May 2024 Alexander Perry.pptxslides CapTechTalks Webinar May 2024 Alexander Perry.pptx
slides CapTechTalks Webinar May 2024 Alexander Perry.pptx
 
Matatag-Curriculum and the 21st Century Skills Presentation.pptx
Matatag-Curriculum and the 21st Century Skills Presentation.pptxMatatag-Curriculum and the 21st Century Skills Presentation.pptx
Matatag-Curriculum and the 21st Century Skills Presentation.pptx
 
Instructions for Submissions thorugh G- Classroom.pptx
Instructions for Submissions thorugh G- Classroom.pptxInstructions for Submissions thorugh G- Classroom.pptx
Instructions for Submissions thorugh G- Classroom.pptx
 
Keeping Your Information Safe with Centralized Security Services
Keeping Your Information Safe with Centralized Security ServicesKeeping Your Information Safe with Centralized Security Services
Keeping Your Information Safe with Centralized Security Services
 

Unit 2 monte carlo simulation

  • 1.
  • 2. System: The physical process of interest Model: Mathematical representation of the system ◦ Models are a fundamental tool of science, engineering, business, etc. ◦ Models always have limits of credibility Simulation: A type of model where the computer is used to imitate the behavior of the system Monte Carlo simulation: Simulation that makes use of internally generated (pseudo) random numbers 2
  • 3. 3 Focus of course System Experiment w/ actual system Experiment w/ model of system Physical Model Mathematical Model Analytical Model Simulation Model
  • 4.  “The Monte Carlo method is a numerical solution to a problem that models objects interacting with other objects .  A Monte Carlo simulation is a model used to predict the probability of different outcomes when the intervention of random variables is present.  Monte Carlo simulations help to explain the impact of risk and uncertainty in prediction and forecasting models.  A variety of fields utilize Monte Carlo simulations, including finance, engineering, supply chain, and science.  The basis of a Monte Carlo simulation involves assigning multiple values to an uncertain variable to achieve multiple results and then to average the results to obtain an estimate.  It represents an attempt to model nature through direct simulation of the essential dynamics of the system in question.  In this sense the Monte Carlo method is essentially simple in its approach. 4
  • 5.  Business and finance are plagued by random variables, Monte Carlo simulations have a vast array of potential applications in these fields.  Monte Carlo Method:  A Monte Carlo simulation takes the variable that has uncertainty and assigns it a random value.  The model is then run and a result is provided.  This process is repeated again and again while assigning the variable in question with many different values.  Once the simulation is complete, the results are averaged together to provide an estimate. 5
  • 6. let’s consider a simple system with simple inputs: 6 • As A, B, C and D are always the same, the output will always be the same and it can be easily calculated • Imagine that input A has a range of possible values – the output will also be variable. And when there are many more possible inputs and all of them have a range of possible values, the output is not that simple to calculate. • That’s where you need to use Monte Carlo simulation.
  • 7.  Steps in monte carlo simulation:  Step 1:Clearly define the problem.  Step 2:Construct the appropriate model.  Step 3:Prepare the model for experimentation.  Step 4:Using step 1 to 3,experiment with the model.  Step 5:Summarise and examine the results obtained in step 4.  Step 5:Evaluate the results of the simulation. 7
  • 8.  A manufacturing company keeps stock of a special product. Previous experience indicates the daily demand as given below 8 Daily demand 5 10 15 20 25 30 probability 0.01 0.20 0.15 0.50 0.12 0.02 Simulate the demand for the next 10 days. Also find the daily average demand for that product on the basis of simulated data. Consider the following random numbers: 82,96,18,96,20,84,56,11,52,03
  • 9.  Solution: Step 1:Generate tag values 9 Daily demands Probability Cumulative probability Tag values(Random num range) 5 0.01 0.01 00-00 10 0.20 0.21 01-20 15 0.15 0.36 21-35 20 0.50 0.86 36-85 25 0.12 0.98 86-97 30 0.02 1.00 98-99 Step 2: Simulate for 10 days Days Random num Daily demand 1 82 20 2 96 25 3 18 10 4 96 25 5 20 10 6 84 20 7 56 20 8 11 10 9 52 20 10 03 10 Average demand=(20+25+10+25+10+20+20+10+20+10)/10 =170/10=17 units/day
  • 10.  2)A tourist car operator finds that during the past few months the cars use has varied so much that the cost of maintaining the car varied considerably. During the past 200 days the demand for the car fluctuated as below 10 Trips per week Frequency 0 16 1 24 2 30 3 60 4 40 5 30 Using random numbers 82,96,18,96,20,84,56,11,52,03, simulate the demand for 10 week period
  • 11.  Solution: Step 1:Generate tag values 11 Trips/week frequency Probability Cumulative probability Tag values 0 16 16/200=0.08 0.08 00-07 1 24 24/200=0.12 0.20 08-19 2 30 30/200=0.15 0.35 20-34 3 60 60/200=0.30 0.65 35-64 4 40 40/200=0.20 0.85 65-84 5 30 30/200=0.15 1.00 85-99 Frequency-Number of occurrences, Total num of occurrences(16+24+30+60+40+30)=200 Step 2: Simulation for next 10 week Weeks Random Num Trips/week 1 82 4 2 96 5 3 18 1 4 96 5 5 20 2 6 84 4 7 56 3 8 11 1 9 52 3 10 03 0 Avg trips/week=28/10=2.8≈3 trips/week
  • 12.  For a particular shop the daily demand of an item is given as follows, Use random numbers 25,39,65,76,12,05,73,89,19,49.Find the average daily demand.  Daily demand 5 10 15 20 25 30  Probability 0.01 0.20 0.15 0.50 0.12 0.02 Solution: Generate tag values 12 Daily demand Probability Cumulative probability Tag values 0 0.01 0.01 00 10 0.20 0.21 01-20 20 0.15 0.36 21-35 30 0.50 0.86 36-85 40 0.12 0.98 86-97 50 0.02 1.00 98-99
  • 13.  Step 2: Simulation for 10 days 13 Days Random num Daily demand 1 25 20 2 39 30 3 65 30 4 76 30 5 12 10 6 05 10 7 73 30 8 89 40 9 19 10 10 49 30 Avg daily demand= 240/10=24
  • 14.  An automobile company manufactures around 150 scooters.Daily production varies from 146 to 154,the probability distribution is given below.  Step 1:Generate tag values for production/day  Step 1:Generate tag values for production/day 14 Production /day 146 147 148 149 150 151 152 153 154 probability 0.04 0.09 0.12 0.14 0.11 0.10 0.20 0.12 0.08 The finished scooters are transported in a lorry accomodading150 scooters. using the following random numbers 80,81,76,75,64,43,18,26,10,12,65,68,69,61,57 simulate 1)Average number of scooters waiting in the factory 2)Average number of empty space in the lorry
  • 15.  Step 1:Generate tag values for production/day 15 Production/day probability Cumulative probability Tag values 146 0.04 0.04 00-03 147 0.09 0.13 04-12 148 0.12 0.25 13-24 149 0.14 0.39 25-38 150 0.11 0.50 39-49 151 0.10 0.60 50-59 152 0.20 0.80 60-79 153 0.12 0.92 80-91 154 0.08 1.00 92-99 Step 2: Simulate for 15 days to get avg no of waiting scooters and empty space, lorry can accommodate 150 scooters Days Random num Production/day No of scooters waiting No of empty space in lorry 1 80 153 3 - 2 81 153 3 - 3 76 152 2 - 4 75 152 2 - 5 64 152 2 - 6 43 150 - - 7 18 148 - 2 8 26 149 - 1 9 10 147 - 3 10 12 147 - 3 11 65 152 2 - 12 68 152 2 - 13 69 152 2 - 14 61 152 2 - 15 57 151 1 - Total=21 Total=9 Avg no of scooters waiting= 21/15=1.4 Avg No of space in the lorry= 9/15=0.6
  • 16.  An automobile production line turns out about 100 cars/day, but deviation occur owing to many causes.Production of cars are described by the probability distribution given below. 16 Producti on/day 95 96 97 98 99 100 101 102 103 104 105 106 probabili ty 0.03 0.05 0.07 0.10 0.15 0.20 0.15 0.10 0.07 0.05 0.03 0.06 Finished cars are transported across the bay at the end of each day by ferry. If ferry has space for only 101 cars, what will be the average number of cars waiting to be shipped and what will be the average number of empty space on ship? Simulate the production of cars for next 15 days, consider the random numbers 97,02,80,66,96,55,50,29,58,51,04,86,24,39,47.
  • 17.  Step 1:generate tag values 17 Production/d ay Probabilli ty Cumulative probability Tag values 95 0.03 0.03 00-02 96 0.05 0.08 03-07 97 0.07 0.15 08-14 98 0.10 0.25 15-24 99 0.15 0.40 25-39 100 0.20 0.60 40-59 101 0.15 0.75 60-74 102 0.10 0.85 75-84 103 0.07 0.92 85-91 104 0.05 0.97 92-96 105 0.03 1.00 97-99
  • 18.  Step 2:Simulate for 15 days, ferry can transport 101 cars 18 Days Random numbers Productions/day No of cars waiting Empty space in the ship 1 97 105 |105-101|=4 - 2 02 95 - (101-95) =6 3 80 102 1 4 66 101 - - 5 96 104 3 - 6 55 100 - 1 7 50 100 - 1 8 29 99 - 2 9 58 100 - 1 10 51 100 - 1 11 04 96 - 5 12 86 103 2 - 13 24 98 - 3 14 39 99 - 2 15 47 100 - 1 Total=10 Total=23 Avg num of cars waiting=10/15 Avg empty space in the ship=23/15
  • 19.  Strong is a dentist who schedules all her patients for 30 minutes appointment. Some of the patients take more or less than 30min depending on the type of dental works to be done. The following summary shows the various categories of work,their probability and the time actually needed to complete the work 19 Category Filling crown cleaning extracting checkup Time required 45 60 15 45 15 Number of patients 40 15 15 10 20 Simulate the dentist clinic for 4 hrs and find out the avg waiting time for the patients as well as the idleness of doctor.Assume that the ptients show up at the clinic at exactly scheduled time. Arrival time starts at 8AM.Use the following random number for handling the same 40,82,11,34,25,66,19,79
  • 20. category Time required No of patients(Frequen cy) probability Cumulative probability Tag values Filling 45 40 0.40 0.40 00-39 Crown 60 15 0.15 0.55 40-54 Cleaning 15 15 0.15 0.70 55-69 Extracting 45 10 0.10 0.80 70-79 Checkup 15 20 0.20 1.00 80-99 Total=100 20 Random num Categor y Time required (min) Arrival time of patients Service time Start time End time waiting time for patients(mi n) Idleness of doctor 40 crown 60 8.00 8.00 9.00 0 - 82 checkup 15 8.30 9.00 9.15 30(9-8.30) - 11 Filling 45 9.00 9.15 10.00 15 - 34 Filling 45 9.30 10.00 10.45 30 - 25 Filling 45 10.00 10.45 11.30 45 - 66 Cleaning 15 10.30 11.30 11.45 60 - 19 Filling 45 11.00 11.45 12.30 45 - 79 Extractin g 45 11.30 12.30 1.15 60 - Step 1:find the cumulative probability and tag values Step 2:Simulate for 4 hrs Avg waiting time for patients=(30+15+30+45+60+45+60)/8=285/8=35.62 min≈36min Waiting time for patients=(start time of service-arrival time)
  • 21.  Bright Bakery keeps stock of a popular brand of cake. Previous experience indicates the daily demand as given below:  Consider the following sequence of random numbers; 48, 78, 19, 51, 56, 77, 15, 14, 68,09. Using this sequence simulate the demand for the next 10 days. Find out the stock situation if the owner of the bakery decides to make 30 cakes every day. Also estimate the daily average demand for the cakes on the basis of simulated data. 21 Daily demand 0 10 20 30 40 50 Probability 0.01 0.20 0.15 0.50 0.12 0.02
  • 22. Daily demand Probability Cumulative probability Tag values 0 0.01 0.01 00 10 0.20 0.21 01-20 20 0.15 0.36 21-35 30 0.50 0.86 36-85 40 0.12 0.98 86-97 50 0.02 1.00 98-99 22 Step 1:find the cumulative probability and tag values Step 2:Simulate for 10 days, make 30 cakes every day Days Random num Daily Demand Stock condition 1 48 30 - 2 78 30 - 3 19 10 20 4 51 30 - 5 56 30 - 6 77 30 - 7 15 10 20 8 14 10 20 9 68 30 - 10 09 10 20 Avg daily demand=220/10=22
  • 23. Verification and validation are critical parts of practical implementation Verification pertains to whether software correctly implements specified model Validation pertains to whether the simulation model (perfectly coded) is acceptable representation ◦ Are the assumptions reasonable? Accreditation is an official determination (U.S. DoD) that a simulation is acceptable for particular purpose(s)  Project Appraisal  We can evaluate the likely profitability of a project using these techniques in the light of many uncertainties using this technique. 23
  • 24.  RISK ANALYSIS AND MONTE CARLO SIMULATION  Risk analysis is the systematic study of uncertainties and risks we encounter in business, engineering, public policy, and many other areas.  Risk analysts seek to identify the risks faced by an institution or business unit, understand how and when they arise, and estimate the impact (financial or otherwise) of adverse outcomes.  Uncertainty and risk are issues that virtually every business analyst must deal with, sooner or later.  Monte Carlo simulation is a powerful quantitative tool often used in risk analysis.  Uncertainty is an intrinsic feature of some parts of nature – it is the same for all observers. But risk is specific to a person or company – it is not the same for all observers.  Most business and investment decisions are choices that involve “taking a calculated risk” – and risk analysis can give us better ways to make the calculation.  Risk analysis in computers are done using what-if analysis. 24