Downloaded 146 times
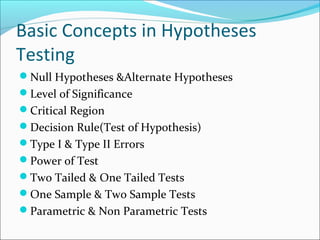
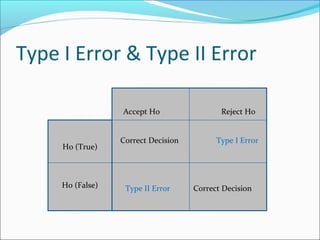
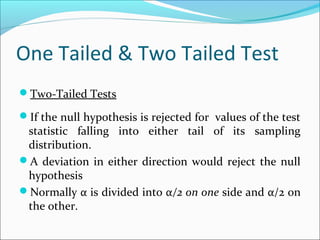
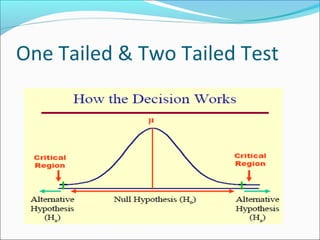
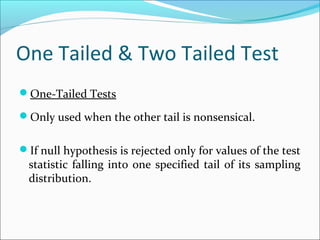
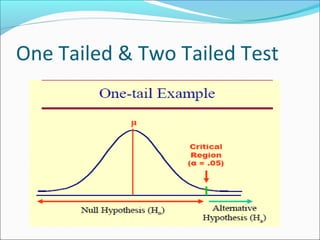
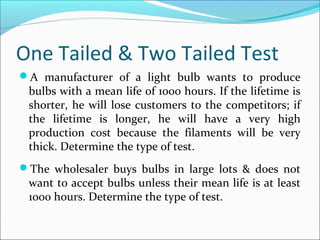
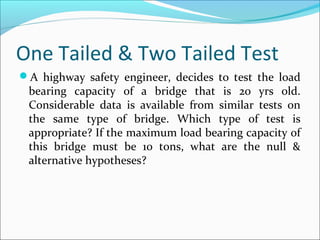
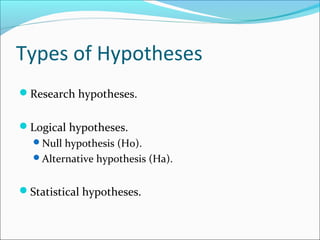
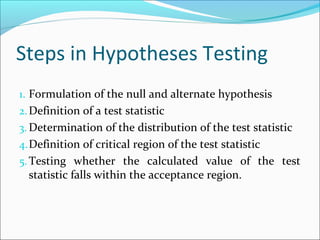
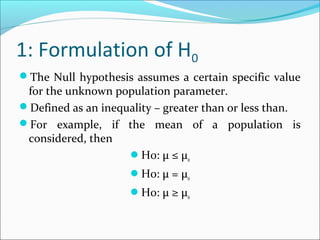
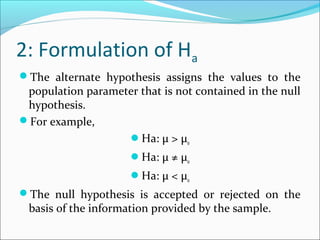
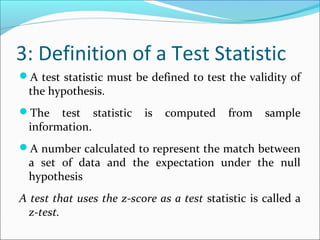
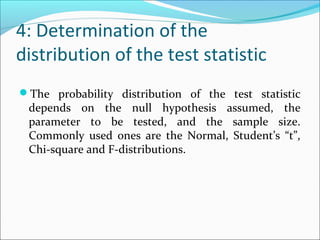
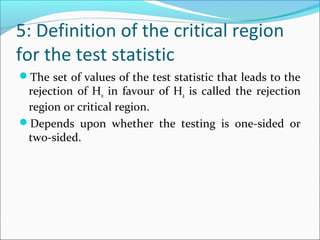
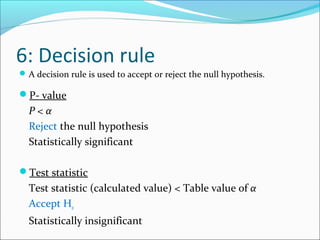
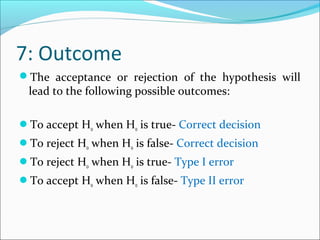
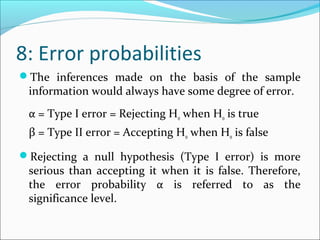
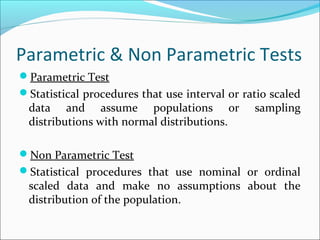
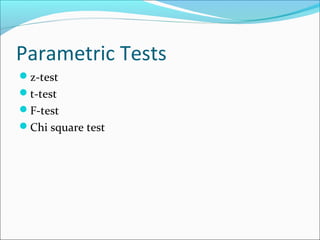
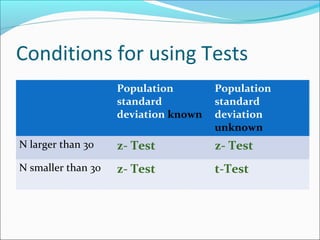
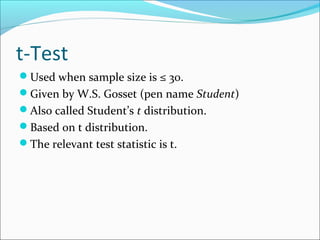
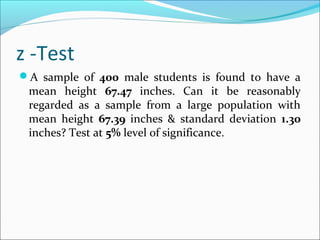
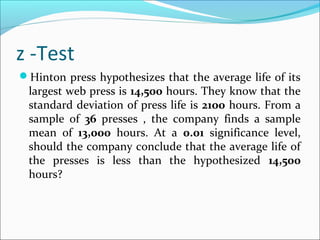
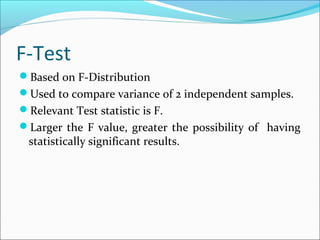
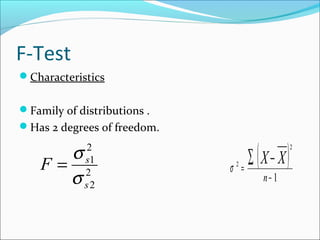

This document provides an overview of key concepts related to formulating and testing hypotheses. It defines a hypothesis as a proposition or claim about a population that can be empirically tested. Hypothesis testing involves examining two opposing hypotheses: the null hypothesis (H0) and alternative hypothesis (Ha). It describes the basic steps of hypothesis testing as formulating the hypotheses, defining a test statistic, determining the distribution of the test statistic, defining the critical region, and making a decision to accept or reject the null hypothesis. Key concepts like type I and type II errors, significance levels, critical values, and one-tailed vs two-tailed tests are also explained. Parametric tests like the z-test, t-test, and


![[DSC Europe 25] Ivan Lukovic & Marija Djukic - From Data to Value: Why Maturi...](https://cdn.slidesharecdn.com/ss_thumbnails/ahrfps8xr6knowwhacxh-1-ivan-marija-dsc-2025-ld-v1-presentation-260115093812-be21adfc-thumbnail.jpg?width=640&height=640&fit=bounds)

![[DSC Europe 25] Bojan Djuricic - Predictive Design Process.pdf](https://cdn.slidesharecdn.com/ss_thumbnails/5awdrbedqdek3gqu2ezy-4-the-predictive-design-bojan-djuricic-260120105856-6c399e9b-thumbnail.jpg?width=640&height=640&fit=bounds)


![[DSC Europe 25] Andrzej Kowalczyk - AI - how to start small and grow in the f...](https://cdn.slidesharecdn.com/ss_thumbnails/oy1zmo94qv6vpcqjvno2-andrzej-kowalczyk-ai-how-to-start-small-and-grow-in-the-future-1-260119121559-cf093b23-thumbnail.jpg?width=640&height=640&fit=bounds)

![[DSC Europe 25] Slobodan Dolinic - Smart and Intelligent Green Region.pptx](https://cdn.slidesharecdn.com/ss_thumbnails/0bribinjsp6ghwtvsvor-2-sigre-slobodan-dolinic-260115093812-c9c10e90-thumbnail.jpg?width=640&height=640&fit=bounds)


