Downloaded 112 times
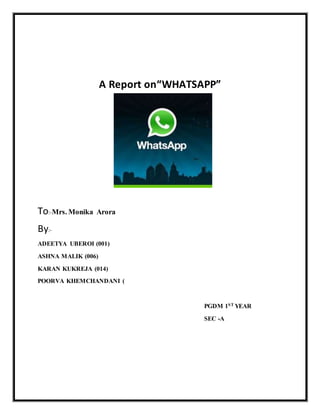


![Countifs
This article describes the formula syntax and usage of the COUNTIFS function in
Microsoft Excel.
Description
Applies criteria to cells across multiple ranges and counts the number of times all
criteria are met.
Syntax
COUNTIFS(criteria_range1, criteria1, [criteria_range2, criteria2]…)
The COUNTIFS function syntax has the following arguments:
criteria_range1 Required. The first range in which to evaluate the associated
criteria.
criteria1 Required. The criteria in the form of a number, expression, cell
reference, or text that define which cells will be counted. For example, criteria can
be expressed as 32, ">32", B4, "apples", or "32".
criteria_range2, criteria2, ... Optional. Additional ranges and their associated
criteria. Up to 127 range/criteria pairs are allowed.
IMPORTANT Each additional range must have the same number of rows and
columns as the criteria_range1argument. The ranges do not have to be adjacent to
each other.](https://image.slidesharecdn.com/whatsappreport-150320030651-conversion-gate01/85/Whatsapp-survery-report-14-320.jpg)


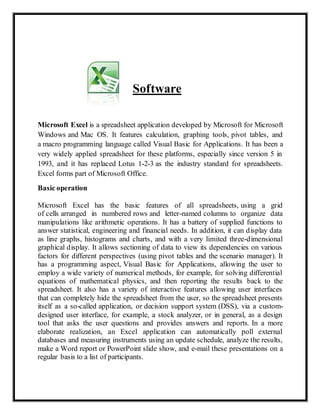
![The V in VLOOKUP stands for vertical. Use VLOOKUP instead of HLOOKUP when your comparison
values are located in a column to the left of the data that you want to find.
Syntax
VLOOKUP (lookup_value, table_array, col_index_num, [range_lookup])](https://image.slidesharecdn.com/whatsappreport-150320030651-conversion-gate01/85/Whatsapp-survery-report-22-320.jpg)


The document is a report on a survey conducted about the use of WhatsApp. It includes an introduction to WhatsApp and the objectives of the survey. The survey was implemented using functions in Microsoft Excel like VLOOKUP, COUNTIF, COUNTIFS, and pivot tables to analyze the data collected. The results showed that people in India are most addicted to WhatsApp and use it regularly to communicate. In the future, WhatsApp may use cloud computing.


